DOGE | 3D PlanPrice broke down instead of sweeping the range, leaving a new set of equal lows as liquidity targets. Structure now favors a patience play.
Triggers for action:
Monthly reclaim: Bullish trigger — reclaiming the M level signals strength, opens path for a trend reversal.
Sweep of equal lows: If price dips and runs the new set of equal lows (gray box), look for signs of absorption or reversal for a long setup.
No trade in the middle—waiting for either a proper liquidity sweep or a confirmed reclaim of the major level.
Crypto market

Eth/Btc✨ Ethereum vs Bitcoin — perhaps a new season is near...
📍 First week of August 2025
From the depths of a long, quiet downtrend,
Ethereum has risen from the 0.018 ~ 0.022 BTC zone...
Where unseen hands quietly caught the fall.
Now standing at 0.031 BTC:
RSI has regained strength, entering bullish territory.
Moving averages are converging — hinting at a possible shift.
All eyes now on the major resistance at 0.042 BTC...
🔮 Possible scenarios:
1️⃣ A breakout above 0.042 BTC → a path toward 0.057 and beyond.
2️⃣ Failure to break resistance → a return to the same mysterious yellow box.
📌 For now, the market breathes with renewed energy...
But is this the renaissance of ETH against BTC?
Or just another dance before the next calm?
🕊️ Patience remains our greatest ally...

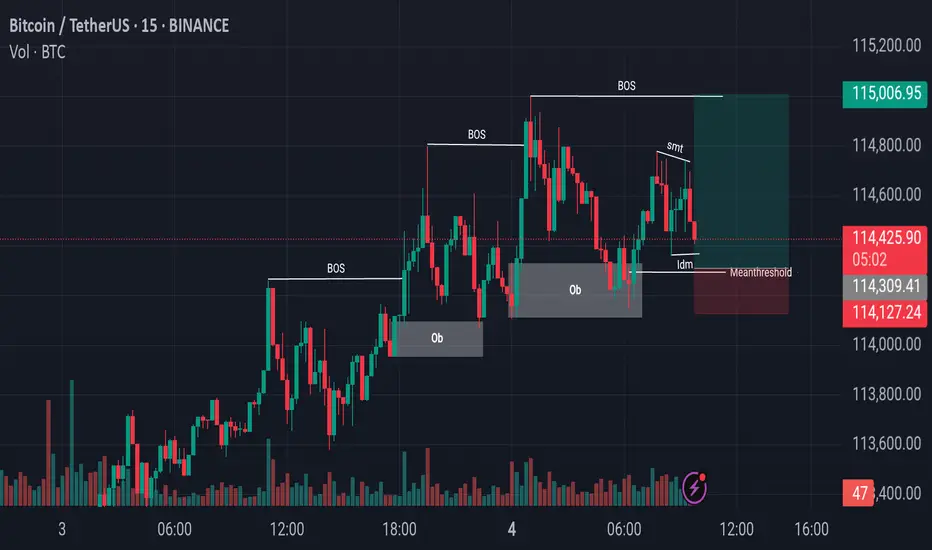
Bitcoin Price Flow From Liquidity Grabs to Structural BreakoutsBitcoin Price Action Analysis:
In recent sessions, Bitcoin has been consistently making Breaks of Structure (BoS) to the upside, indicating a strong bullish trend. Most recently, after forming another BoS, the market retraced downward and precisely tapped into a previously established Bullish Order Block (OB). This reaction led to a temporary upward movement; however, during this process, the market also created a zone of internal liquidity.
Currently, Bitcoin is showing signs of a downward move again, potentially aiming to capture Internal Drawdown Market (IDM) liquidity. Just below this level lies another key Order Block, which could serve as a strong support zone. If the price reacts positively from this region, we might see the market initiate another upward leg, potentially forming the next Break of Structure to continue the bullish narrative.
Note: Always perform your own research (DYOR) before making any trading decisions.
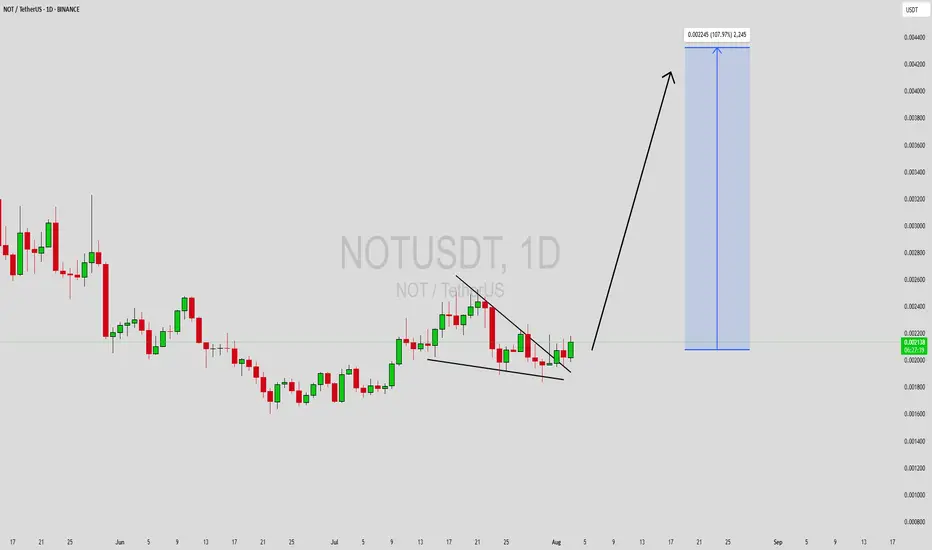
NOTUSDT Forming Falling WedgeNOTUSDT is forming a textbook falling wedge pattern, a well-known bullish reversal signal in technical analysis. After an extended downtrend, the price action has begun to consolidate within a narrowing range, indicating a potential breakout is imminent. Falling wedge formations often lead to explosive upward moves once the price breaks above the upper trendline resistance. With volume gradually picking up and bullish momentum building, NOTUSDT appears poised for a significant rally.
Traders and investors are closely watching this pair due to its high potential for a breakout. Historical price behavior around current levels shows strong accumulation, and the volume profile supports a bullish breakout scenario. The expected upside target projects a gain between 90% to 100%+ if the wedge pattern plays out as anticipated. This setup offers a strong risk-reward opportunity for those looking to catch an early trend reversal.
Market sentiment around NOT (Notcoin) has improved notably, fueled by its strong community, emerging utility in the Telegram ecosystem, and listing support from major exchanges. These fundamentals are adding confidence to the technical setup. The price currently sits at a critical juncture, and a breakout above resistance could attract significant attention and trigger FOMO among retail traders.
As always, confirmation is key—traders should wait for a strong breakout with increased volume before entering. Once confirmed, NOTUSDT could rapidly push toward its upper targets, making this a high-potential trade setup.
✅ Show your support by hitting the like button and
✅ Leaving a comment below! (What is You opinion about this Coin)
Your feedback and engagement keep me inspired to share more insightful market analysis with you!
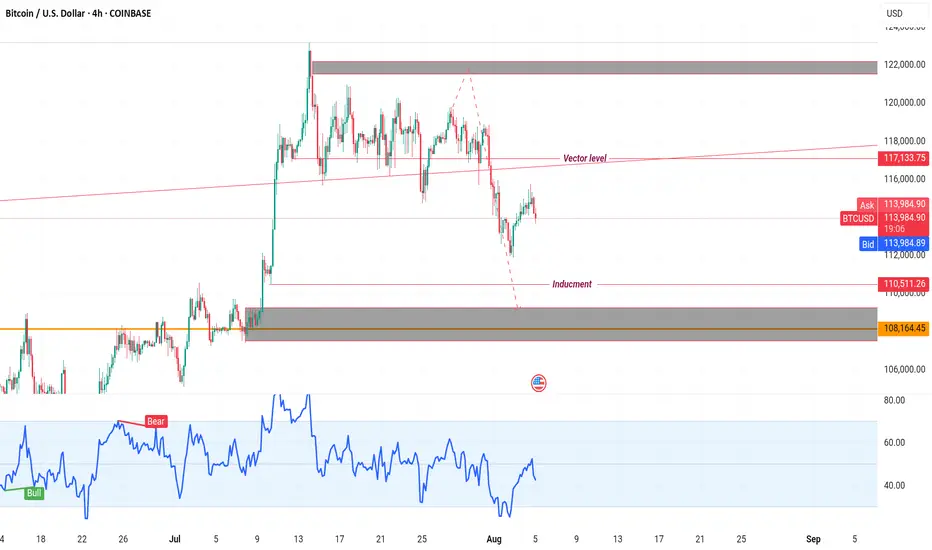
BTC on high time frame
"Hello traders, regarding Bitcoin, as previously mentioned, BTC is in the process of completing its pullback to the 110k zone. Candle formations indicate increasing bearish momentum on higher time frames. In my view, when the price reaches 110k, it will be a crucial point to assess and consider the next potential price level."
If you need further assistance or have more details to discuss, please let me know!
DYDX - long!DYDX is extremly oversold. The bottom formation is visible. Correction seems to be ended. Im in long from 0.50$ and I will be adding to my long in time. The job is to exit somewhere between 4-6$. Cheers!

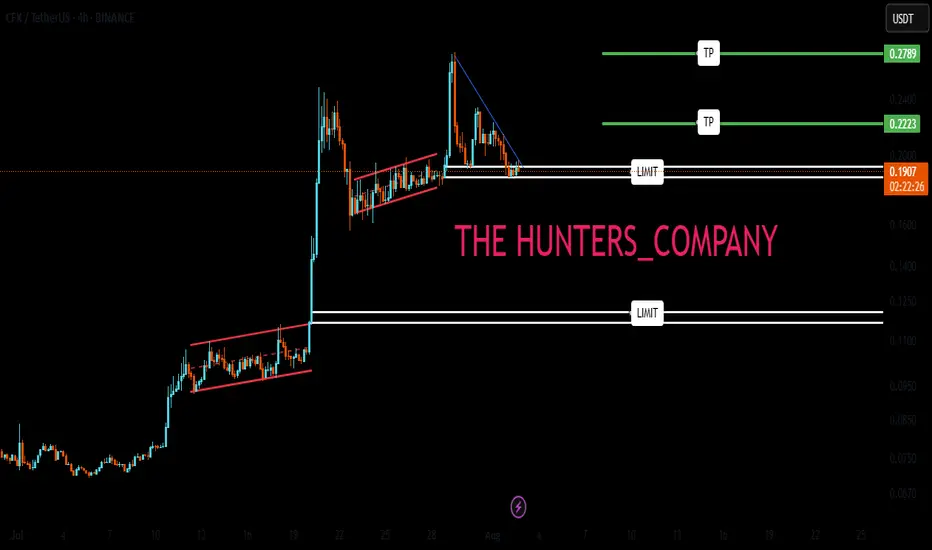
CFX : don't be afraidHello friends🙌
If you take risks, you will win. If you don't, you will regret it.
✅Given the good price growth, now that the price is in a correction phase, there is a good opportunity to buy with risk and capital management, of course, at the specified support levels and move with them to the set targets.
🔥Follow us for more signals🔥
*Trade safely with us*
XRP 4H – Precision Bounce from Golden Pocket After All-Time HighXRP just executed a perfect technical pullback — retracing into the golden pocket (0.618 Fib) after hitting its all-time high. The 4H chart shows textbook structure: a breakout, clean Fibonacci retracement, and an instant reaction from key levels.
📍 0.786 (2.28) marked the original breakout
📍 0.618 (2.58) triggered an aggressive bounce
📍 0.5 (2.79) saw instant rejection on the rebound
📍 All-time high resistance still looms above ~$3.75
What makes this setup especially clean is how XRP respected each Fib level like a playbook — reacting on the dot while Stoch RSI reset completely and flipped upward.
This could be the beginning of a bullish continuation… if we reclaim the mid-range and break above $3.30–$3.50 cleanly.
Until then, this is prime territory for range-bound volatility.
How are you playing it: swing long, short fade, or watching for confirmation?
👇 Drop your setup below.

XRP Short Hedge in Play Against ETH & BTC Divergence 🚨📉 XRP Short Hedge in Play Against ETH & BTC Divergence ⚖️💥
Right now, Bitcoin is sitting at a major lost level: 115,700 . Unless we reclaim that zone , the market structure remains bearish. If BTC does reclaim it—I’ll turn ultra bullish. But until then, I must actively look for some shorts.
And in a sea of liquidity, XRP might offer reliable setups for short-side trades.
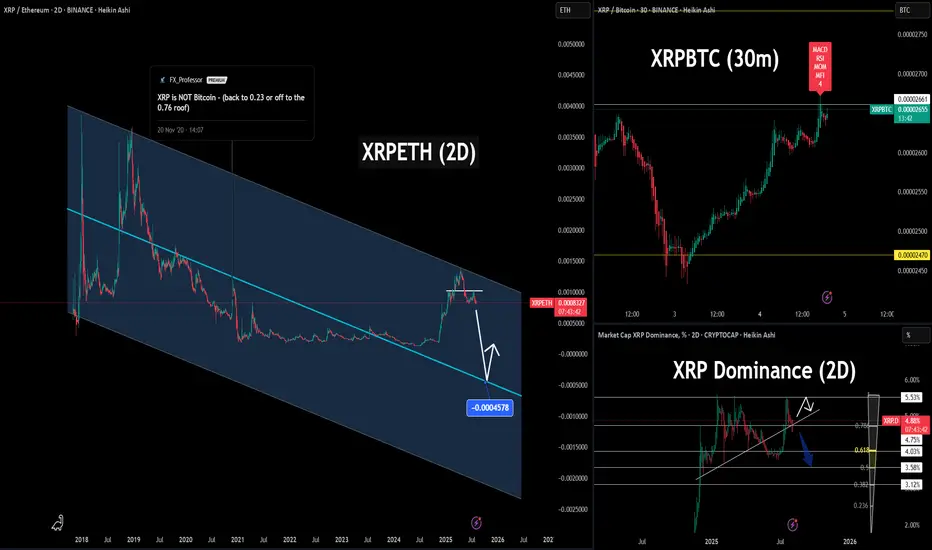
📊 1. XRP vs Ethereum (2D)
We're right at the top of a multi-year descending channel on BINANCE:XRPETH XRPETH. This is a textbook short entry zone , with a potential drop back toward the midline or lower boundary.
✅ Setup: Short XRP / Long ETH — clean hedge with relative strength in ETH.
⏱ 2. CAPITALCOM:XRPBTC XRPBTC (30m)
We now have 4 confirmed bearish divergences on the short-term chart:
🔻 MACD
🔻 RSI
🔻 Momentum
🔻 Money Flow Index (MFI)
This setup has a high probability of reversal, particularly at these horizontal resistance levels.
📉 3. CRYPTOCAP:XRP.D XRP Dominance (2D)
Rejection at 5.53%, again. Now with added Fibonacci confluence levels on the pullback:
0.618 Fib sits right at 4.03%
0.5 Fib near 4.75% (current battle zone)
Deeper liquidity zones at 3.58% and 3.12%
If dominance fails to hold the 4.75% neckline, we could see a full Fibonacci retrace back to the golden ratio— a strong potential drop.
📎 Throwback Chart: Nov 2020
📈 Here's a setup I posted years ago:
👉 XRP is NOT Bitcoin – back to 0.23 or off to the 0.76 roof
That idea nailed the explosive move from $0.23 to $0.76 , and then the collapse back to $0.17.
XRP has a history of sharp pops followed by deep drops — and this looks like another one might be brewing.
🔍 Macro Bearish Factors:
📦 XRP supply = 100 Billion (vs BTC’s 21M cap)
🧠 Ripple controls over 42.5% of total XRP (wallets + escrow)
📉 94% of XRPL txns hold no real value— network activity mostly spam
🕳️ “Dark pool” OTC volume suppresses price discovery
🧱 UNL validator model exposes centralization and network fragility
📊 XRP dominance structurally capped near 5.5%, now rejecting hard again
📌 In conclusion:
This is not about bias, it's about structure and data.
When the charts line up with fundamentals, and liquidity is flowing toward ETH and BTC, XRP becomes the natural hedge.
Short XRP. Long ETH. Watch BTC.
One Love,
The FX PROFESSOR 💙
Disclosure: I am happy to be part of the Trade Nation's Influencer program and receive a monthly fee for using their TradingView charts in my analysis. Awesome broker, where the trader really comes first! 🌟🤝📈
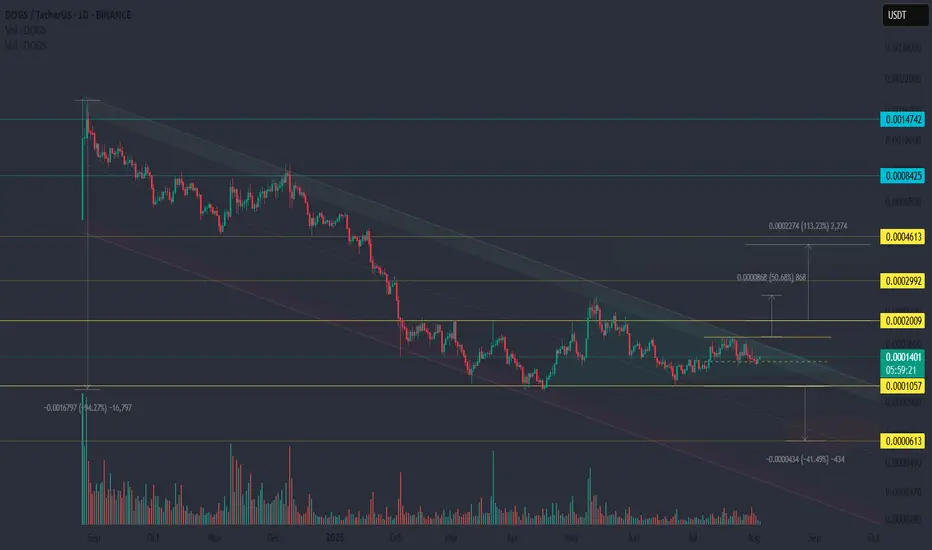
DOGS/USDT — Capitulation Zone. Is the Breakout Coming?The price has been moving sideways for several months, forming a classic low-volatility summer channel.
🔹 Primary trend: still bearish — price remains inside a descending channel
🔹 Volume: mostly low, but occasional spikes near support may signal hidden accumulation
🔹 Formation: a triangle is forming near the top of the channel — false breakouts or wicks are likely
🔹 Sentiment: this is a classic capitulation zone — where most traders give up, exit positions, and lose conviction
📉 When everyone thinks it's dead — that's often where major bottoms are built. This is the time to stick to your risk strategy and position sizing, not emotions.
🐕 DOGS — key reasons to watch:
• Twitter community: 3.4M followers — huge potential for renewed interest
• If memecoins return to trend — moves could be fast and aggressive
📌 Watch closely for a breakout from the triangle — it could define direction for weeks ahead
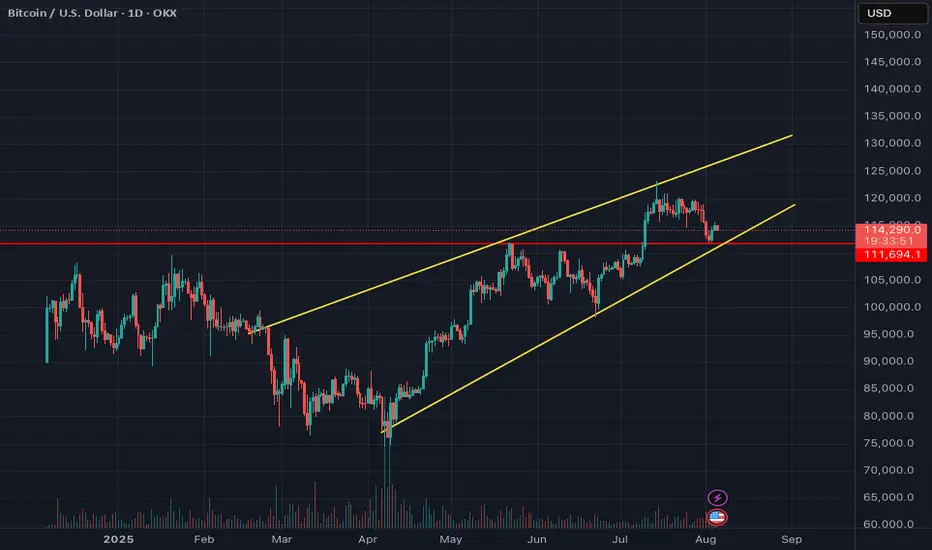
BTC AnalisysI just wonder how it will turn out!
I think if BTC can't break the support line I drew (the "red line"), it will be bullish.
But if BTC breaks the support, the bullish session will end.
It's not a good time to buy BTC.
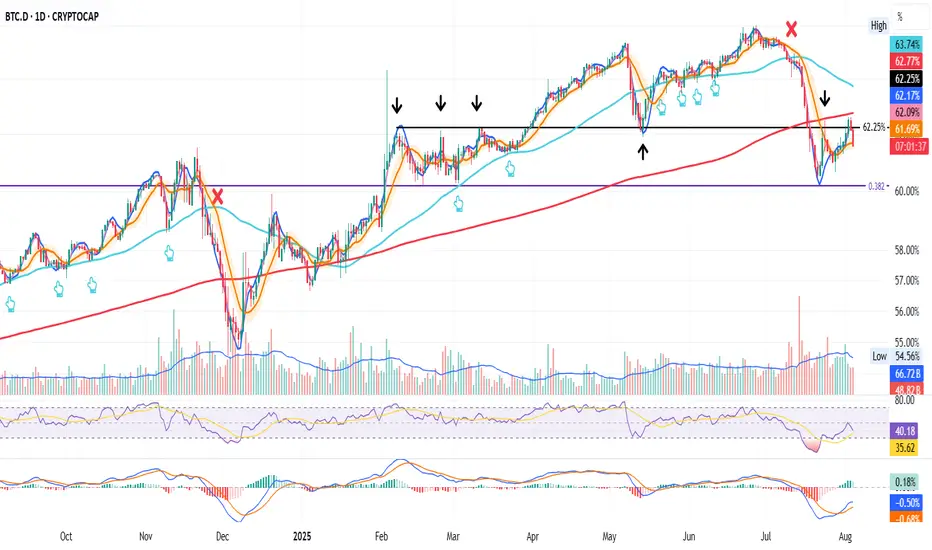
BTC.D on the Daily – Key Rejection in Play
BTC Dominance pushed into the 200MA on August 2nd.
On August 3rd, it got rejected and closed below the 62.25% key resistance.
Today, August 4th, that same level is acting as resistance again.
If today's candle closes below the BB center (orange),
we could see another move back to the bottom of the range
with the 0.382 Fib near 60% as the next key level to watch.
Momentum is fading at resistance.
Structure favors a deeper retest.
We’ll be here to watch it unfold.
Always take profits and manage risk.
Interaction is welcome.
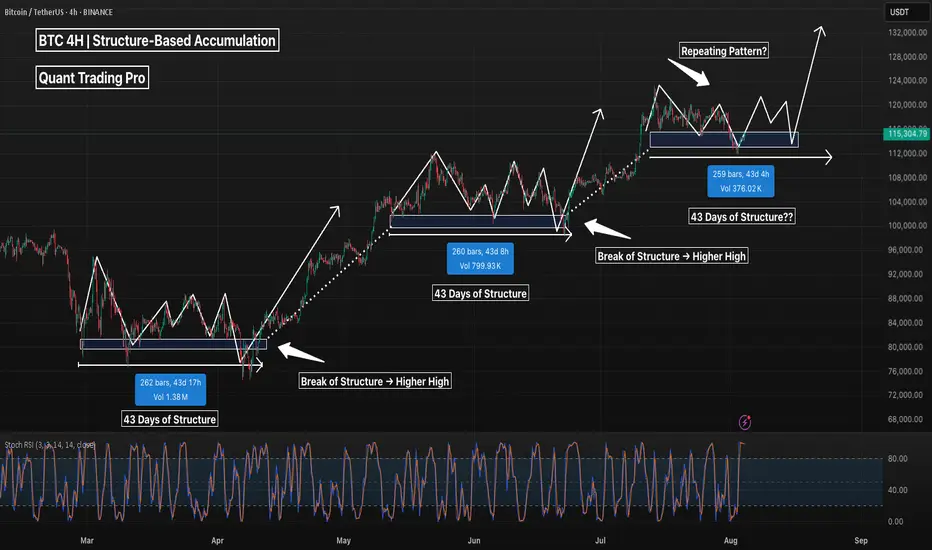
BTC 4H – Repeating Accumulation Pattern, But Will It Hold Again?Bitcoin has shown a clear structural tendency to consolidate for ~43 days at key demand zones before breaking to new highs. This 4H chart highlights three nearly identical accumulation phases, each lasting around 260 bars with a clear base, fakeout, and bullish continuation.
We’re now sitting in the fourth demand zone, with price revisiting the same volume pocket and reclaiming key structure. If history repeats, we may be looking at another breakout leg above $124K+.
Key observations:
– Each consolidation zone lasted ~43 days
– Volume decreases into the base → demand absorption
– Reclaim of structure precedes each leg up
– Current consolidation mirrors previous 3 (in time, shape, and volume)
⚠️ A clean break below ~$112K would invalidate the pattern and suggest deeper retracement.
Are we seeing another accumulation leg… or distribution in disguise?
Drop your thoughts below.
#Bitcoin #BTCUSDT #Crypto #TradingView #PriceAction #MarketStructure #BTC4H #CryptoAnalysis #Accumulation #Wyckoff #SwingTrading #PatternRecognition #TechnicalAnalysis
Bitcoin DumpsBitcoin is putting in a textbook retest here. Price bounced cleanly off support at $112,000 – a key horizontal level that also lines up perfectly with the rising 50-day moving average. That’s classic technical behavior. The bounce looks good on the surface, but it came on low weekend volume, which always warrants a bit of caution. There’s not much conviction behind the move yet.
Looking under the hood, the RSI still hasn’t reached oversold levels, even after a pretty sharp drop from the highs. That’s notable, especially since we saw a clear bearish divergence at the top – price made a higher high, but RSI made a lower high, signaling momentum was already fading. Until we get a stronger reaction and volume pickup, this might just be a pause before another leg down.

Arbitrum Structural Bull Unfolding Amid Ethereum ETF Surge 🚀📊 Arbitrum Structural Bull Unfolding Amid Ethereum ETF Surge 🌐🔥
🏦 Institutional Tidal Wave – Ethereum ETF Inflows Surge
Spot Ethereum ETFs have minted over $7.7 billion in net inflows, with more than $533 million coming in on a single day—a new record level of institutional capital deployment
Analysts estimate $50–100B more capital is set to flow into ETH over the next 12–18 months, fueling long-duration structural demand beyond speculators
ETF inflows are now collectively absorbing more ETH than new issuance, tightening supply dynamics and driving pricing power
🌉 Why ARB Is Positioned to Capitalize
Arbitrum TVL exceeds $2.5B, with network activity up more than 90% since spring. ⚙️ ARB’s price surged ~91% from April lows, though $0.50 remains critical resistance
Stablecoin supply on Arbitrum hit an all-time high in July , highlighting real use-case growth and on-chain USD demand
Robinhood launched tokenized U.S. stock trading on Arbitrum— a major milestone showing enterprise-level trust and integration
📈 Network Fundamentals & Technical Drivers
The In-kind ETF ruling link s real ETH custody to TradFi flows —Arbitrum sits directly in that fast lane as a scaling infrastructure ﹘ this isn’t theory, it's architectural necessity.
Recent academic research shows that optimistic MEV (arbitrage probing) constitutes over 50% of L2 gas consumption on Base/OP, though only ~7% on Arbitrum —suggesting steadier, lower-waste gas dynamics and room for growth in blockspace usage
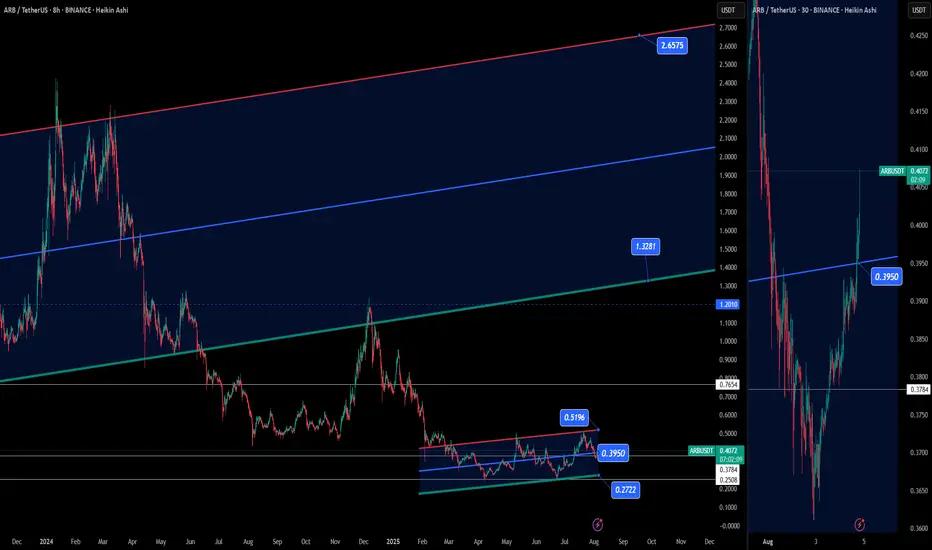
🔧 Chart Structure – ARBUSDT (8H & 30m)
Horizontal support around $0.3950 held, while resistance at $0.5196 defines the upper micro‑range. Holding above support suggests buyers are stepping in.
Macro channel structure points toward $1.33 (mid-channel) and $2.66 (upper channel) as multi-month targets—now in play if resistance breaks
30-minute consolidation turned into a textbook breakout— volume picked up above $0.3950, reinforcing the resumption of bullish momentum.
🧠 Risk & Narrative Considerations
Vote-buying incidents in the Arbitrum DAO raised questions about governance integrity—though these were isolated and transparently addressed
A $140K exploit via signature bypass in March highlights the need for continued security evolution—though the protocol responded promptly
On-chain data shows user churn remains an obstacle—some studies find 80% of users quit blockchains within 90 days. Retention is the next frontier for L2 credibility
✅ Trade Setup Recap
📌 Entry zone: Hold above $0.3950, target initial breakout to $0.5196; next extensions toward $1.33 / $2.66.
📌 Catalysts: ETF capital flow, TradFi infrastructure demand, tokenized stock settlement, stablecoin adoption, and developer activity.
📌 Metrics watching: Futures open interest, DAO participation, new dApp deployment, stablecoin inflows.
🧵 Narrative Summary:
Arbitrum is sitting at the intersection of scaling demand, institutional capital landing in Ethereum, and real-world utility use cases. The current structure—which includes firm technical support, active protocol adoption, and ETF-induced capital flows—sets it apart from altcoin speculation cycles.
If ARB can close convincingly above $0.52, expect the macro expansion phase to begin.
Stay sharp. Structure > Noise.
One 💙 Love,
The FX PROFESSOR
Disclosure: I am happy to be part of the Trade Nation's Influencer program and receive a monthly fee for using their TradingView charts in my analysis. Awesome broker, where the trader really comes first! 🌟🤝📈
$ICNT/USDT 3x BreakoutGETTEX:ICNT just broke out of a falling wedge on the 6H chart, a bullish pattern we’ve been watching closely.
The breakout happened right from a strong support zone, which adds confidence.
If momentum holds, we could be looking at a move toward $1 that’s over 3x from here.
Worth keeping an eye on for sure.
DYOR, NFA

Market - BTC - ETH Analysis
💎 Market - BTC - ETH Analysis💎
🟠 Current Market Status: ⚠️ / Low Risk-Reward ❗️ / Avoid Overtrading 🚫
🔷 BTC/USDT (Multi-Timeframe Analysis)
• Weekly (HWC): Last week’s red candle tapped into a buyer zone. A balance or sideways movement is likely this week.
• Daily (MWC): Minor retracement in a downtrend. No clear bullish reversal yet.
• 4H (LWC): Still in a downtrend. For a bullish reversal, we need a Higher Low (HL) followed by a break of the previous High.
• 1H: Breakout above level 116 would signal a short-term trend reversal. Breaking the upper channel confirms bullish continuation in the lower timeframe.
✅ Strategy Outlook:
• HWC: Bullish
• MWC: Bullish
• LWC: Bearish
→ We're not shorting based on LWC unless it turns bullish or MWC flips bearish.
🕒 Conclusion: Stay on the sidelines until the structure shifts clearly.
🔶 BTC Dominance (BTC.D)
• Currently rejected in the 4H chart, but not yet a confirmed bearish structure.
🧭 Two setups to watch before rotating into altcoins:
1. Clear lower highs and lower lows in 1H and 4H
2. Box formation and breakdown in lower timeframes
🚨 Key Level: A break below 60.40 may trigger sharp altcoin rallies.
🌐 TOTAL / TOTAL2 / TOTAL3
• All three charts share a similar structure.
• 1H TOTAL: Break of 4.72 confirms a V-pattern and may trigger upside momentum.
• TOTAL2: Watch 1.42 as a critical level.
→ Until then: No action – Wait for breakout confirmation.
💵 USDT Dominance (USDT.D)
• Ideally should not retrace beyond 4.64 – if it forms a top here, that’s a bullish sign for the market.
• Level 4.44 is less relevant for now.
• Failure to reclaim 4.53 increases the importance of 4.64.
• If it starts dropping, enter before a breakdown of 4.13 to stay ahead of bearish pressure.
🟠 ETH/BTC
• Consolidating in a 4H box.
• Break of 0.03278 is a trigger for long ETH exposure — ideally hold post-breakout.
• Wait for SMA7 on the Daily to turn upward for stronger confirmation.
• Break of 0.03288 on ETH/BTC likely aligns with $3850–$4000 breakout on ETH/USDT.
→ Position should be taken before this breakout to catch the move early.
📌 Final Note:
We are in a low momentum, low R/R environment.
Only trade confirmed breakouts and structural shifts.
Avoid overtrading, keep risk exposure limited, and rely on higher-timeframe confluences for clearer direction.

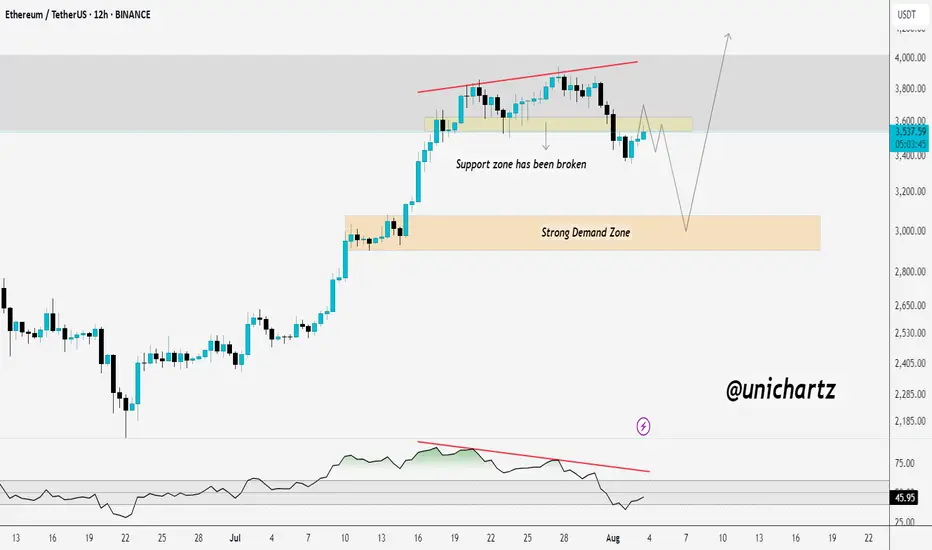
Breakdown Confirmed? ETH Could Drag Alts LowerCRYPTOCAP:ETH support zone around $3,560 has been broken, and current price action appears to be a retest of the breakdown. If ETH fails to reclaim this level, we could see further downside toward the strong demand zone near $3,000.
The RSI bearish divergence also adds to the bearish bias. If this retest fails, altcoins may face deeper corrections, as ETH often leads the market.
DYOR, NFA
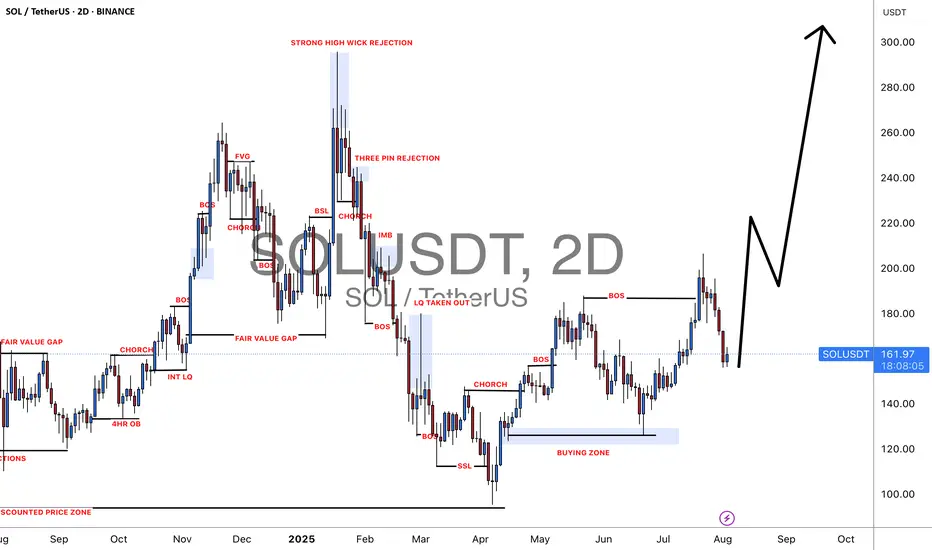
#SOLUSDT: A Big Move In Making Crypto Market Is BullishCrypto market remain bullish and as for the SOLANA we remain quite optimistic; currently price is trading at critical level and waiting for liquidity to emerge. We need strong volume for big price movement. Follow a strict risk management while trading crypto market.
Good luck and trade safe.
Team Setupsfx
TRBUSDT at Major Decision Point: Breakout or Breakdown Ahead?Yello Paradisers! Is TRBUSDT quietly setting up for a bullish breakout, or is it luring in early buyers before a harsh reversal? With price action unfolding near a key support zone, hidden bullish divergence forming, and the structure still technically intact, it’s time we pay close attention before making any decisions.
💎Currently, TRBUSDT remains in a bullish market structure and is trading near an important support area. Price action is also following a well-defined resistance trendline, which continues to limit upside moves. The presence of hidden bullish divergence suggests potential underlying strength, and this area could act as a springboard for the next move up. However, the lack of volume and broader market indecision means this is a zone where both opportunity and risk are high.
💎Given this context, consolidation is very likely here. For more conservative traders, it would be wise to stay patient and let the structure play out before entering. This is not the time to rush into trades without confirmation. For more aggressive traders, there may be intraday opportunities around this support zone, particularly on lower timeframes, but this approach requires strict risk management. Beginners are strongly advised to avoid trading on lower timeframes at this stage, as the price action remains highly reactive and misleading moves can occur easily.
💎If the price builds a fresh bullish structure from this level, it would significantly increase the probability of continued upside. The current zone also offers favorable risk-to-reward potential, with setups delivering more than a 1:3 ratio. That said, if the price breaks down and closes candle below the defined invalidation zone, our bullish outlook becomes invalid. In that case, the best course of action would be to step aside and wait for a new structure to form, rather than trying to force entries in uncertain conditions.
🎖Strive for consistency, not quick profits. Treat the market as a businessman, not as a gambler. Stay focused on high-probability setups, protect your capital, and let the market come to you. That’s the only path to long-term success in this game.
MyCryptoParadise
iFeel the success🌴

SUI 8H – Trendline Bounce Into Layered Supply ZonesSUI just respected a multi-week ascending trendline on the 8H chart — marking its third major touch since June. After a strong bounce from the $3.35 region, price is now moving with momentum, aiming toward two clearly defined supply zones stacked above.
The structure sets up a textbook bullish continuation play, with confluence from Stoch RSI flipping upward and trendline support staying intact.
🔍 Key Zones:
– Trendline Support: Untouched since mid-June
– First supply zone (~$3.95–$4.10): Initial retest target
– Second supply zone (~$4.40–$4.65): Key breakout trigger zone
– Stoch RSI just reset and is now pushing upward = momentum confirmation
A clean rejection at the first box would suggest chop or potential fakeout — but a break and retest could open the door to retesting highs above $4.80+.
This chart tells a simple story: trend is still intact, and bulls are in control — unless proven otherwise.
👇 Bullish? Bearish? Let’s hear your take.

127k after small fall to 112k . buy altcoins in 112k
Hello. Wait for a small correction to the 112k range. There is still wave 5 left to end this bullish move, which I think will make a new record in the 127k range.

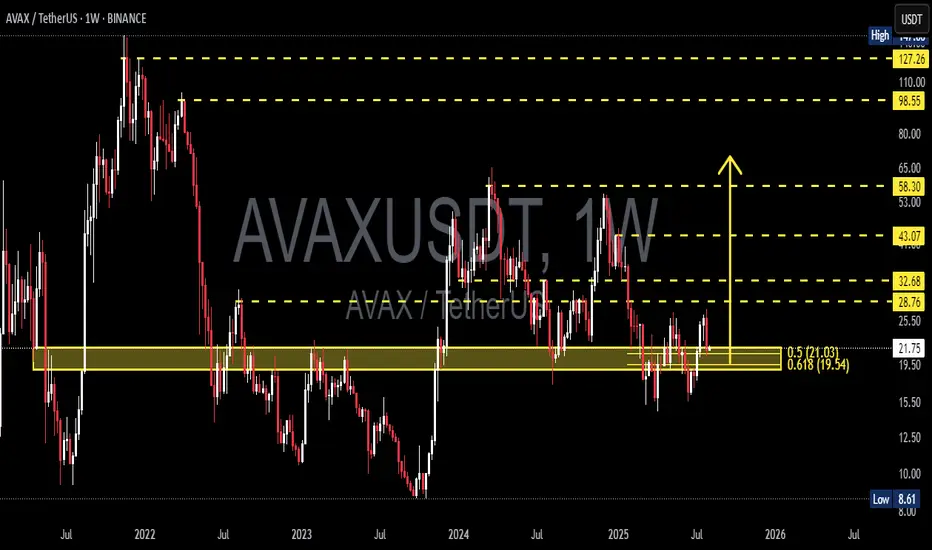
AVAX at the Edge: Golden Pocket Support or Breakdown Incoming?🧠 Overview:
AVAX is currently trading at a decisive support zone, aligned perfectly with the Fibonacci golden pocket (0.5–0.618) at $21.03–$19.54. This level has historically acted as a strong pivot zone, serving both as resistance during bear markets and support in bullish recoveries.
The market has compressed into this key demand zone after a prolonged sideways structure. Now, all eyes are on how price will react — this zone will likely determine AVAX's mid-to-long-term trend.
---
🔍 Key Technical Highlights:
🔸 Fibonacci Confluence Zone (Golden Pocket):
0.5 Fib Level: $21.03
0.618 Fib Level: $19.54
This area coincides with a weekly demand block — a high-probability reversal zone where buyers have historically stepped in.
🔸 Major Resistance Levels to Watch:
$28.76 – First significant supply zone.
$32.68 – Previous lower high, potential breakout confirmation zone.
$43.07 – Weekly structure resistance.
$58.30 – Mid-term bullish target.
🔸 Support Levels Below:
$15.00 – Local base during early 2023.
$8.61 – Multi-year low (critical support if demand collapses).
🔸 Structure Insight:
Price is currently forming a macro higher low, suggesting a potential accumulation phase. However, failure to hold this zone could trigger a bearish continuation.
---
🚀 Bullish Scenario:
If price sustains above $19.54–21.03 and breaks above $25.50, the following upside targets could be reached:
1. $28.76 – Local resistance
2. $32.68 – Break of bearish structure
3. $43.07 – Momentum extension
4. $58.30 – Bullish macro target
Catalyst to watch: Weekly bullish engulfing candle + volume spike + break of structure → these would confirm buyers are in control.
---
🔻 Bearish Scenario:
If the price breaks below $19.54 with strong bearish volume, then:
1. $15.00 – First zone of interest for buyers
2. $8.61 – Critical long-term support zone
This would confirm a distribution pattern and signal that the market may revisit lower accumulation zones before any major uptrend resumes.
---
🧩 Market Psychology Insight:
This current range is where smart money positions themselves — either for continuation or reversal. Retail traders often get shaken out in this kind of compression. Stay patient and wait for confirmation rather than anticipation.
---
🎯 Conclusion:
AVAX is now at a make-or-break point. With the price sitting in a high-confluence demand zone, traders should prepare for volatility and monitor weekly closes. A strong move in either direction will likely determine the next multi-week trend.
> “The bigger the base, the higher in space.” – If this is true accumulation, the upside could surprise many.
#AVAX #AVAXUSDT #CryptoTechnicalAnalysis #AltcoinWatch #FibonacciLevels #SupportResistance #BullishOrBearish #SmartMoneyZone #WeeklyChart #CryptoTrading #BreakoutOrBreakdown