Smart Money Dip Buy Setup🚨 SOLUSDT – Smart Money Dip Buy Setup 🚨
Hey Candle Fam,
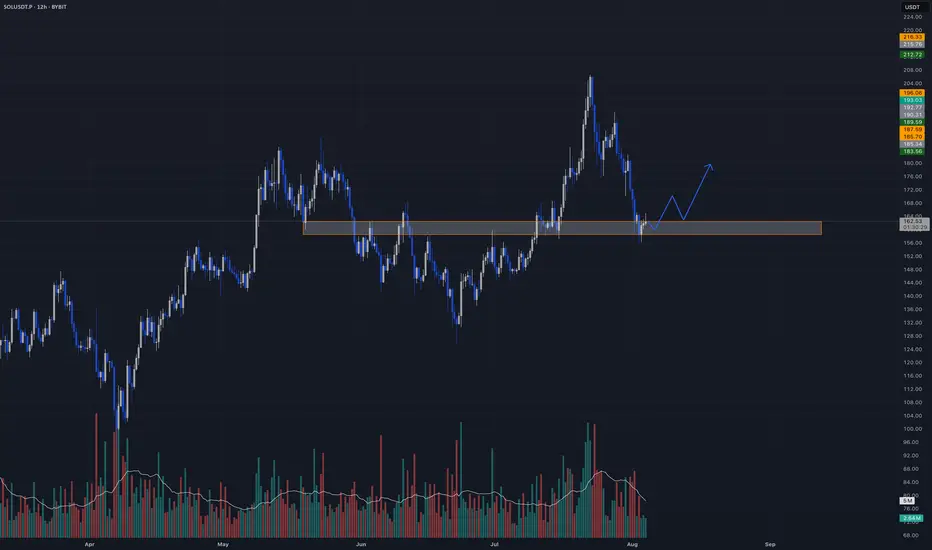
Solana just did what it does best — scared retail out of their positions, grabbed liquidity like it was on sale, and now it’s chilling in the weekly demand zone like nothing happened. Classic.
🎯 LONG Setup
Entry: $162.5–$158.5
Stop Loss: $155.0
Targets: $175 / $190 / $210
📊 Strategy: HTF Demand + Liquidity Grab
– Weekly: Still bullish — engulfing setup into strong OB zone ($160–$180)
– Daily: Healthy correction from $205 top; now testing major support
– 1H: Accumulation signs brewing (equal lows + seller fatigue)
– Footprint: Delta flipping, low-volume cluster forming around $160
⚠️ Below $155 = full structure break. No mercy.
This ain’t hopium — it’s planned structure.
Respect the zone. Let them overleverage.
We execute with patience and calm.
Candle Craft | Signal. Structure. Execution.
Crypto market
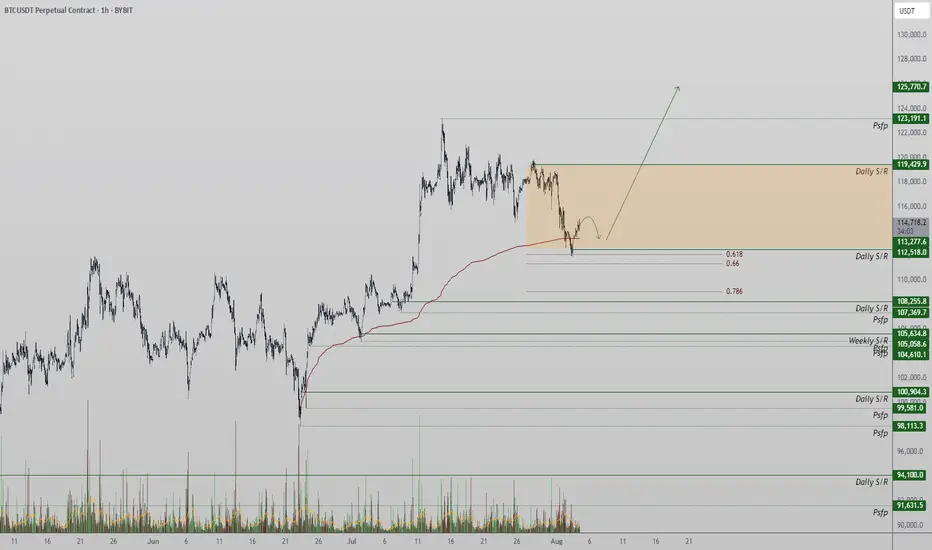
Bitcoin Tests Major Support at $112,500Bitcoin is currently in a local downtrend, with price now testing a major support zone around $112,500. This level, backed by multiple technical confluences, may serve as the base for a potential reversal if defended on lower timeframes.
Price action has been drifting lower over the past sessions, finding its way into a key support zone defined by the 0.618 Fibonacci retracement, the blue upward trendline, and prior structure. The $112,500 region now acts as the immediate level to hold from an intraday perspective. If bulls are able to defend this zone and volume confirms participation, the probability of a rotation higher toward $123,000 increases significantly.
Key Technical Points:
- Support at $112,500: Aligned with 0.618 Fibonacci, trendline support, and structural pivot
- Intraday Confirmation Required: Holding this level on lower timeframes improves the
probability of reversal
= $123,000 Target in Sight: Technical target for rotation if a bottoming structure forms and holds
From a short-term perspective, Bitcoin has clearly shifted into a local downtrend, creating a sequence of lower highs and lower lows. However, the current area around $112,500 presents a strong confluence of support that could interrupt this trend. This zone includes the 0.618 Fibonacci retracement from the most recent swing move, a respected upward trendline (blue), and a previous structural pivot. Together, these elements increase the probability of a bounce—provided price can stabilize.
At this stage, price may still trade sideways and consolidate within this region to form a bottoming structure before any meaningful move higher. For traders, this means confirmation is key. Watching for multiple intraday candle closes above the support zone, paired with an increase in bullish volume, would suggest that demand is building. Only then would the setup favor an entry targeting the local highs.
The upside technical target from this area remains at $123,000, representing the recent swing high and a clear resistance level. A reclaim and rotation to this level would validate the support zone and reintroduce the bullish bias in the short term. Until that occurs, however, price could continue to consolidate, especially if volume remains low or indecisive.
The overall structure still leans constructive, as long as $112,500 holds. A breakdown below this level would weaken the short-term setup and potentially open the door to deeper downside probing. But for now, the region remains a high-probability bounce zone on lower timeframes.
What to Expect in the Coming Price Action
Bitcoin is testing critical intraday support at $112,500. If this level holds with volume confirmation and intraday structure aligns, a rotation toward $123,000 is likely. However, price may continue consolidating at this level before a clear direction forms.
FET/USDT Testing Fibonacci – Bounce Incoming or Breakdown Ahead?📊 Technical Analysis Overview:
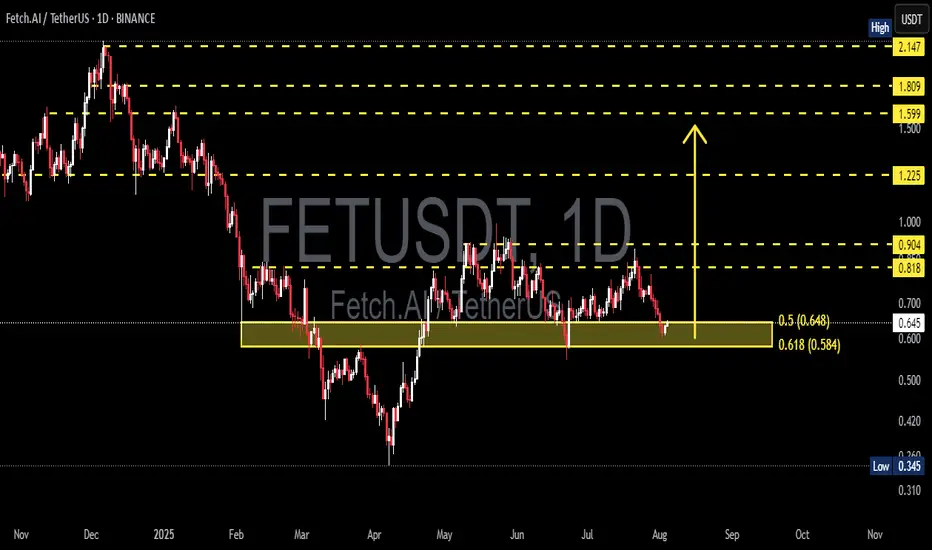
FET/USDT is currently testing a strong demand zone aligned with the Fibonacci Retracement 0.5 – 0.618 levels, specifically between $0.648 and $0.584. This “golden pocket” area is historically significant and often acts as a pivot zone for price reversals.
🔍 Chart Pattern:
The price formed a series of higher highs and higher lows from March to June, indicating a bullish structure.
Since July, momentum has weakened, and the price has corrected back into the key support zone that previously acted as a base for a rally.
---
📈 Bullish Scenario:
If price holds above $0.584 and forms a reversal candlestick (e.g., bullish engulfing or hammer), a strong rebound is likely.
Key upside targets:
$0.818 (minor resistance)
$0.904 (psychological level)
Potential breakout toward $1.225 if bullish volume returns.
📉 Bearish Scenario:
A decisive breakdown below $0.584 with high volume could trigger further downside toward:
$0.42 – $0.345 (next major support zone)
This move could confirm a bearish continuation pattern such as a descending triangle if resistance continues to hold.
---
🎯 Strategic Outlook:
The current zone is a make-or-break level, and the market is at a decision point. Traders should wait for a clear confirmation through price action and volume before committing to directional trades.
#FETUSDT #CryptoAnalysis #FibonacciSupport #AltcoinSetup #FetchAI #TechnicalOutlook #BullishOrBearish #SupportZone #GoldenPocket
BTC PA📊 Price Action Analysis
Rejection at Major Supply Zone ($120K)
Price reached a strong supply/sell zone between $120K and $123K, marked in red.
$120,000: Psychological round number — major supply area.
Price got rejected after multiple days of consolidation under this level.
Support, Resistance Levels and Trendlines
$116,010: Horizontal S/R — acted as temporary support, now resistance.
$111,999.79: Key horizontal support.
Blue PA (D)s trendline has been broken bearishly — indicating a change in short-term market structure.
Momentum is currently in a pullback/retracement phase after strong rally from late June to mid-July.
Volume Analysis
Volume is declining during the pullback — typical of retracements and not full-blown reversals.
No major volume spike indicating panic selling.
Fibonacci Retracement Analysis (Recent Swing High to Swing Low)
Key levels:
0.786: $117,820.25 — Rejected here.
0.618: $113,626.61 — Currently testing this level, price slightly above.
0.5: $110,681.08 — Next support if rejection at 0.618 persists.
0.382: $107,735.54
0.236: $104,091.07
0%: $98,200.00 — Full retracement base.
Price is showing hesitation at the 0.618, which is a crucial level in Fibonacci theory. A break and hold below this could accelerate the drop toward $110.6K and beyond.
RSI Analysis (Daily)
RSI is around 46.46 — moving below midline (50), showing weakening momentum.
Bearish divergence confirmed: price made a higher high while RSI made a lower high → bearish reversal signal.
Bullish if:
BTC reclaims $116K, closes above $120K — invalidates rejection.
RSI bounces from current level with volume support.
Bearish Bias:
Currently, structure broke down.
Testing 0.618 Fib level; failure here likely brings price to: $110,681

BTC ~ will it make new lows!?Ideally its following the pattern i drew, and latter after NY session, it would claim the lows ideally after the buying activity I am antiiipating now!

BITCOIN CRASH PREDICTED! HERE’S WHAT HAPPENS NEXT! (scary)Yello Paradisers, Bitcoin crashed exactly as we predicted in the previous videos that it will happen with the highest probability.
In this video I am explaining to you what's gonna happen next.
Head and shoulders, neckline, is be breaking to the downside, we need a clear confirmation of a reclaim Our channel on high timeframe is getting breakout to the downside and confirmation was that a reclaim was already successful.
In this video I'm sharing with you Elliott Way theory on low timeframe and what needs to be done for confirmation perspective in order for us to continue to go to the downside or have a reversal to the upside.
Don't be a gambler. Don't try to get rich quick. Make sure that your trading is professionally based on proper strategies and trade tactics.

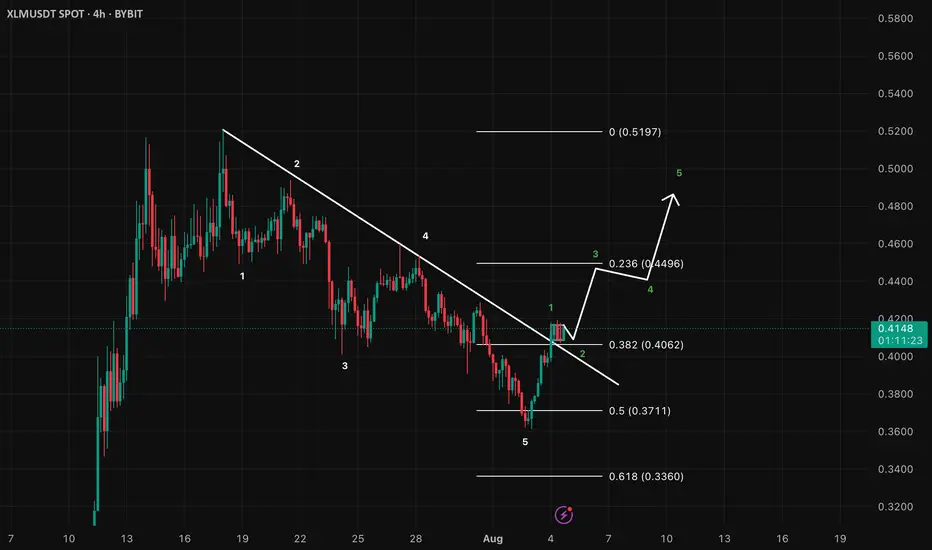
XLMUSD LongWe´ve completed a 5wave corrective structure and just started another bullish 5wave structure.
I expect a correction on lower timeframe to confirm the end of the 1st wave and will enter Long trade at the breakout
Bitcoin Traps Bulls and Bears – Real Move Next?Bitcoin is trading in a descending channel on the 4H chart, with two recent fakeouts — one above resistance and one below support — trapping traders on both sides. After reclaiming support, BTC is pushing toward the upper boundary with rising volume, hinting at strong demand. A breakout above $119K could drive a rally toward $125K–$135K.
Cheers
Hexa
BINANCE:BTCUSDT BITSTAMP:BTCUSD

BTC is just beginning its correction🌐 As always, people like to find meaning in everything to make life seem simpler and more meaningful. So, once again, Trump has been blamed for the market crash.
Probably, if it weren't for geopolitics, Bitcoin would have grown indefinitely, and no one would have taken profits, but simply admired the numbers in their accounts 😁
But this is the real world, and BTC has long been asking for a correction along with the entire market, which I have been talking about for a long time in my ideas.
That is why this is not just a dip, but the likely beginning of a full-scale correction:
➡️ Last week's decline was expected because there is a GAP at $117,000 - $111,245 at these levels. Now that it is almost closed, a new GAP has formed during the decline at $118,403 - $115,245.
➡️ Volume - The volume of purchases at this price is simply negligible; no one wants to buy the dip even at $112,000. In addition, a divergence has been forming since last week in the volume of purchases, which has been declining for a long time.
➡️ Money Flow - very little liquidity entered on the rebound. This signals a lack of interest in buying the dip. The indicator is firmly in negative territory.
➡️ The price has also returned to the boundaries of the descending flag. Technically, this means a probable rebound to $118,000, the upper boundary of the flag, where the GAP is practically ending.
📌 Conclusion:
The main question now is: what next? Either we go higher and close the GAP from above, or we go down to retest the bottom from Sunday and close the GAP.
So far, everything points to the second scenario being more likely.
✍️ What do you think will happen next for BTC?

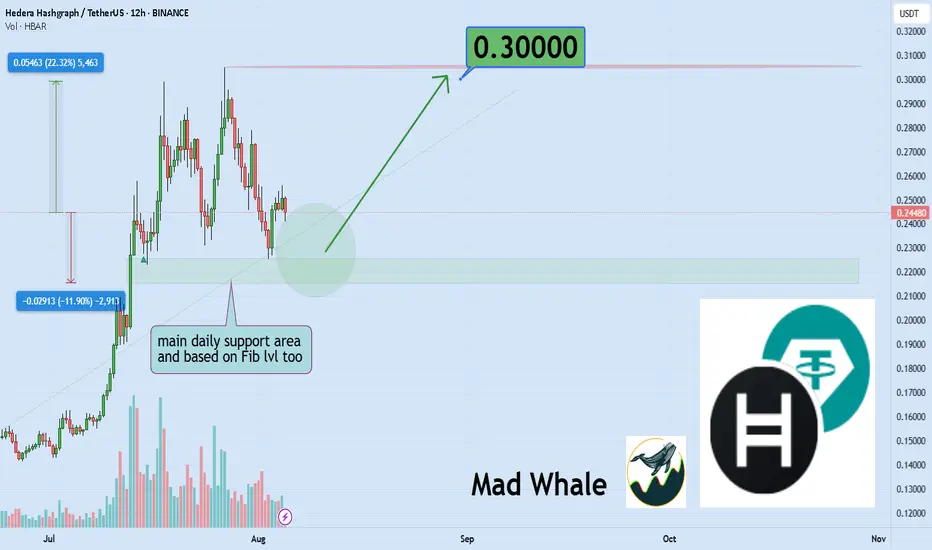
HBAR Set for 22% Rally if Key Support Holds Strong 0.30 targetHello✌
Let’s analyze Hydra Hashgraph’s price action both technically and fundamentally 📈.
🔍Fundamental analysis:
If HBAR’s real use grows, burning fees could rise and boost investor trust. But with 42.4 billion coins out (85% of max), steady demand is needed to handle new unlocks 📊.
📊Technical analysis:
BINANCE:HBARUSDT is currently trading near a confluence of key daily support levels 📉. If this zone holds, the setup suggests a potential upside of around 22 percent toward the 0.30 target 🎯.
✨We put love into every post!
Your support inspires us 💛 Drop a comment we’d love to hear from you! Thanks , Mad Whale
Which altcoin hits the $50 club first? $INJ or $DOT? Which altcoin hits the $50 club first? CRYPTOCAP:INJ or CRYPTOCAP:DOT ? 🚀
3W HTF Technical Breakdown:
1⃣ CRYPTOCAP:INJ (@injective )
✔ Reclaimed structure above $13.31
✔ Targeting $31 → $52.98
✔ Clean 385% R:R setup
⚠ Invalidation below $8.79
2⃣ CRYPTOCAP:DOT (@Polkadot )
✔ Bounced from multi-year TL + demand zone
✔ Hold above $3: Targets $16.67 → $24.37 → $55
✔ Monster 1,660% setup loading
Both charts are screaming high-conviction breakout.
The $50 race is on…
NFA & DYOR

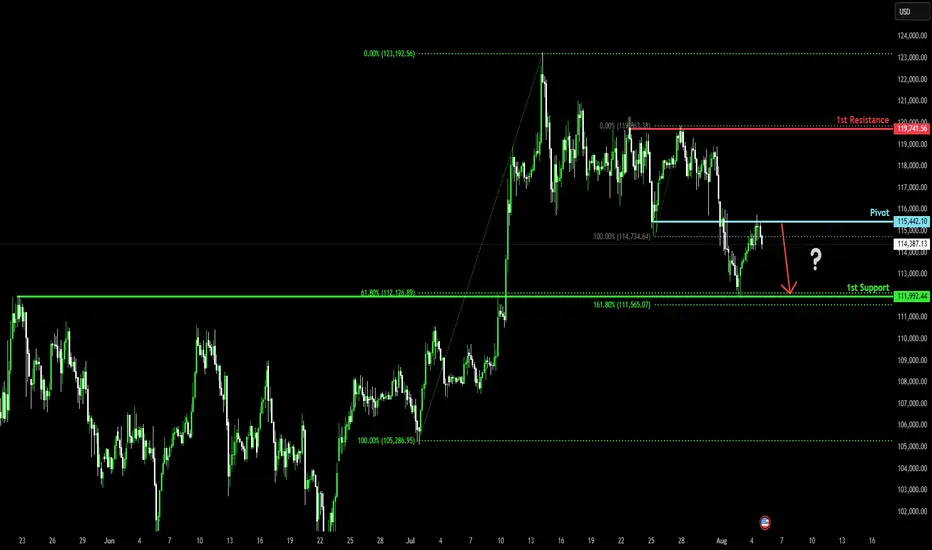
Bearish drop?Bitcoin (BTC/USD) has rejected off the pivot and could drop to the 1st support, which aligns with the 61.8% Fibonacci retracement.
Pivot: 115,442.10
1st Support: 111,992.44
1st Resistance: 119,741.56
Risk Warning:
Trading Forex and CFDs carries a high level of risk to your capital and you should only trade with money you can afford to lose. Trading Forex and CFDs may not be suitable for all investors, so please ensure that you fully understand the risks involved and seek independent advice if necessary.
Disclaimer:
The above opinions given constitute general market commentary, and do not constitute the opinion or advice of IC Markets or any form of personal or investment advice.
Any opinions, news, research, analyses, prices, other information, or links to third-party sites contained on this website are provided on an "as-is" basis, are intended only to be informative, is not an advice nor a recommendation, nor research, or a record of our trading prices, or an offer of, or solicitation for a transaction in any financial instrument and thus should not be treated as such. The information provided does not involve any specific investment objectives, financial situation and needs of any specific person who may receive it. Please be aware, that past performance is not a reliable indicator of future performance and/or results. Past Performance or Forward-looking scenarios based upon the reasonable beliefs of the third-party provider are not a guarantee of future performance. Actual results may differ materially from those anticipated in forward-looking or past performance statements. IC Markets makes no representation or warranty and assumes no liability as to the accuracy or completeness of the information provided, nor any loss arising from any investment based on a recommendation, forecast or any information supplied by any third-party.
BTCUSD NEW OUTLOOK Btcusd buy from 115,000
Target1 116,000
Target2 117,000
Target3 118,000
Stope lose 113,500
TRADE AT YOUR OWN RISK

BTC Retrace RoadMap and 3 nearby supports worth watching NOWThis is a near-term followup to my big picture linked below.
Dip is underway after orbiting our Genesis Fib at 117.9k.
Quickly approaching the next three supports worth watching.
Supports get stronger below but each one needs to slow the dip.
$ 115,140 is a minor fib but possible end of dip wave.
$ 113,9xx is a double fib that should be pretty strong
$ 111,661 is the sister Genesis fib, and a MUST HOLD
.
Big Picture chart and why 117.9k was KEY
=======================================================
.

VINE Long to 200EMA. - 7x7x
Entry $0.06804
SL $0.06363 - Is on trend line near the low from this weeks sell off
Target $0.082 is 200EMA - Sell 50%
2nd target $0.090 - Sell All
Entry is just below 25EMA
Risk 6/10

Bitcoin (BTC): Bullish Start of Week | Eyes on $110KOur attentions are currently at $110K on BTC, where we maintain the bullish plan as long as we are above that zone.
This zone is marked as the BOS area for us, where currently we are seeing the price has retested it and bounced right off again, leading the price back to upper zones here.
So once again, as long as we maintain that area, we are bullish; if we break it, we are going to look for that Bollinger Bands middle line!
Swallow Academy

Ethereum (ETH): Keep Milking The ETH | Bounced From 200EMAEthereum has been one of the easiest coins to predict for upcoming moves, and we did it again. The 200 EMA rejected the price, which led to another smaller buy-side movement on the coin, giving us an opportunity for a long position here.
Well, nothing has changed; the game plan remains the same—we are aiming for $4000 again and then $4800.
Swallow Academy

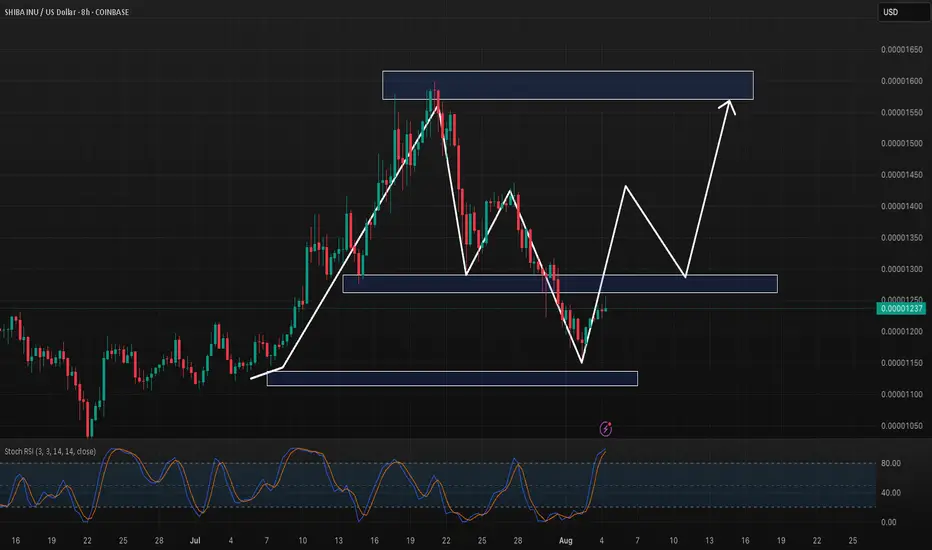
SHIB 8H – Double Bottom at Support, Breakout Structure Loading?HIB has just completed a clean double bottom off a major demand zone on the 8H timeframe, following a textbook impulse → correction → potential reversal sequence. Price structure shows clear symmetry, and the recent bounce aligns with a Stoch RSI reversal from oversold — building a strong case for bullish continuation.
With the key support at ~0.00001200 holding, the white projection shows a potential stair-step return to the upper resistance zone near 0.00001600.
🧠 Key Technicals:
– Major demand zone held strong (previous base of July breakout)
– Double bottom structure forming at support
– Stoch RSI flipped from oversold → confirms short-term momentum
– Clean risk-reward setup toward range high
If SHIB breaks above 0.00001350 with volume, it may trigger the second leg up in this recovery sequence.
Simple structure. Clear reaction. Now price just has to follow the plan.
👇 Comment if you’re in from the bottom, or waiting for confirmation.
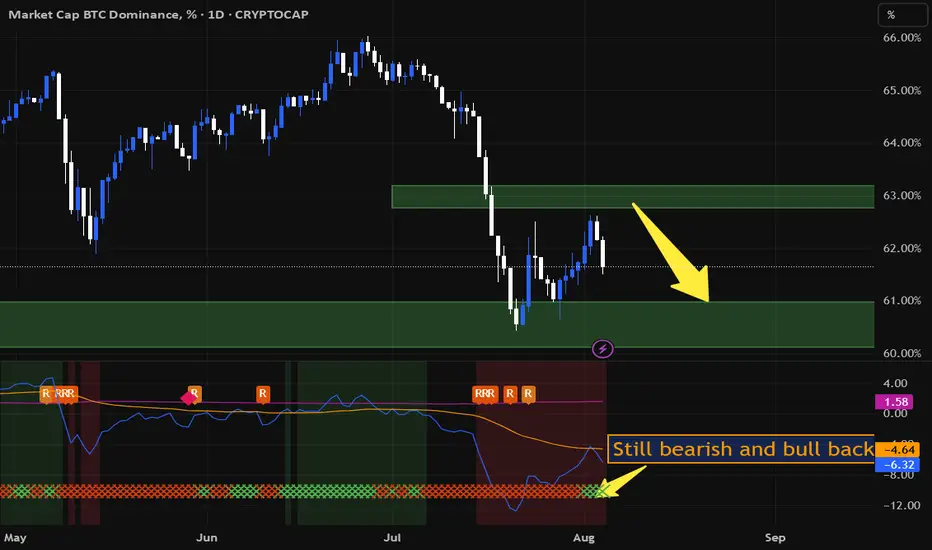
Has the altseason started?Bitcoin dominance is moving towards the 60% support. If this support is broken and dominance declines, we can expect the price of major altcoins such as Ripple and Ethereum to rise. Of course, Bitcoin’s decline should also stop. So the answer of my question is "sill no".
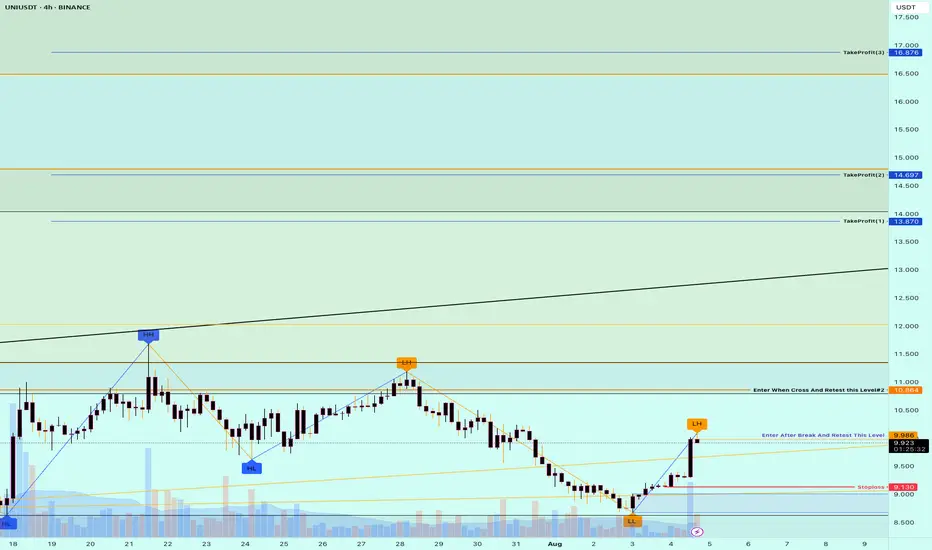
Buy Trade Strategy for UNI: Backing the Leading DeFi DEX UniswapDescription:
This trading idea is centered on UNI, the governance token of Uniswap, the largest decentralized exchange (DEX) on Ethereum. UNI holders play a crucial role in the protocol’s development, and the token benefits directly from Uniswap’s expanding user base, trading volume, and influence in the DeFi space. As decentralized finance continues to evolve, Uniswap remains a foundational pillar for trustless asset swaps, and UNI serves as a strategic asset for exposure to this ecosystem. The platform's commitment to innovation, including cross-chain expansion and layer-2 integrations, further strengthens UNI’s long-term fundamentals.
That said, the crypto market is highly volatile, and **UNI**'s performance is subject to sudden changes due to regulatory shifts, Ethereum network updates, or competitive developments in the DeFi sector. Investors should remain aware of these dynamics and manage their positions responsibly.
Disclaimer:
This trading idea is for educational purposes only and should not be considered financial advice. Cryptocurrencies like UNI carry substantial risk, including the possibility of total capital loss. Always conduct your own research, evaluate your risk tolerance, and consult a qualified financial advisor before making investment decisions. Past performance is not a guarantee of future results.
ETH/BTC Golden Cross Ignites
This is ETH/BTC on the daily chart.
The golden cross is now confirmed: 50MA has officially crossed above the 200MA.
Price reacted immediately, jumping straight to the 0.786 Fib level at 0.0347 a key resistance.
This confirms the bullish structure we’ve been tracking:
– Golden cross ✅
– Breakout above 200MA ✅
– Push into major resistance ✅
Now all eyes are on the 0.0347 zone.
If price can flip it into support, momentum could accelerate quickly.
Always take profits and manage risk.
Interaction is welcome.

Xrp/Btc✨ Ripple vs Bitcoin — awakening from a long slumber?
📍 August 2025, Monthly Chart
A decade of swinging
between historic peaks and the heavy shadow of silence...
Now, XRP rests at 0.000026 BTC,
as if slowly awakening after years of dormancy.
🔸 RSI has moved off historic lows, gaining strength.
🔸 The long-term moving average (red) is drawing closer to price.
🔸 Key resistances ahead:
▫️ 0.000097 → 38.2% Fib
▫️ 0.000125 → 50% Fib
▫️ 0.000153 → golden 0.618 Fib.
🔮 Scenarios:
1️⃣ Break above 0.000097 → a mid-term wave toward 0.000153.
2️⃣ Failure to break → a pullback toward the 0.000062 ~ 0.000058 support zone.
📌 Is Ripple finally awakening?
Or is this just another breath before the next slumber?
Time will tell... ⏳

ENA/USD: BBTrend Suggests Latent Bullish Momentum UnfoldingSince June 29, the BBTrend (Bollinger Band Trend) indicator on ENA’s daily chart has shown a steady series of growing green bars. This expansion signals increasing underlying bullish momentum, even as the token’s price trended mostly downward over the past week.
However, today’s 10% rally marks the strongest upside move in that entire period—potentially signaling the start of a reversal. In technical terms, when BBTrend bars expand during price consolidation, it often precedes a breakout. That appears to be playing out now. If this renewed momentum sustains, ENA could be setting up for further upside in the sessions ahead.
