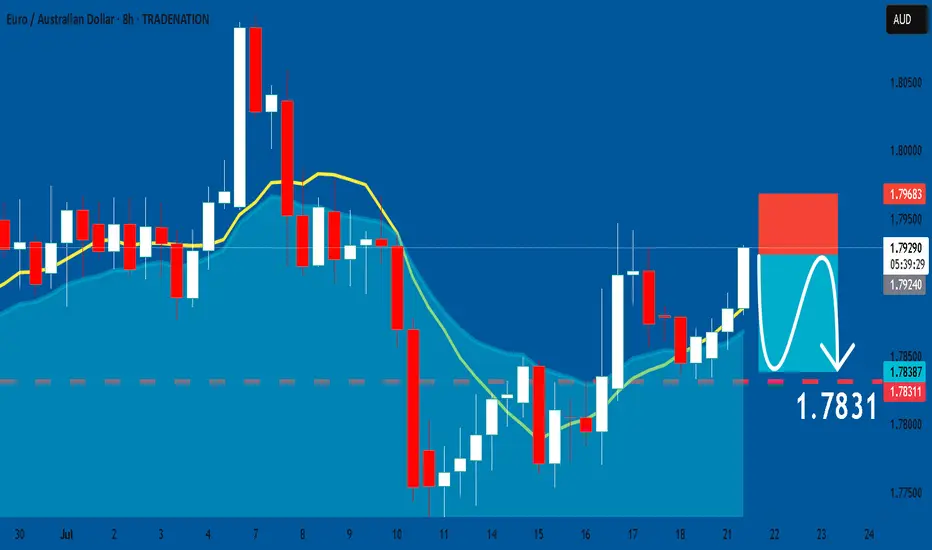
EURAUD: Short Signal Explained
EURAUD
- Classic bearish pattern
- Our team expects retracement
SUGGESTED TRADE:
Swing Trade
Sell EURAUD
Entry - 1.7924
Stop - 1.7968
Take - 1.7831
Our Risk - 1%
Start protection of your profits from lower levels
Disclosure: I am part of Trade Nation's Influencer program and receive a monthly fee for using their TradingView charts in my analysis.
❤️ Please, support our work with like & comment! ❤️
Forex market
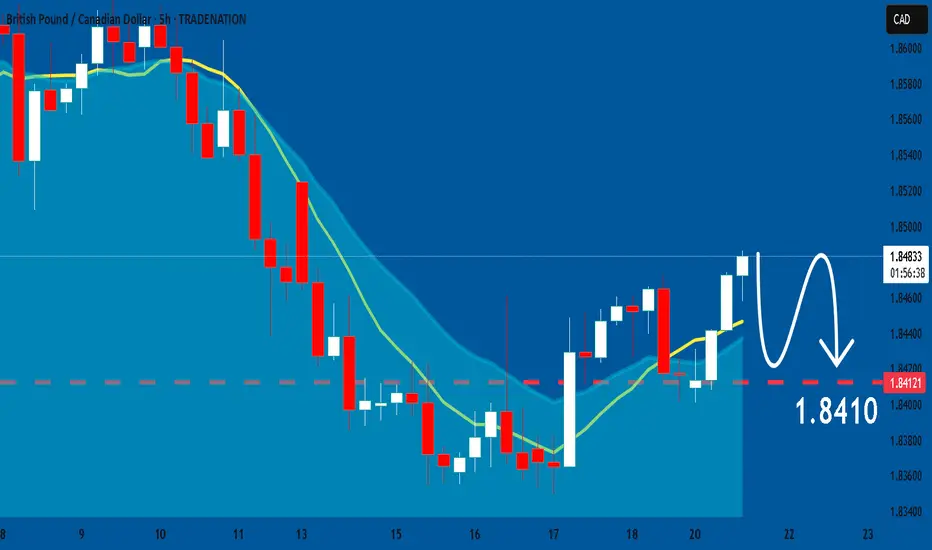
GBPCAD: Will Start Falling! Here is Why:
Remember that we can not, and should not impose our will on the market but rather listen to its whims and make profit by following it. And thus shall be done today on the GBPCAD pair which is likely to be pushed down by the bears so we will sell!
Disclosure: I am part of Trade Nation's Influencer program and receive a monthly fee for using their TradingView charts in my analysis.
❤️ Please, support our work with like & comment! ❤️
The 4 Pillars of PRICE ACTION - Explained!!!!!All the information you need to find a high probability trade are in front of you on the charts so build your trading decisions on 'the facts' of the chart NOT what you think or what you want to happen or even what you heard will happen. If you have enough facts telling you to trade in a certain direction and therefore enough confluence to take a trade, then this is how you will gain consistency in you trading and build confidence. Check out my trade idea!!
www.tradingview.com

EURUSD : Not yetBut I think it will be coming soon.
The battle between buyer and seller has been ongoing for more than 30 hours now.
If I SELL too soon (without confirmation), then it is risky, as we have seen that the price still creeps upwards. Wait for Buyer exhaustion.
We will know the winner soon. I will definitely let you know when it happens. Let's make $$$$$
Good luck.

AUD/USD Channel Breakdown Could Threaten Bullish StructureAUD/USD is currently holding just above the 0.6500 psychological level after retreating from the 0.6558 Fibonacci resistance (61.8% retracement of the October–April decline). Price action has recently broken beneath the lower boundary of a rising wedge pattern—a traditionally bearish signal—raising the risk of deeper downside ahead.
The 50-day SMA (0.6498) and 200-day SMA (0.6399) are converging, with the former now acting as dynamic support following today’s bounce. However, momentum indicators offer limited bullish conviction: the RSI hovers near neutral at 51.5, and the MACD is flatlining just above zero, suggesting a pause in directional bias.
If bears push price back under 0.6500, the rising wedge breakdown could accelerate toward the 200-day SMA and potentially the horizontal support zone at 0.6178. On the flip side, a recovery above 0.6558 would invalidate the wedge and open the door for a run toward the 78.6% retracement near 0.6730.
Bias: Cautiously bearish while below 0.6558, especially if daily closes begin to settle under 0.6500. A loss of the 200-day SMA would confirm a trend reversal.
Time frame: Short- to medium-term (days to weeks)
-MW

EURJPY BUYSI'm still strongly bullish on the Euro, and this current pullback on EURJPY appears to be a healthy retracement within the larger uptrend. It offers a good opportunity to enter long positions with the expectation of a move back to retest the highs reached in July 2024.

GBPCAD new bearish expecting
OANDA:GBPCAD last analysis we are be accurate (attached), currently continuation type, RAISING WEDGE pattern visible, we are have strong bearish push, and still expectations are bearish.
SUP zone: 1.85000
RES zone: 1.83000, 1.82200


GBPUSD - Looking To Sell Pullbacks In The Short TermH4 - Strong bearish move.
No opposite signs.
Currently it looks like a pullback is happening.
Expecting bearish continuation until the two Fibonacci resistance zones hold.
If you enjoy this idea, don’t forget to LIKE 👍, FOLLOW ✅, SHARE 🙌, and COMMENT ✍! Drop your thoughts and charts below to keep the discussion going. Your support helps keep this content free and reach more people! 🚀
--------------------------------------------------------------------------------------------------------------------

CHFJPY Alert!
🚨 CHFJPY Alert 🚨
Don't catch a falling knife... 🔪 However, price always returns to moving averages, and CHFJPY could be starting its descent.
Personally, I think price may form one last bullish move up and then come crashing down. However, the 1-hour is forming a descending triangle. A break below the triangle could be the start of the daily retracement.
Thoughts?
CMCMARKETS:CHFJPY

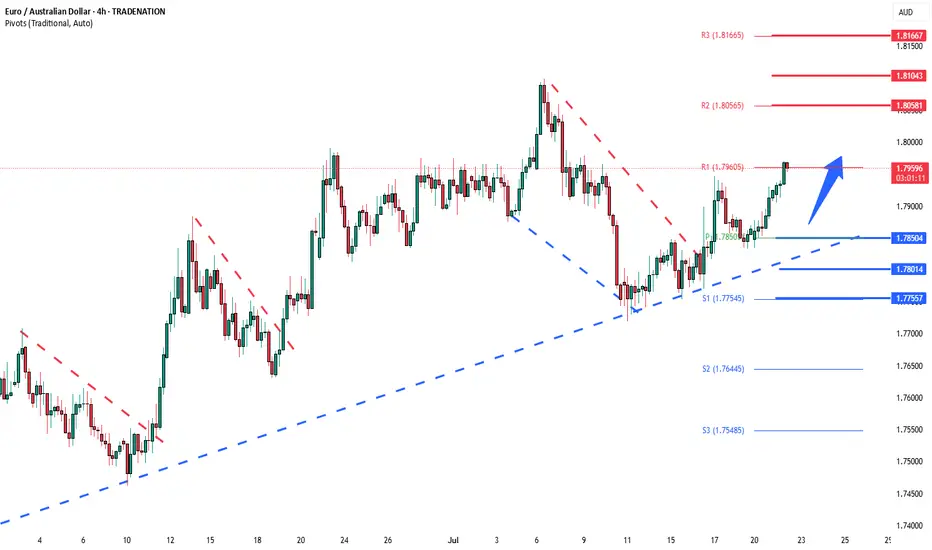
EURAUD Bullish breakout supported at 1.7650The EURAUD remains in a bullish trend, with recent price action indicating a continuation breakout within the broader uptrend.
Support Zone: 1.7850 – a key level from previous consolidation. Price is currently testing or approaching this level.
A bullish rebound from 1.7850 would confirm ongoing upside momentum, with potential targets at:
1.8060 – initial resistance
1.8100 – psychological and structural level
1.8165 – extended resistance on the longer-term chart
Bearish Scenario:
A confirmed break and daily close below 1.7850 would weaken the bullish outlook and suggest deeper downside risk toward:
1.7800 – minor support
1.7755 – stronger support and potential demand zone
Outlook:
Bullish bias remains intact while the EURAUD holds above 1.7850. A sustained break below this level could shift momentum to the downside in the short term.
This communication is for informational purposes only and should not be viewed as any form of recommendation as to a particular course of action or as investment advice. It is not intended as an offer or solicitation for the purchase or sale of any financial instrument or as an official confirmation of any transaction. Opinions, estimates and assumptions expressed herein are made as of the date of this communication and are subject to change without notice. This communication has been prepared based upon information, including market prices, data and other information, believed to be reliable; however, Trade Nation does not warrant its completeness or accuracy. All market prices and market data contained in or attached to this communication are indicative and subject to change without notice.
EURUSD BuyIntraday structure is bullish. Also Daily cycle is in play. Price did a ‘liquidity grab’ on asia low and broke scalping structure to the upside. If price is to continue higher it will mitigate the ‘order block’ and continue pushing higher.

sell eurusd long term1.1450 target suport line fibo, this is my ideea
In my opinion, EUR/USD will go down to a resistance level ....., considering that the 200 EMA has crossed the trend line and the Fibo is doing its job.

bullish reveralThe low has been taken out, and price changed character and broke structure to the upside, we anticipate price to fill the imbalance and test the discount price range before taking off

Bearish reversal off 61.8% Fibonacci resistance?AUD/USD is rising towards the pivot and could reverse to the 1st support, which acts as a pullback support.
Pivot: 0.6543
1st Support: 0.6469
1st Resistance: 0.6590
Risk Warning:
Trading Forex and CFDs carries a high level of risk to your capital and you should only trade with money you can afford to lose. Trading Forex and CFDs may not be suitable for all investors, so please ensure that you fully understand the risks involved and seek independent advice if necessary.
Disclaimer:
The above opinions given constitute general market commentary, and do not constitute the opinion or advice of IC Markets or any form of personal or investment advice.
Any opinions, news, research, analyses, prices, other information, or links to third-party sites contained on this website are provided on an "as-is" basis, are intended only to be informative, is not an advice nor a recommendation, nor research, or a record of our trading prices, or an offer of, or solicitation for a transaction in any financial instrument and thus should not be treated as such. The information provided does not involve any specific investment objectives, financial situation and needs of any specific person who may receive it. Please be aware, that past performance is not a reliable indicator of future performance and/or results. Past Performance or Forward-looking scenarios based upon the reasonable beliefs of the third-party provider are not a guarantee of future performance. Actual results may differ materially from those anticipated in forward-looking or past performance statements. IC Markets makes no representation or warranty and assumes no liability as to the accuracy or completeness of the information provided, nor any loss arising from any investment based on a recommendation, forecast or any information supplied by any third-party.

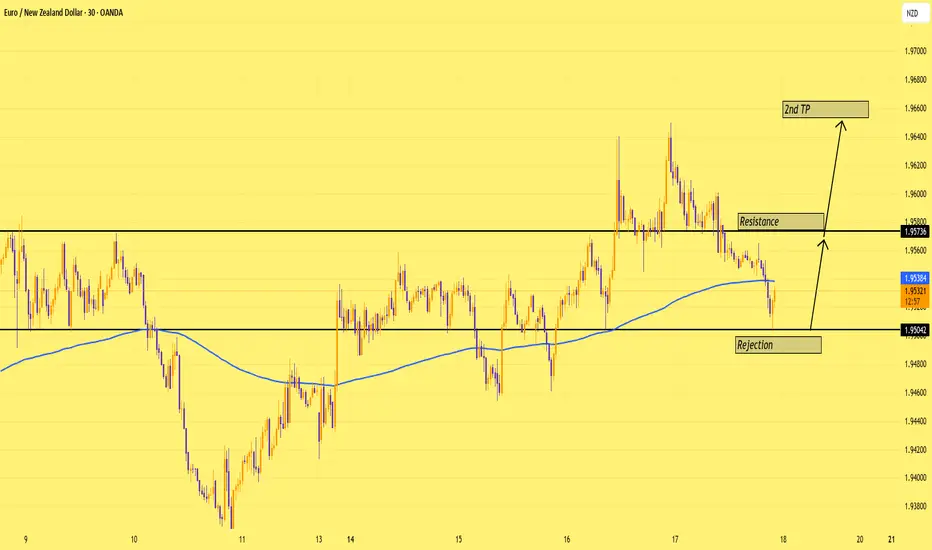
EURNZD: The Bounce Play Nobody’s WatchingWe just got a clean rejection at 1.9504—same zone price respected 3x before. If bulls step in here, next stop might be resistance at 1.9573. 1.9650 is the 2nd TP
Simple range, clean bounce setup. Let’s see if it delivers.
USDJPY - Bullish Bias, In OB ZonePair: USDJPY (UJ)
Bias: Bullish
HTF Overview: Bullish structure remains intact — price currently pushing upward, respecting higher timeframe flow.
Current Zone: Price is now sitting within the 30M OB, showing potential strength but no LTF confirmation yet.
LTF Confirmation: Still in analysis mode — sitting on hands, waiting for clean reaction on 5M or 1M before considering entries.
Entry Zone: 30M OB being monitored closely — ideal setup would include inducement and clear shift before entry.
Targets: Next 1H high remains the first target — extended targets to be trailed if momentum builds.
Mindset Note: Analysis first, execution second. Discipline is the edge — no rush until LTF gives the green light.
Bless Trading!

USD CAD longpossible scenario for usdcad lets see
when risk to reward ratio is good you dont have to worry just let the gut feeling flow
Please note: This is for educational purposes only and not a trading signal. These ideas are shared purely for back testing and to exchange views. The goal is to inspire ideas and encourage discussion. If you notice anything wrong, feel free to share your thoughts. In the end, to learn is to share !

USDJPY - M15 Downtrend with Supply Zone RetestThe USD/JPY market currently exhibits a downtrend with price rebounding slightly from recent lows. The key focus is the Lower Time Frame (LTF) Supply Zone around 148.2, which acts as a strong resistance level.
The trading plan anticipates the price to rise into this LTF Supply Zone, where selling pressure is expected to resume, leading to a continuation of the downward trend. The ultimate target is near the previous strong low around 146.8, representing a potential demand zone and support level.
This plan suggests watching for price action signals such as rejection wicks or bearish candlestick patterns within the supply zone to confirm entries for short positions. Managing risk involves placing stop losses just above the supply zone to protect against unexpected breakouts.

NZDUSD Will Go Higher From Support! Long!
Please, check our technical outlook for NZDUSD.
Time Frame: 12h
Current Trend: Bullish
Sentiment: Oversold (based on 7-period RSI)
Forecast: Bullish
The market is trading around a solid horizontal structure 0.596.
The above observations make me that the market will inevitably achieve 0.602 level.
P.S
Please, note that an oversold/overbought condition can last for a long time, and therefore being oversold/overbought doesn't mean a price rally will come soon, or at all.
Disclosure: I am part of Trade Nation's Influencer program and receive a monthly fee for using their TradingView charts in my analysis.
Like and subscribe and comment my ideas if you enjoy them!

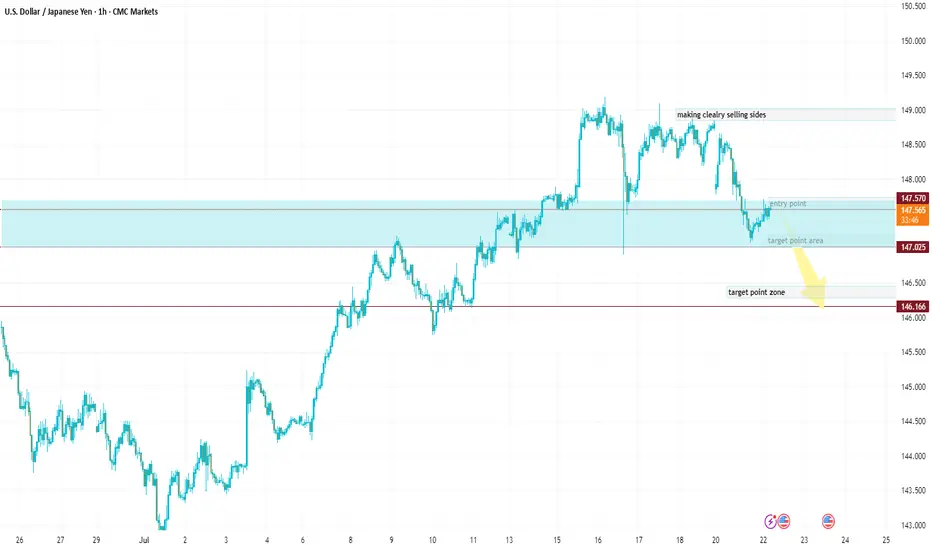
USDJPY Entry Zone: Current market is near your ideal entry zoneEntry Point (for Sell): Around 147.800 – 147.600
🔻 First Target (TP1): 147.050 – Labeled as "target point area"
🔻 Second Target (TP2): 146.300 – Labeled as "target point zone"
🛑 Invalid Zone (Sell Weakens): Above 148.600 – 149.000 (marked as “making clearly selling sides”)
Entry Zone:
Current market is near your ideal entry zone.
A pullback or rejection around 147.800 provides a good short opportunity.
🎯 Take-Profit Zones:
TP1: 147.050 (first support level / structure base)
TP2: 146.300 (major demand zone)
📉 Stop-Loss (SL):
Above 148.600
GBPUSD H1 I Bullish Reversal Based on the H1 chart analysis, the price is approaching our buy entry level at 1.3438, a pullback support that aligns with the 61.8% Fib retracement.
Our take profit is set at 1.3489, a pullback resistance.
The stop loss is placed at 1.3397, below the swing low support.
High Risk Investment Warning
Trading Forex/CFDs on margin carries a high level of risk and may not be suitable for all investors. Leverage can work against you.
Stratos Markets Limited (tradu.com ):
CFDs are complex instruments and come with a high risk of losing money rapidly due to leverage. 66% of retail investor accounts lose money when trading CFDs with this provider. You should consider whether you understand how CFDs work and whether you can afford to take the high risk of losing your money.
Stratos Europe Ltd (tradu.com ):
CFDs are complex instruments and come with a high risk of losing money rapidly due to leverage. 66% of retail investor accounts lose money when trading CFDs with this provider. You should consider whether you understand how CFDs work and whether you can afford to take the high risk of losing your money.
Stratos Global LLC (tradu.com ):
Losses can exceed deposits.
Please be advised that the information presented on TradingView is provided to Tradu (‘Company’, ‘we’) by a third-party provider (‘TFA Global Pte Ltd’). Please be reminded that you are solely responsible for the trading decisions on your account. There is a very high degree of risk involved in trading. Any information and/or content is intended entirely for research, educational and informational purposes only and does not constitute investment or consultation advice or investment strategy. The information is not tailored to the investment needs of any specific person and therefore does not involve a consideration of any of the investment objectives, financial situation or needs of any viewer that may receive it. Kindly also note that past performance is not a reliable indicator of future results. Actual results may differ materially from those anticipated in forward-looking or past performance statements. We assume no liability as to the accuracy or completeness of any of the information and/or content provided herein and the Company cannot be held responsible for any omission, mistake nor for any loss or damage including without limitation to any loss of profit which may arise from reliance on any information supplied by TFA Global Pte Ltd.
The speaker(s) is neither an employee, agent nor representative of Tradu and is therefore acting independently. The opinions given are their own, constitute general market commentary, and do not constitute the opinion or advice of Tradu or any form of personal or investment advice. Tradu neither endorses nor guarantees offerings of third-party speakers, nor is Tradu responsible for the content, veracity or opinions of third-party speakers, presenters or participants.

USDJPY TREND REVERSAL TRADELooking at 4h chart, our short term bearish channel has been broken indicating a possible reversal. Waiting for this sell setup to trigger. Let me know your thoughts.
