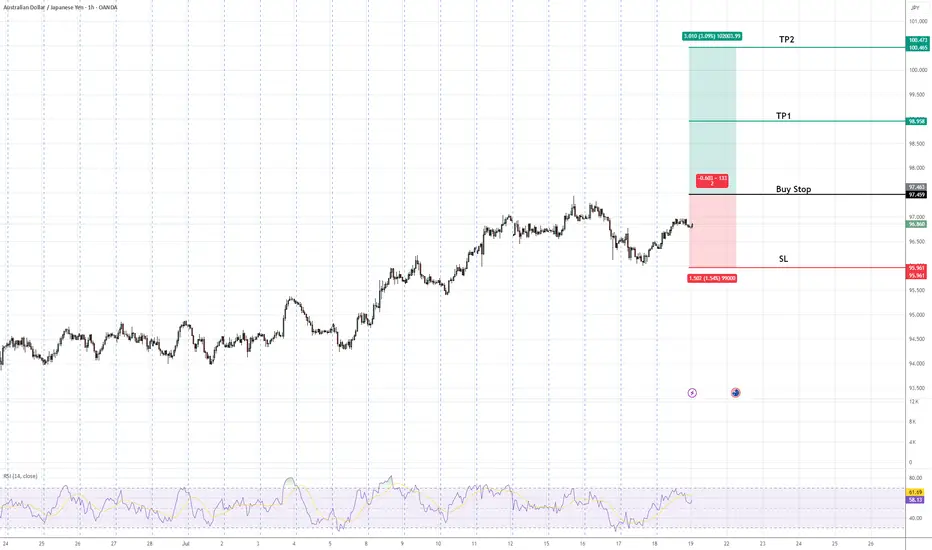
AUDJPY Buy Stop Setup | Trend Continuation in FocusAUDJPY is in an established uptrend, forming higher highs and higher lows. A buy stop is positioned above the recent swing high to confirm bullish continuation. The setup includes a defined stop-loss below the previous higher low to manage risk and two target profit levels (TP1 & TP2) aligned with key resistance zones. This approach favors trend-following traders seeking confirmation of upward momentum before entry.
Forex market
NZDUSD Potential LongsThis is how I'd be looking at NZDUSD for longs, not a high probability setup, considering current bearish structure but good RR makes it worth the risk


+AUDCAD (0,89100 to 0,89800) All eyes on AUDCAD. Price is testing the resistance trend line and will soon break above it. A bullish flag pattern can be spotted on the 4 hour chart.

GBPAUD: Bullish Movement Continues 🇬🇧🇦🇺
GBPAUD is going to rise more, following a confirmed intraday bullish reversal:
first, the price violated a resistance line of a falling channel.
It started to consolidate within an inverted head & shoulders pattern then.
Its neckline violation is another strong bullish signal.
Next resistance - 2.0685
❤️Please, support my work with like, thank you!❤️
I am part of Trade Nation's Influencer program and receive a monthly fee for using their TradingView charts in my analysis.

EURUSD LongEURUSD 15-Minute Technical Analysis
EURUSD has broken through a key intraday structure level with strong bullish momentum, indicating continued institutional interest on the buy side. The market is now approaching a higher-timeframe supply region while leaving behind a well-defined demand zone that could serve as a launchpad for further upside.
🔍 Market Structure & Momentum:
Break of Structure (BOS) was confirmed after the recent surge above the previous high, validating the current bullish trend.
Price has rallied aggressively from the IDM low at 1.16908, sweeping short-term liquidity and suggesting smart money involvement.
We are now trading inside a minor supply zone and approaching a broader liquidity cluster between 1.17550 – 1.17800.
🟩 Key Demand Zone
Level: 1.16980 – 1.17100
This zone marks a significant accumulation area where the market built up momentum before the breakout. It's also in line with the IDM (Internal Drawdown Marker), serving as a technical retracement level.
A retracement into this demand zone would align with a classic bullish continuation pattern, offering a potential re-entry area for long positions.
The imbalance left behind further supports this zone’s potential to hold.
🟥 Overhead Supply Zones (Resistance Clusters):
First Zone: 1.17550 – 1.17700
Second Zone (Stronger): 1.17750 – 1.17900
These zones represent unmitigated supply levels from previous sell-offs and may act as profit-taking or short-term reversal points for intraday traders. These areas are where we expect higher levels of volatility and potential bearish reaction before continuation or reversal.
📈 Expectations & Trade Setup:
Anticipation of a retracement into the 1.16980–1.17100 demand zone for price to establish a higher low before pushing toward unfilled liquidity above 1.17550.
If demand holds, a bullish continuation could aim for 1.17750–1.17900, where confluence with past supply suggests caution.
Should price fail to hold the demand, bearish momentum could pull price back toward the lower demand block at 1.16500 (aligned with the 0.5 fib level of the prior impulse).

GBPUSD BUYS GU broke the previous LH and formed support. I’m waiting for price to break out of consolidation on the M15 and form more bullish pressure before entering longs towards 1.36200 area.

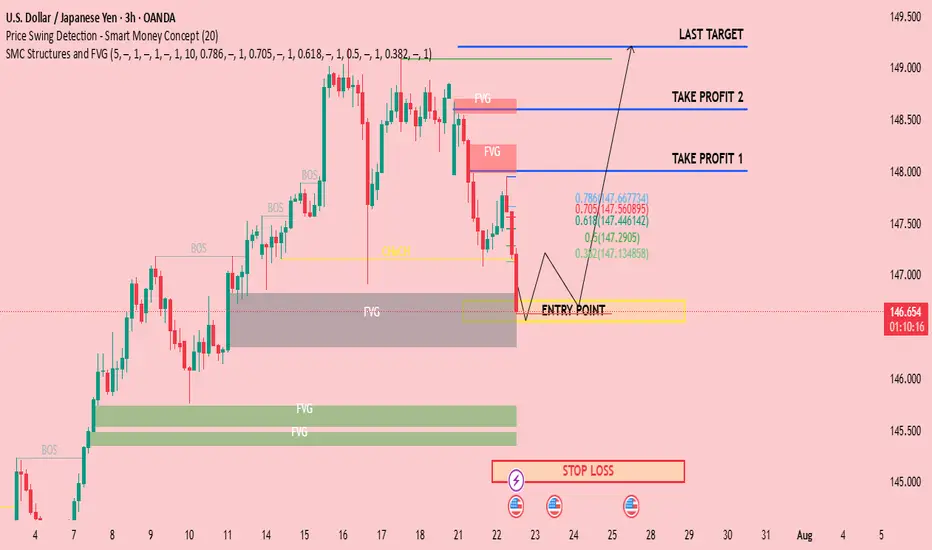
CHECK USDJPY SIGNAL READ THE CAPTAINEntry Point: Around 146.750 146.550
Stop Loss: Around 145.000
🎯 Target Levels
Take Profit 1:
148.000
Take Profit 2:
148.600
last target
149.200
audnzd long trade in my opinion this is a good trade with a good r/r hope hit the tp consider this is my trade not your trade and i just like to share my trades with world

GBPUSD Long Trade Alert – Inverted Head & Shoulders BreakoutGBPUSD has confirmed a classic Inverted Head & Shoulders pattern, signaling a strong bullish reversal opportunity on the 2-hour chart. Price has successfully broken above the neckline resistance zone (~1.3490) and has now retested that zone, forming a bullish engulfing candle — an ideal confirmation for long entries.
🟢 Trade Plan:
Entry: After bullish engulfing candle formed on neckline retest (~1.3490–1.3500)
Stop Loss: Just below the right shoulder low / retest swing low (~1.3455)
Risk/Reward Ratio: ~4:1 (High reward with tightly controlled risk)
🎯 Target Levels:
Target 1: 1.3555
Final Target (Projected): 1.3620
These levels align with structure resistance and measured move of the pattern
📌 Why This Trade Matters:
Pattern confirmed ✅
Retest successful ✅
Bullish confirmation candle ✅
Clean invalidation and upside potential ✅
This is a textbook reversal play, offering solid structure, clear stop placement, and attractive upside. Perfect for swing traders or short-term position setups.
📉 Trade what you see, not what you think. Let price action lead your execution.
=================================================================
Disclosure: I am part of Trade Nation's Influencer program and receive a monthly fee for using their TradingView charts in my analysis.
=================================================================

EURUSD and GBPUSD Analysis todayHello traders, this is a complete multiple timeframe analysis of this pair. We see could find significant trading opportunities as per analysis upon price action confirmation we may take this trade. Smash the like button if you find value in this analysis and drop a comment if you have any questions or let me know which pair to cover in my next analysis.

EURCHF oversold bounce backs capped at 0.9340The EURCHF pair is currently trading with a bearish bias, aligned with the broader downward trend. Recent price action shows a retest of the falling resistance, suggesting a temporary relief rally within the downtrend.
Key resistance is located at 0.9340, a prior consolidation zone. This level will be critical in determining the next directional move.
A bearish rejection from 0.9340 could confirm the resumption of the downtrend, targeting the next support levels at 0.9300, followed by 0.9290 and 0.9270 over a longer timeframe.
Conversely, a decisive breakout and daily close above 0.9340 would invalidate the current bearish setup, shifting sentiment to bullish and potentially triggering a move towards 0.9355, then 0.9365.
Conclusion:
The short-term outlook remains bearish unless the pair breaks and holds above 0.9340. Traders should watch for price action signals around this key level to confirm direction. A rejection favours fresh downside continuation, while a breakout signals a potential trend reversal or deeper correction.
This communication is for informational purposes only and should not be viewed as any form of recommendation as to a particular course of action or as investment advice. It is not intended as an offer or solicitation for the purchase or sale of any financial instrument or as an official confirmation of any transaction. Opinions, estimates and assumptions expressed herein are made as of the date of this communication and are subject to change without notice. This communication has been prepared based upon information, including market prices, data and other information, believed to be reliable; however, Trade Nation does not warrant its completeness or accuracy. All market prices and market data contained in or attached to this communication are indicative and subject to change without notice.


EURUSD bullish breakout supported at 1.1640The EURUSD currency pair continues to exhibit a bullish price action bias, supported by a sustained rising trend. Recent intraday movement reflects a sideways consolidation breakout, suggesting potential continuation of the broader uptrend.
Key Technical Level: 1.1640
This level marks the prior consolidation range and now acts as pivotal support. A corrective pullback toward 1.1640 followed by a bullish rejection would reinforce the bullish trend, targeting the next resistance levels at:
1.1830 – Near-term resistance
1.1900 – Minor swing high
1.1940 – Longer-term bullish objective
On the other hand, a decisive daily close below 1.1640 would invalidate the bullish setup, shifting the outlook to bearish in the short term. This could trigger a deeper retracement toward:
1.1590 – Initial support
1.1530 – Key downside target
Conclusion:
As long as 1.1640 holds as support, the technical outlook remains bullish, favoring long positions on dips. A confirmed break below this level would signal a shift in sentiment and open the door to a corrective pullback phase.
This communication is for informational purposes only and should not be viewed as any form of recommendation as to a particular course of action or as investment advice. It is not intended as an offer or solicitation for the purchase or sale of any financial instrument or as an official confirmation of any transaction. Opinions, estimates and assumptions expressed herein are made as of the date of this communication and are subject to change without notice. This communication has been prepared based upon information, including market prices, data and other information, believed to be reliable; however, Trade Nation does not warrant its completeness or accuracy. All market prices and market data contained in or attached to this communication are indicative and subject to change without notice.

USDJPY sell updatethis is an update to yesterdays analysis.
since there was an OB cross on the stochastics indicator and a rejection of the 50% (equilibrium) zone the I hopped onto the trade at market order hoping to ride the wave down

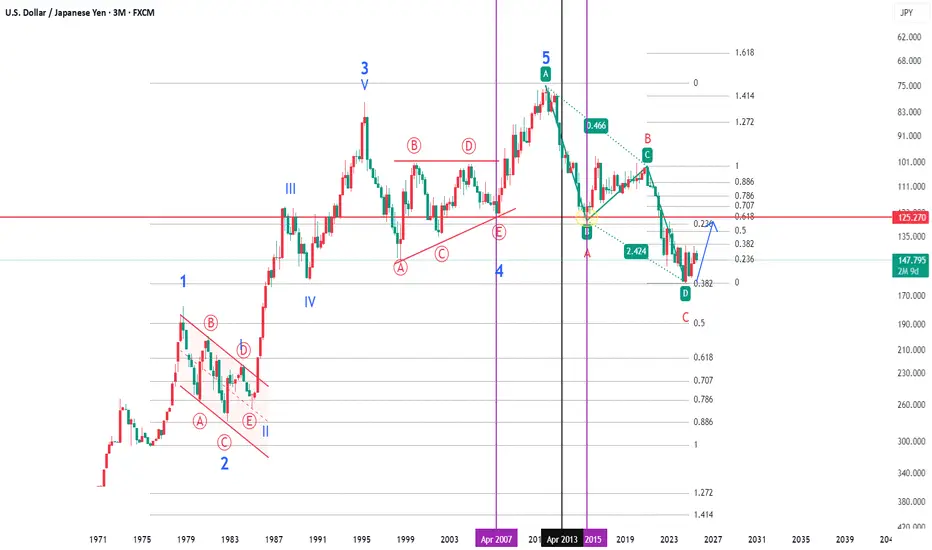
A Dramatic Forecast in USDJPY Using Elliott and FibonacciIn April 2013 Jeff Kennedy of Elliott Wave Institute offered his "Dramatic Forecast Using Elliott and Fibonacci Guidelines" in USDJPY as part of his Elliott Wave Junctures educational podcasts. We have recreated his quarterly JPYUSD chart up to date to verify his predict and to follow up.
Jeff''s forecast was realised spot on precisely 2 years later, in April 2015.
We have now got a completed ABCD pattern which begs a 61.8 correction to ca. 125 over the course of the next 2-3 years.
Note: Inverted log scale of USDJPY.
Dollar to Weaken Against Yen Over Next 6 MonthsUSD/JPY is showing signs of a potential downtrend after failing to break above key resistance at 152.00. The pair has formed a double-top pattern on the weekly chart, with RSI divergence signaling weakening bullish momentum. A break below 150.00 could accelerate losses toward 145.00 (200-day MA) and possibly 140.00 over the next 6 months.
The US dollar may weaken as the Fed is expected to start cutting rates in late 2024/early 2025, while the BoJ could cautiously tighten policy if wage growth persists. Narrowing US-Japan yield differentials (10-year yields) would reduce JPY carry-trade appeal, supporting yen strength. MoF’s verbal warnings and past interventions near 152.00 suggest strong resistance to further yen weakness.
Sasha Charkhchian

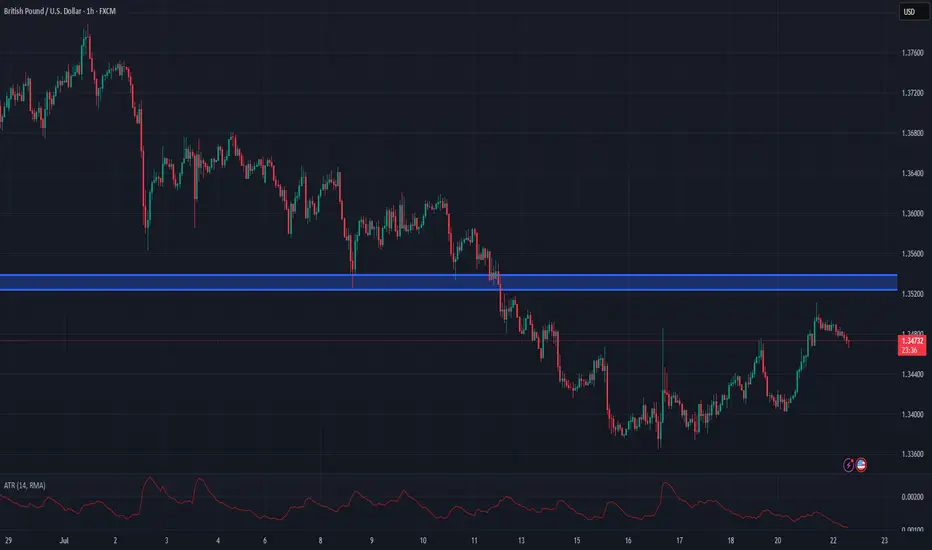
GBPUSD Short on PullbackGBPUSD has been trending down since the start of the July and we can look to get short on retests of the 1.3524-1.3539 area which has acted previously as support and hasn't been retested since we broke down
This area also ties in with the 38.2% retracement from the highs
Stops need to be above 1.3550
Targets can be initially to 1.3450-134.65 with potential to move back to 1.3368-1.3383 and maybe even lower
USD/JPY Possible Bear Scenario🔍 Analysis Summary:
USDJPY has failed to close above 146.1 on the weekly for the past 13 candles, showing clear signs of price exhaustion at this level. Price has also tapped into a marked 8HR bearish order block and printed a Daily Pin Bar — a strong reversal signal indicating potential downside.
📍Key Technicals:
• Resistance Holding: 146.1–146.6 zone
• Bearish Rejection: Pin Bar off resistance + order block
• Risk Area (Stop Zone): Above 147.16
• Target Zones: 144.2 (interim) → 142.4 (swing level)
🛠 Confluence:
• Order block rejection
• Multi-week resistance
• Clean structure with defined R:R
• Bearish candlestick confirmation
📊 Timeframe: 8HR
📉 Bias: Short
🔐 Risk Management: Proper stop loss in place above structure. Use personal risk limits.
⸻
⚠️ Disclaimer:
This setup is for educational and informational purposes only. It is not financial advice or a recommendation to trade. Always conduct your own analysis and use risk management based on your personal trading plan.


GBPUSD| - Bearish Play Setting UpPair: GBPUSD (GU)
Bias: Bearish
HTF Overview: Bearish structure intact — market has been respecting lower highs and pushing into downside pressure.
Current Zone: Price just mitigated the 30M OB, reacting as expected within the supply zone.
LTF Confirmation: Now waiting for clean confirmations on 5M or 1M — not in trader mode yet, analysis still in control.
Entry Zone: Watching for internal liquidity sweep or inducement followed by structure shift to confirm the sell.
Targets: First target is the next 30M low — extended target based on 1H continuation.
Mindset Note: No chasing — let the LTF tell the story before pulling the trigger. Control the urge, trust the system.
Bless Trading!

EUR/GBP SHORT FROM RESISTANCE
EUR/GBP SIGNAL
Trade Direction: short
Entry Level: 0.867
Target Level: 0.863
Stop Loss: 0.869
RISK PROFILE
Risk level: medium
Suggested risk: 1%
Timeframe: 4h
Disclosure: I am part of Trade Nation's Influencer program and receive a monthly fee for using their TradingView charts in my analysis.
✅LIKE AND COMMENT MY IDEAS✅

EURCAD (SMC BASED)TRADE SETUP EXPLANATION (SMC BASED):
PAIR: EURCAD
TIMEFRAME: 2H Chart (Entry Confirmation on 15M / 5M)
SETUP LOGIC (SMC STRATEGY):
BOS (Break of Structure) Confirmed — market is in bullish structure.
Price is retracing towards:
IMB (Imbalance zone)
POI 1H (Point of Interest - Demand Zone)
Liquidity (LIQ-$$$$) Sweep Expected Before Reaction.
TRIGGER CONDITION FOR ENTRY:
✅ After price enters the POI 1H Demand Zone, wait for:
→ CHoCH (Change of Character) confirmation on 15 min or 5 min timeframe.
→ CHoCH indicates buyers taking control after sweep and mitigation.
ENTRY PLAN:
🔹 Enter BUY trade after 15M / 5M CHoCH.
🔹 Stop Loss (SL) below POI zone.
🔹 Target previous high marked near 1.60296.
RISK-REWARD:
🎯 Aim for minimum 1:3 RR as visible on the chart.
KEY NOTES:
No entry directly at POI.
Entry only after confirmation (CHoCH) in lower timeframe.
Trade respects Smart Money Concepts (SMC) rules of BOS, Liquidity sweep, and POI reaction.
