NZDCAD Buy?? it looks juicy Hello please do not aim for the top of the range!!
Now because its NZDCAD it might look choppy and it might be choppy.
Forex market

USDCAD Bearish Breakout!
HI,Traders !
#USDCAD was trading along
The rising support line but
Now we are seeing a bearish
Breakout so we are bearish
Biased and we will be expecting
A further bearish move down !
Comment and subscribe to help us grow !

NZDUSD - Elliott Wave: High-Probability Reversal Zone Ahead!NZDUSD – Elliott Wave Roadmap
3Day Chart
Every move has been unfolding with precision — true to Elliott Wave Theory.
We're in the final leg of a massive A-B-C correction:
- Wave A and the complex Wave B (WXY) are complete.
- Wave C is now in play, targeting the highs of Wave A.
We’ve just seen a clean 5-wave advance (wave 1 leading diagonal).
Now expecting a classic ABC correction for wave 2, into our reversal zone (38.2–61.8% Fib).
🔍 Once price enters this zone, we’ll drop to lower timeframes and:
- Look for bullish confirmations (BOS, trendline break)
- Set entries with stops below corrective lows
- Targets: 0.63 (500 pips) and 0.65 (700 pips)
📌 Why is the buy zone so big?
It’s a higher timeframe zone. Once price enters, we zoom into lower timeframes for precise entries. The zone simply tells us when to focus, not where to blindly buy.
This is the Wave 3 generation point — and that’s where the real move begins.
Plan your trade. Watch for the setup. Execute with confidence.
Goodluck and as always, Trade Safe!
NZDUSD 12H Chart - Looking for this ABC correction for wave 2

EURUSD Bullish ProjectionIt’s been a while since my last update here.
Here’s my projection and actual entry/entries on EURUSD, based on a sweep of the previous 1H swing low and mitigation of a Daily imbalance (Fair Value Gap).
We're anticipating a full Change of Character to mark the end of the ongoing Daily pullback.

AU MONITOR Looking to see what price action does before deciding next trading plan in the short term.
EURUSD Will Go Up! Long!
Please, check our technical outlook for EURUSD.
Time Frame: 2h
Current Trend: Bullish
Sentiment: Oversold (based on 7-period RSI)
Forecast: Bullish
The market is approaching a significant support area 1.166.
The underlined horizontal cluster clearly indicates a highly probable bullish movement with target 1.170 level.
P.S
Overbought describes a period of time where there has been a significant and consistent upward move in price over a period of time without much pullback.
Disclosure: I am part of Trade Nation's Influencer program and receive a monthly fee for using their TradingView charts in my analysis.
Like and subscribe and comment my ideas if you enjoy them!

EUR/USD Eyes $1.179 If Resistance BreaksFenzoFx—EUR/USD is testing the 100-day moving average as resistance, a supply zone backed by VWAP at $1.171. The Stochastic Oscillator depicts 81.0 in the description, meaning the Euro is overpriced in the short term.
Therefore, we expect the pair to test the $1.160 demand zone before the uptrend resumes. Furthermore, the bullish outlook remains valid above $1.155, and a break above resistance at $1.171 can trigger the uptrend, targeting $1.179.

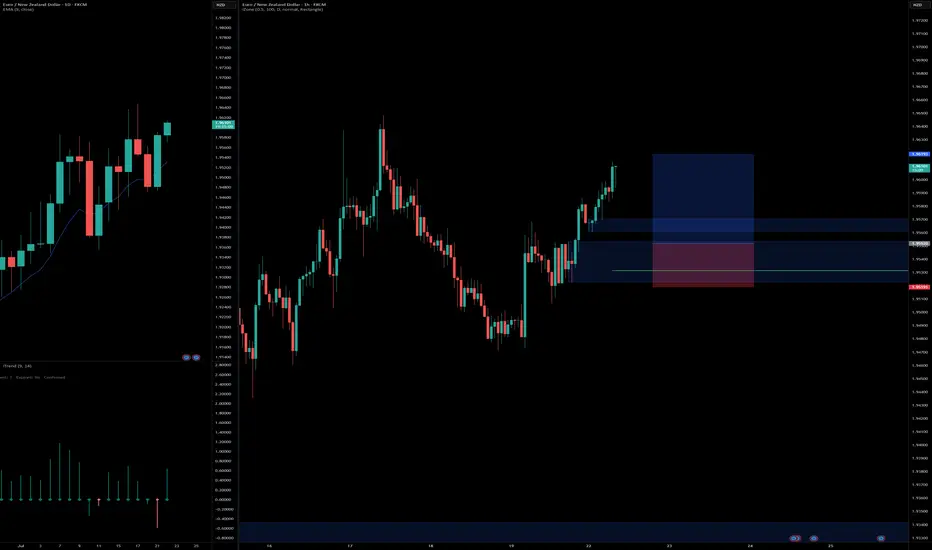
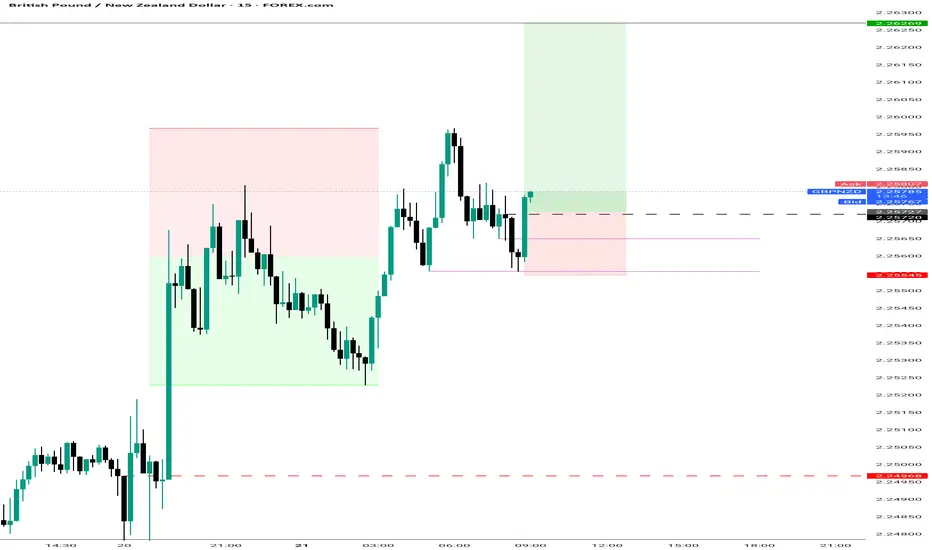
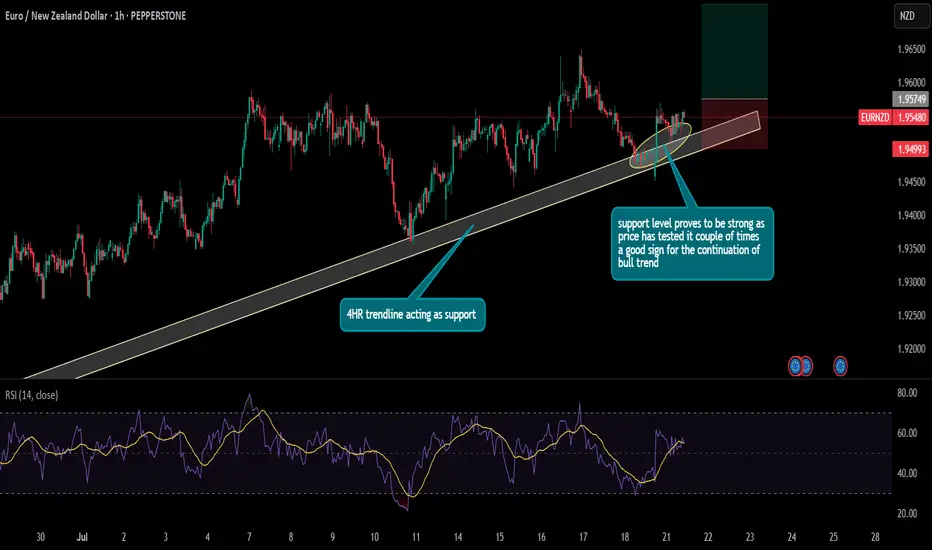
EURNZD long setupBuying from fresh demand zone after bullish structure break.
Daily showing strong momentum, 1H confirms continuation with clean break and retest zone.
📍Entry: Demand zone
🎯 Target: 2R
🛑 SL: Below demand zone
Risk-Reward: Favorable setup aligning with higher timeframe bias.
#trading #forextrading #EURNZD #priceaction #smartmoney #demandzone #tradingsetup #forexanalysis
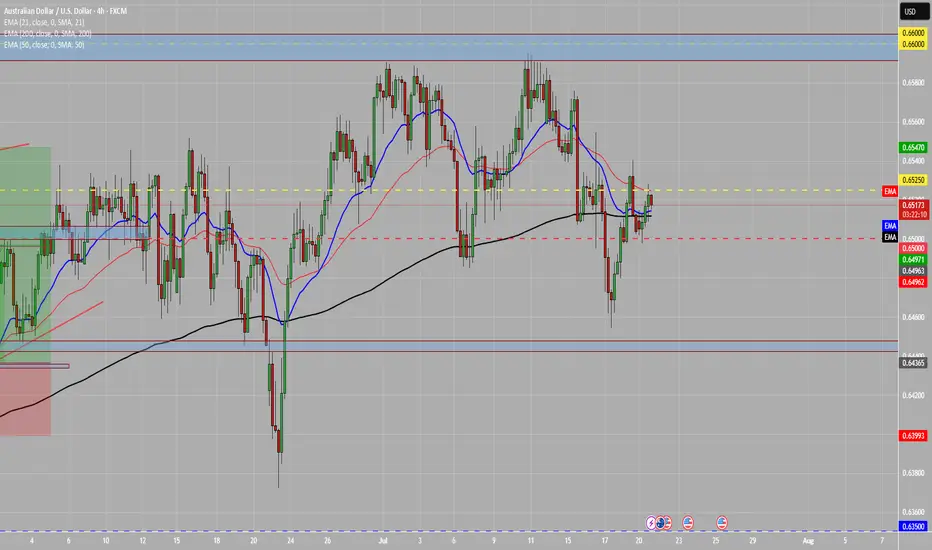
AUDUSD important support at 0.6465Trend Overview:
The AUDUSD currency price remains in a bullish trend, characterised by higher highs and higher lows. The recent intraday price action is forming a continuation consolidation pattern, suggesting a potential pause before a renewed move higher.
Key Technical Levels:
Support: 0.6465 (primary pivot), followed by 0.6445 and 0.6400
Resistance: 0.6570 (initial), then 0.6590 and 0.6625
Technical Outlook:
A pullback to the 0.6465 level, which aligns with the previous consolidation zone, could act as a platform for renewed buying interest. A confirmed bounce from this support may trigger a continuation toward the next resistance levels at 0.6570, 0.6590, and ultimately 0.6625.
Conversely, a daily close below 0.6465 would suggest weakening bullish momentum. This scenario would shift the bias to bearish in the short term, potentially targeting 0.6445 and 0.6400 as downside levels.
Conclusion:
AUDUSD maintains a bullish structure while trading above the 0.6465 support. A bounce from this level would validate the consolidation as a continuation pattern, with upside potential toward the 0.6570 area. A breakdown below 0.6465, however, would invalidate this view and suggest deeper corrective risk.
This communication is for informational purposes only and should not be viewed as any form of recommendation as to a particular course of action or as investment advice. It is not intended as an offer or solicitation for the purchase or sale of any financial instrument or as an official confirmation of any transaction. Opinions, estimates and assumptions expressed herein are made as of the date of this communication and are subject to change without notice. This communication has been prepared based upon information, including market prices, data and other information, believed to be reliable; however, Trade Nation does not warrant its completeness or accuracy. All market prices and market data contained in or attached to this communication are indicative and subject to change without notice.

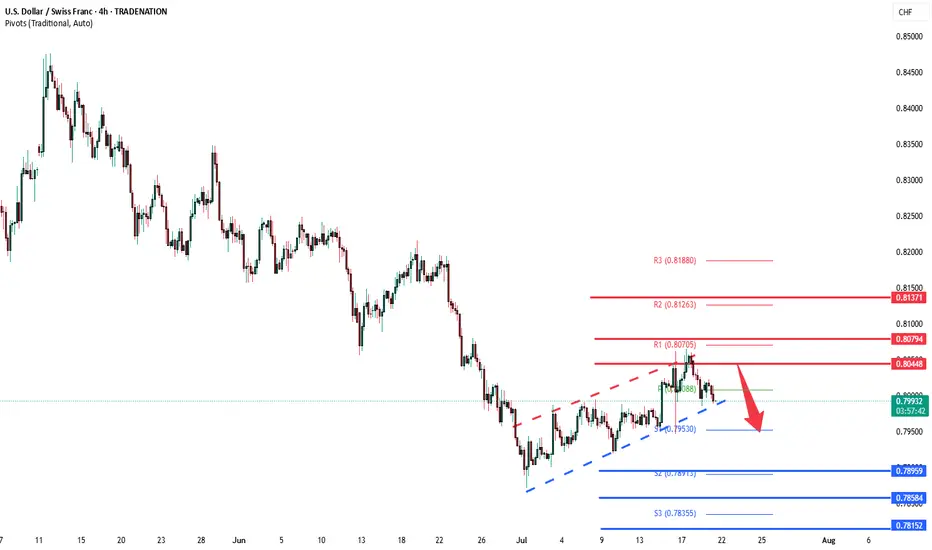
USDCHF Bearish oversold rally resistance at 0.8045The USD/CHF pair is currently trading with a bearish bias, aligned with the broader downward trend. Recent price action shows a retest of the falling resistance, suggesting a temporary relief rally within the downtrend.
Key resistance is located at 0.8045, a prior consolidation zone. This level will be critical in determining the next directional move.
A bearish rejection from 0.8045 could confirm the resumption of the downtrend, targeting the next support levels at 0.7900, followed by 0.7860 and 0.7810 over a longer timeframe.
Conversely, a decisive breakout and daily close above 0.8045 would invalidate the current bearish setup, shifting sentiment to bullish and potentially triggering a move towards 0.8080, then 0.8140.
Conclusion:
The short-term outlook remains bearish unless the pair breaks and holds above 0.8045. Traders should watch for price action signals around this key level to confirm direction. A rejection favours fresh downside continuation, while a breakout signals a potential trend reversal or deeper correction.
This communication is for informational purposes only and should not be viewed as any form of recommendation as to a particular course of action or as investment advice. It is not intended as an offer or solicitation for the purchase or sale of any financial instrument or as an official confirmation of any transaction. Opinions, estimates and assumptions expressed herein are made as of the date of this communication and are subject to change without notice. This communication has been prepared based upon information, including market prices, data and other information, believed to be reliable; however, Trade Nation does not warrant its completeness or accuracy. All market prices and market data contained in or attached to this communication are indicative and subject to change without notice.
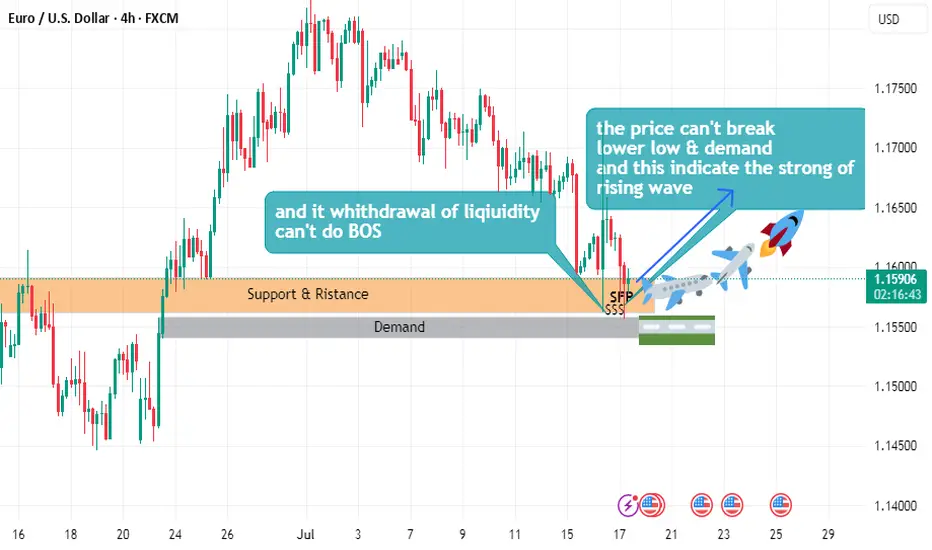
EURUSD buy plane Setuphello
the price can't break lower low
and can't demand
and this indicate the strong of uptrend wave
and it withdrawal of liquidity
and can't do beak of structure
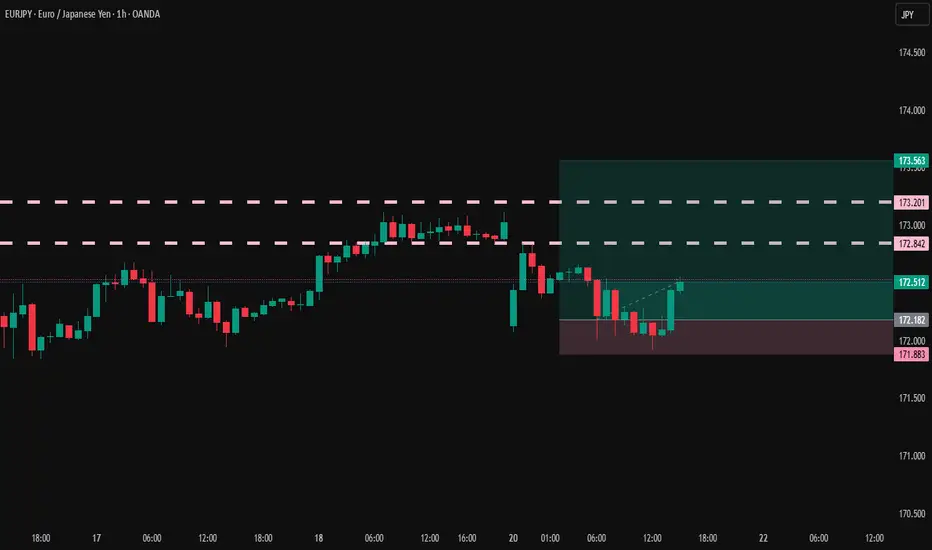
USDJPY 30Min Engaged ( Bullish Entry Detected )➕ Objective: Precision Volume Execution
Time Frame: 30-Minute Warfare
Entry Protocol: Only after volume-verified breakout
🩸 Bullish From now Price : 147.900
➗ Hanzo Protocol: Volume-Tiered Entry Authority
➕ Zone Activated: Dynamic market pressure detected.
The level isn’t just price — it’s a memory of where they moved size.
Volume is rising beneath the surface — not noise, but preparation.
🔥 Tactical Note:
We wait for the energy signature — when volume betrays intention.
The trap gets set. The weak follow. We execute.

nzdusd long tradein my opinion this is a good trade with a good r/r
hope it will hit the target
consider this is my trade not your trade
i just like to share my trades with world

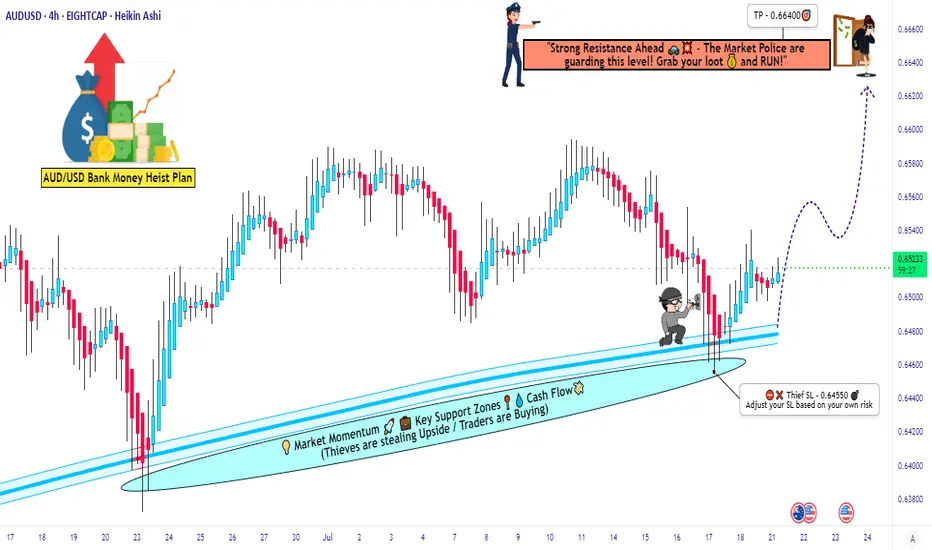
Ready for the Aussie Heist? Is This the Perfect Entry?🚨💰 - "The Aussie Vault Raid: Bullish Robbery in Progress!" 💰🚨
AUD/USD Forex Trade Idea (Thief Style Swing/Day Plan)
📈🔥 Designed for Thief Traders, Market Robbers & Money Makers Worldwide 🤑🐱👤💸
🌍 Hello Global Robbers!
🌟 Hola! Ola! Bonjour! Hallo! Salaam! Konnichiwa! 🌟
Welcome to another bold heist plan from the Thief Trading Crew. This one’s a high-stakes raid on the AUD/USD — "The Aussie" — using our signature Thief Trading Style, combining raw technical setups with real macro/fundamental edge. We're eyeing the Bullish Vault Breakout, so tighten up your gloves — it’s time to rob smart, not hard.
🔓💸 ENTRY PLAN – “The Vault is Unlocked!”
Grab the bullish loot at any valid price zone — but here’s how real thieves move:
📍 Recommended Entry Style:
Use Buy Limit Orders near local swing lows, demand zones, or key pullback entries on the 15m to 30m chart.
Execute DCA (Dollar Cost Averaging) / Layered Orders for more precision.
Align with your MA lines & candle structures for max confirmation.
🛑 STOP LOSS – “Escape Route Secured”
📍 SL hidden beneath recent swing lows below MA (on 4H):
🎯 Suggested Level: 0.64550
💡 Custom-fit your SL based on:
Trade size
Number of active positions
Account risk strategy
🎯 PROFIT TARGET – “Cash Out Before the Cops Show!”
🏴☠️ Take-Profit Zone: 0.66400
This is our bullish breakout reward zone — a high-value zone where profit meets safety.
🔍 MARKET OUTLOOK – "Cops Are Watching, but We're Ahead..."
📈 The AUD/USD market is flashing bullish momentum, supported by:
✅ Risk sentiment flow
✅ US Dollar weakness and rate expectations
✅ Intermarket signals from commodities (Gold/Iron)
✅ Positive macro positioning from smart money (via COT)
✅ Technical demand forming reversal patterns from oversold zones
📎 For a deeper breakdown —
📰 Fundamentals | COT Reports | Sentiment | Intermarket Analysis — Check Klick 🔗
⚠️ THIEF ALERT – “Avoid Sirens. Watch the News.”
Stay out of trouble by following these protocols during major news events:
🚫 Don’t enter trades blindly before/after big news
📍 Use trailing stops to protect gains
🔄 Adjust SL/TP if price nears breakout points during volatility
💥 SUPPORT THE CREW – “Smash That Boost Button!”
Love the plan? Then Boost this chart to show love for the Thief Trading Movement.
Every like, comment, and boost adds power to our robbery network across the globe. 🌍❤️💰
⚖️ DISCLAIMER – “Not Financial Advice, Just Thief Vibes”
📌 This analysis is for educational and entertainment purposes only.
📌 Trade at your own risk and always do your own analysis.
📌 Market moves fast — stay sharp, stay stealthy.
**🎭 See you at the next heist.
Until then, trade rich. Rob wise.
Thief Trader out. 🐱👤💰📉📈**
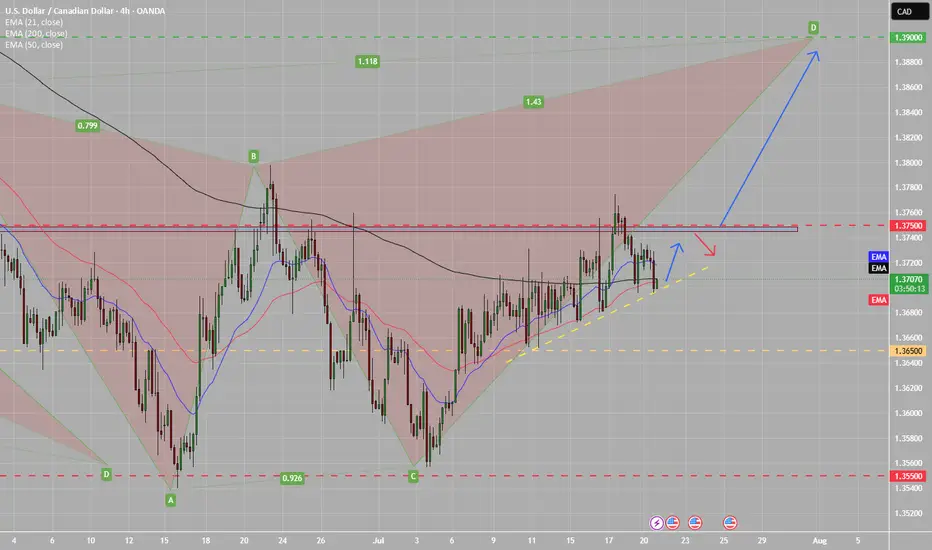
UC BULLISH C-D HARMONIC PATTERN Looking for price to finally break above the daily resistance for price to start a bullish rally towards Weekly resistance marked in green.
AUDUSD H1 I Bullish Bounce off the 50% FibBased on the H1 chart analysis, the price is approaching our buy entry level at 0.6494, a pullback support that aligns with the 50% Fib retracement.
Our take profit is set at 0.6538, an overlap resistance.
The stop loss is placed at 0.673, a pullback support.
High Risk Investment Warning
Trading Forex/CFDs on margin carries a high level of risk and may not be suitable for all investors. Leverage can work against you.
Stratos Markets Limited (tradu.com ):
CFDs are complex instruments and come with a high risk of losing money rapidly due to leverage. 66% of retail investor accounts lose money when trading CFDs with this provider. You should consider whether you understand how CFDs work and whether you can afford to take the high risk of losing your money.
Stratos Europe Ltd (tradu.com ):
CFDs are complex instruments and come with a high risk of losing money rapidly due to leverage. 66% of retail investor accounts lose money when trading CFDs with this provider. You should consider whether you understand how CFDs work and whether you can afford to take the high risk of losing your money.
Stratos Global LLC (tradu.com ):
Losses can exceed deposits.
Please be advised that the information presented on TradingView is provided to Tradu (‘Company’, ‘we’) by a third-party provider (‘TFA Global Pte Ltd’). Please be reminded that you are solely responsible for the trading decisions on your account. There is a very high degree of risk involved in trading. Any information and/or content is intended entirely for research, educational and informational purposes only and does not constitute investment or consultation advice or investment strategy. The information is not tailored to the investment needs of any specific person and therefore does not involve a consideration of any of the investment objectives, financial situation or needs of any viewer that may receive it. Kindly also note that past performance is not a reliable indicator of future results. Actual results may differ materially from those anticipated in forward-looking or past performance statements. We assume no liability as to the accuracy or completeness of any of the information and/or content provided herein and the Company cannot be held responsible for any omission, mistake nor for any loss or damage including without limitation to any loss of profit which may arise from reliance on any information supplied by TFA Global Pte Ltd.
The speaker(s) is neither an employee, agent nor representative of Tradu and is therefore acting independently. The opinions given are their own, constitute general market commentary, and do not constitute the opinion or advice of Tradu or any form of personal or investment advice. Tradu neither endorses nor guarantees offerings of third-party speakers, nor is Tradu responsible for the content, veracity or opinions of third-party speakers, presenters or participants.

EURNZD continues to be in bullish trend as shown in the chart, the 4-hour tf trendline is acting as a strong support level since the price has tested it multiple times to continue the bullish trend therefore a buy trade idea has been given on the chart according to the price action
Possibility of correction As long as the price does not stabilize above the green resistance area, there is a possibility of a trend change and the start of a downtrend.

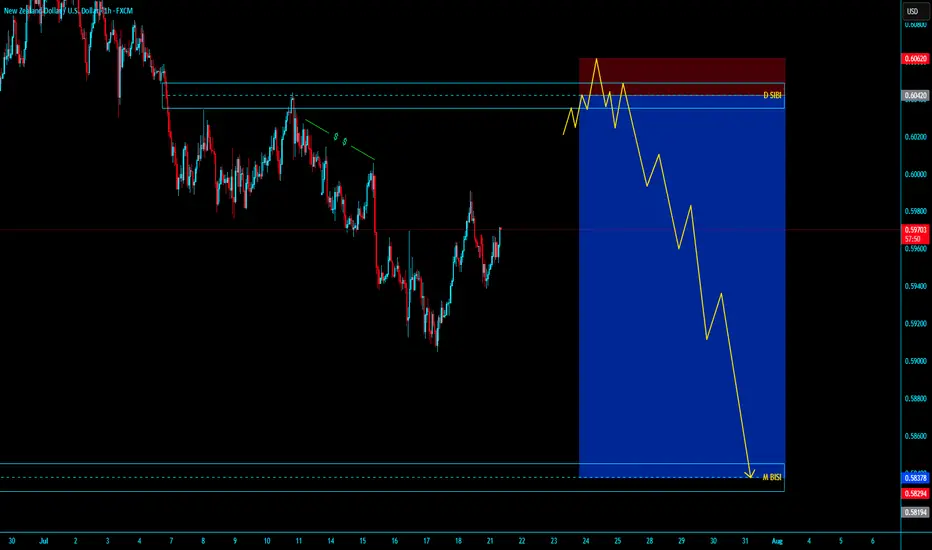
# NZDUSD SHORT SELLING# NZDUSD SHORT SELLING
Market IN monthly SIBI in Daily TF MSS , in Daily SIBI Going to LTF after Valid MSS with Run on Stop either Engage dose not Matter . entry with Tight SL and LONG Target Open
- HELLO..................
ENTYR PRICE - 0.60418
SL 20 PIPS - 0.60618
TARGET MONTHLY BISI - 0.58376
I THINK ITS OVER NIGHT HOLDING
JUST HOLD AND ENJOYYYYYYYYYYYYYYYYYYYYYYYYYYYYYYYYYYYYYYYYY
Market Insights with Gary Thomson: 21 - 25 JulyMarket Insights with Gary Thomson: RBA Minutes, BoJ Speech, ECB Decision, UK Sales, Earnings Reports
In this video, we’ll explore the key economic events, market trends, and corporate news shaping the financial landscape. Get ready for expert insights into forex, commodities, and stocks to help you navigate the week ahead. Let’s dive in!
In this episode of Market Insights, Gary Thomson unpacks the strategic implications of the week’s most critical events driving global markets.
👉 Key topics covered in this episode:
— RBA Meeting Minutes
— BoJ Deputy Governor Uchida Speech
— ECB Interest Rate Decision & Press Conference
— UK Retail Sales
— Corporate Earnings Statements
Don’t miss out—gain insights to stay ahead in your trading journey.
This video represents the opinion of the Companies operating under the FXOpen brand only. It is not to be construed as an offer, solicitation, or recommendation with respect to products and services provided by the Companies operating under the FXOpen brand, nor is it to be considered financial advice.

USDCHF Will Grow! Long!
Here is our detailed technical review for USDCHF.
Time Frame: 9h
Current Trend: Bullish
Sentiment: Oversold (based on 7-period RSI)
Forecast: Bullish
The market is approaching a significant support area 0.796.
The underlined horizontal cluster clearly indicates a highly probable bullish movement with target 0.804 level.
P.S
We determine oversold/overbought condition with RSI indicator.
When it drops below 30 - the market is considered to be oversold.
When it bounces above 70 - the market is considered to be overbought.
Disclosure: I am part of Trade Nation's Influencer program and receive a monthly fee for using their TradingView charts in my analysis.
Like and subscribe and comment my ideas if you enjoy them!
