$GJ (GBPJPY) 1HPrice is currently forming a descending triangle pattern, with clear lower highs and a horizontal support zone.
Trendline resistance is actively being respected.
Liquidity is likely building below the horizontal support zone.
A false breakout or sweep above the trendline followed by rejection could trigger institutional distribution.
As long as the descending trendline holds, and no bullish BOS occurs, the structure remains bearish. Look for price to accumulate short positions before expansion.
Forex market

GBPJPY AccumulatingGBPJPY is building liquidity. We can see it around these zones. So trading between the zones will be wonderful. We can not say anything about the direction of GBPJPY right now because it is oscillating between the zones. The clear picture can be trade zones for scalping. No any potential move seen here.

EURUSD Short re entry, 14 JulyHTF Downtrend with Clean LTF Setup
Bias remains bearish with HTF downtrend, W imbalance resting above, and 4H 50EMA close to our zone.
📉 Confluence:
Textbook LTF structure, expecting LH → LL
DXY reacting from 15m POI + Asia low to fill
15m Extreme OB + 5m OB as entry zone
Clean 1m BOS confirming sellers stepping in → add another 50%
🎯 Entry: 50% tap of 5m OB after 1m BOS
🛡️ SL: Above LH structure
📌 TP: At least 1:3 RR down to Asia low
⚠️ Minor risk with W imbalance above, but strong trend and confirmations to support the trade.
3 hours ago
Trade active
We got an 1mBOS from the 15m POI
Got 2 entry points now : The one from the 5m OB marked out on the photo and one at the lower 5m that created the break. Will see what happens

GBPUSD Internal Summary GBPUSD is approaching a key confluence area formed by a long-term channel and horizontal support. Bullish bounce is expected if this zone holds.
❌ Invalidation: Below 1.33174
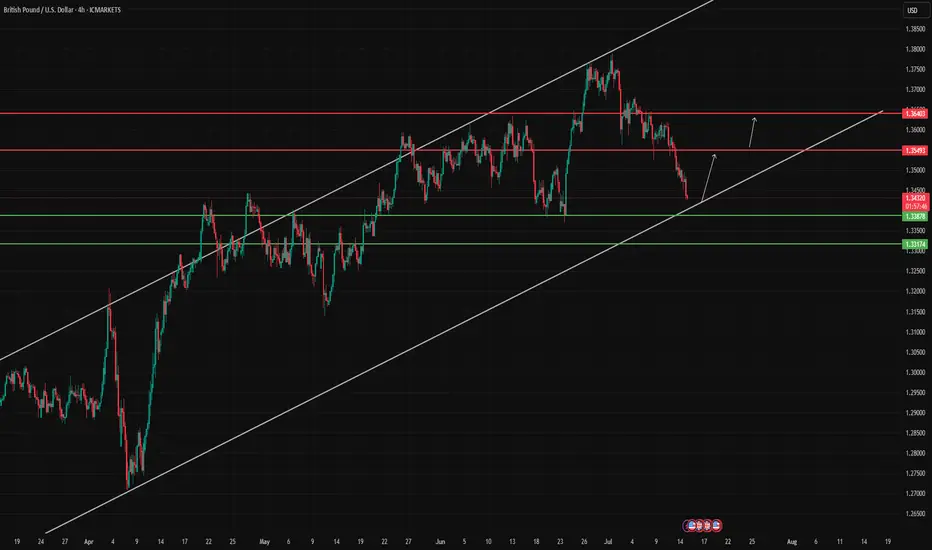
GBPUSD: Two Strong Bullish Area To Buy From ?GU is currently in a bullish trend when examined on a daily time frame. There are two potential areas for purchase. The first area is currently active, as we anticipate a price reversal from this point. There is a significant possibility that price could decline to the second area and subsequently reverse from there directly. The sole reason we believe price could drop to the second area is if the US Dollar experiences corrections, which could cause GU to drop to our second area and subsequently rebound.
If you appreciate our analysis, we kindly request that you consider the following actions:
-Liking the Ideas
-Commenting on the Ideas
-Sharing the Ideas
We extend our sincere gratitude for your continuous support. We trust that our insights have provided even a modicum of assistance.
Team Setupsfx_
❤️🚀

USDCAD still bullish?
OANDA:USDCAD what's next, we are have bullish push, currently price in ASCENDING CHANNEL and in ascending channel is visible and one more ASCENDING CHANNEL (marked yelow), interesting chart,- can we see higher bullish push?
SUP zone: 1.36800
RES zone: 1.37600, 1.37900

GBP/USD Drop: Something Big BrewingGBP/USD is cratering, hitting 1.3550 as weak UK economic data and a soaring dollar dominate. Markets look grim with supports shattered. A liquidity drop could trigger wild swings and wider spreads. Global news adds heat: Trump’s 35% tariff threats on Canada and BRICS nations stir trade war fears, crushing GBP. Stay alert, tighten risk.

EURUSD📉 EURUSD – 30min Short Plan
📊 Structure: LLs & LHs forming – bearish trend confirmed
🕯️ Pattern: Bearish Engulfing at Lower High
🎯 Entry: instant
📌 Trade 1
– 🎯 TP1: 1:1
– ⚠️ Risk: 1%
📌 Trade 2
– 🎯 TP2: larger reward
🛠️ Execution:
– Place both trades at same entry
– Trail SL after TP1 hit
📎 Bias: Bearish

EURUSD AccumulationI am looking for some accumulation here. The model can already be complete, but i would only take it if it extends into a model 2 from extreme liquidity to create more liquidity for a reversal. The supply above, followed by the strong sell off lowers the quality of this model. A supply mitigation with a slow pullback into the POI would change that.
AUDUSD good structure for higher bullish
OANDA:AUDUSD whats next, we are have DESCENDING CHANNEL breaked, its followed by bullish push, but its not make to much in my op, at end price is make revers, its stop at end on strong sup zone (0.64900).
We are have in last day-two RBA and RBNZ today, price is start pushing looks like zone 0.64900 can be taked for valid zone, from which now expecting higher bullish push in next periods.
SUP zone: 0.65100
RES zone: 0.66300, 0.66600

audcad Short
We have a break of structure. we waiting for a fair value gap on lower time frame in order to sell to those zone. lets wait and see how it goes


GBP/CAD BEARS ARE GAINING STRENGTH|SHORT
GBP/CAD SIGNAL
Trade Direction: short
Entry Level: 1.858
Target Level: 1.849
Stop Loss: 1.863
RISK PROFILE
Risk level: medium
Suggested risk: 1%
Timeframe: 3h
Disclosure: I am part of Trade Nation's Influencer program and receive a monthly fee for using their TradingView charts in my analysis.
✅LIKE AND COMMENT MY IDEAS✅

Triangle Formation (Rising wedge STF) I believe we can see some downside here. Price has bounced of the 61.8 fib level and looks to have created a triangle pattern. I’m not currently in any positions, I will wait for a breakout of the rising wedge for a short position.

GBP/USD – Uptrend Channel Analysis!GBP/USD is trading inside a strong uptrend channel on the 4-hour chart.
Recent price action confirmed a Break of Structure (BOS), signaling solid bullish control.
Buyers have pushed price firmly above previous resistance zones.
Price is now near the upper boundary of the channel.
Signs of short-term exhaustion suggest a likely retracement ahead.
A pullback into the retracement level or channel midline would offer better risk-reward.
Key Levels to Watch:
Channel support for potential bounce.
Retracement zone as a buy opportunity.
Trade Plan:
Wait for a clean retracement toward support.
Look for bullish confirmation before entering long.
Avoid chasing highs – focus on discounted entries.
Bias: Bullish while price holds the uptrend channel structure.
Expect continuation after healthy correction.
Patience is critical – let the market set up a quality entry.
Traders should align with the dominant trend and manage risk carefully.
Like, comment, share, and follow for more trading ideas.

Buy EURUSDRisky scalp trade on EURUSD. Price is clearly declining but we will go against the run of play here as I anticipate a quick liquidity grab before sells continue.

EURJPY IDEA After seeing the previous day close with bullish momentum we could expect continued push to the upside but since the 4hr is trading at a HH area a slight retrace could occur before the next bullish move to the upside

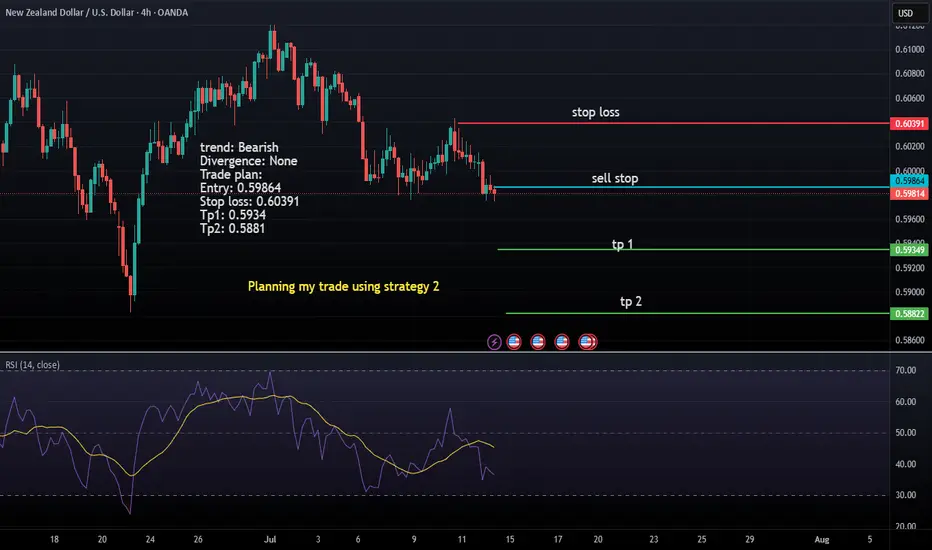
Bearish trend in NZDUSD pairA Bearish trend in the NZDUSD pair clear shows no divergence so I will short it and booking my tp 1 & tp 2
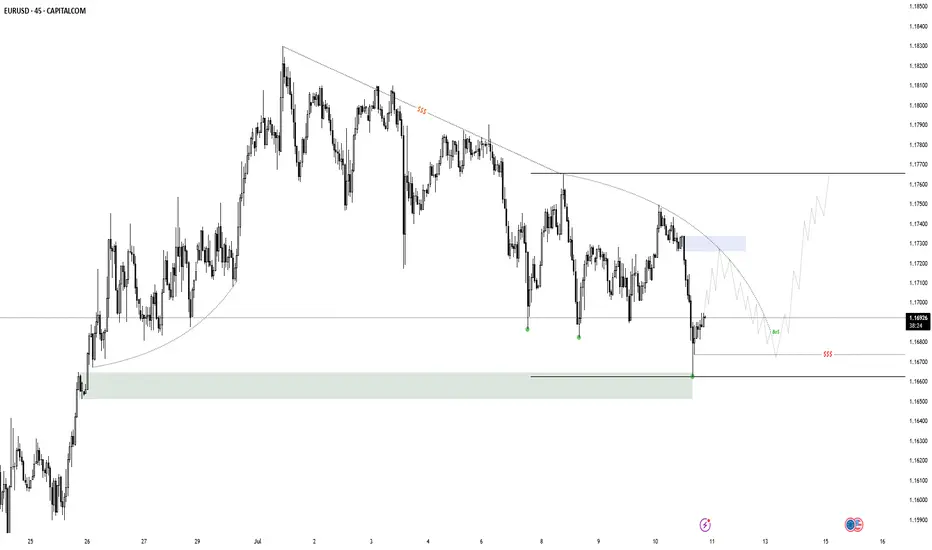
Internal Summary EURUSD Pair: EURUSD
Bias: Bullish
Timeframe: 1H
Trigger: Support test within triangle pattern
Targets:
TP1: 1.17217
TP2: 1.17851
Invalidation: Below 1.15942
Comment: Price is compressing inside a symmetrical triangle, holding above a key ascending trendline. A breakout to the upside looks probable as long as price holds current support.

NZD_CHF RISKY LONG|
✅NZD_CHF has retested a key support level of 0.4760
And as the pair is already making a bullish rebound
A move up to retest the supply level above at 0.4776 is likely
LONG🚀
✅Like and subscribe to never miss a new idea!✅
Disclosure: I am part of Trade Nation's Influencer program and receive a monthly fee for using their TradingView charts in my analysis.

$EJ (EURJPY) 1HPrice has been in an overall bullish structure, forming higher highs and higher lows.
Price tapped into a premium zone, showing signs of exhaustion.
After the liquidity run, we saw a rejection from the top, followed by a shift in structure.
A bearish FVG has formed, and price has now retraced back into it, offering a potential sell opportunity.
As long as price holds below the high and inside the premium FVG zone, bearish bias is valid. Any break above the recent high would invalidate this setup.

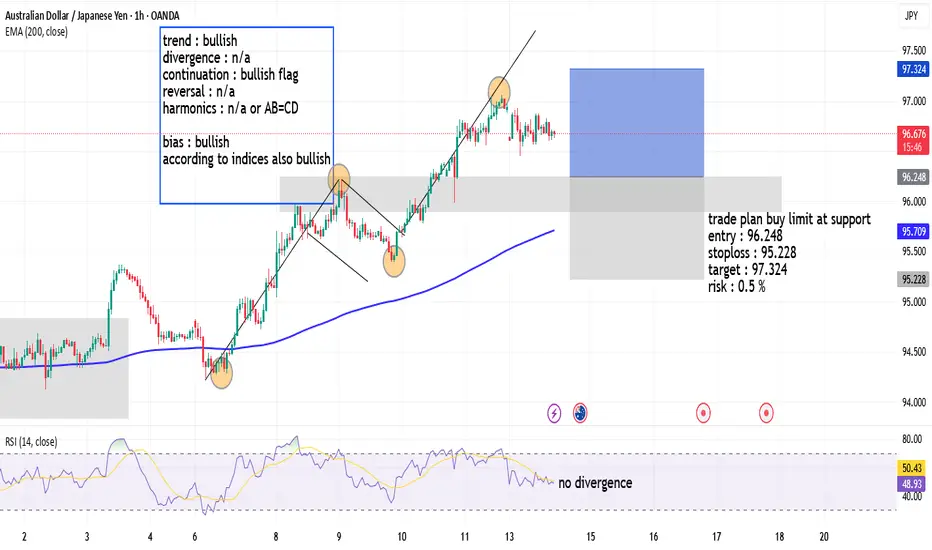
AUDJPY 14-7-2025trend : bullish
divergence : n/a
continuation : bullish flag
reversal : n/a
harmonics : n/a or AB=CD
bias : bullish
according to indices also bullish
AUDUSD: Short Setup Ahead of Key Data OANDA:AUDUSD
AUDUSD is hovering near a rising trendline, with price action compressing and signaling a potential downside break in the coming sessions.
Just above, the 0.65900 resistance zone has capped recent rallies, and the pair’s failure to clear this level strengthens the case for a reversal.
Later today, we will see Westpac Consumer Confidence data for Australia, which could act as a catalyst for a sharp move. A weaker-than-expected print would likely pressure the Aussie further.
📋 Entry Checklist:
✅ Testing rising trendline, signaling potential breakdown
✅ Strong resistance at 0.65900 holding rallies
✅ Key consumer sentiment data could trigger volatility
📈 Trade Plan:
🔻 Sell Entry: 0.65600
❌ Stop Loss: 0.66200
✅ Take Profit: 0.65000
(Tap 👉 Trade Now 👈 on mobile to copy SL & TP easily)
📰 Fundamental Snapshot:
The Reserve Bank of Australia (RBA) surprised markets by holding rates steady at 3.85%, diverging from expectations of a potential cut. The RBA remains cautious amid persistent inflation risks driven by high labor costs and weak productivity, suggesting rates may stay restrictive longer.
Governor Michele Bullock highlighted that inflation could remain above forecasts, while Deputy Governor Andrew Hauser emphasized monitoring global uncertainties, including U.S. tariff developments, reflecting the RBA’s sensitivity to external headwinds impacting growth and trade.
