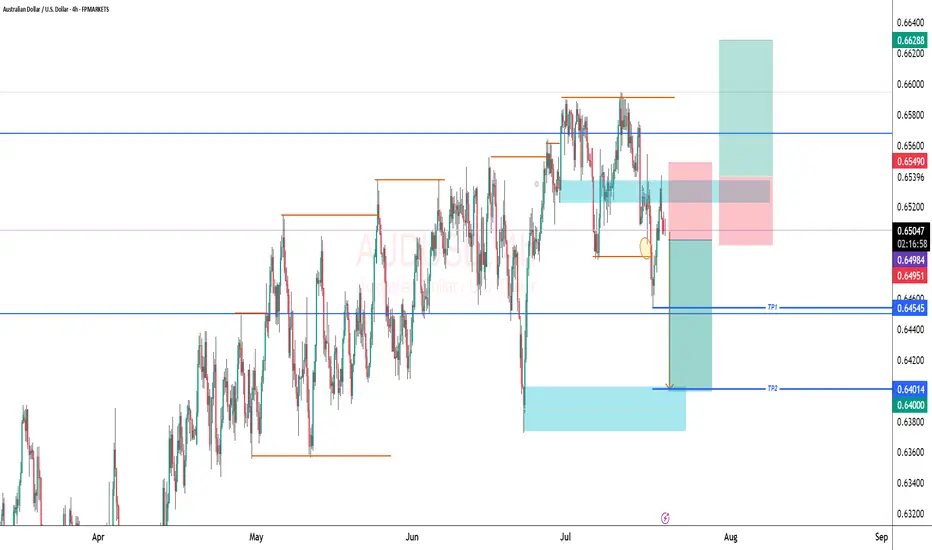
NZD/USD BUYERS WILL DOMINATE THE MARKET|LONG
NZD/USD SIGNAL
Trade Direction: long
Entry Level: 0.595
Target Level: 0.608
Stop Loss: 0.587
RISK PROFILE
Risk level: medium
Suggested risk: 1%
Timeframe: 1D
Disclosure: I am part of Trade Nation's Influencer program and receive a monthly fee for using their TradingView charts in my analysis.
✅LIKE AND COMMENT MY IDEAS✅
Forex market

BUY EURCAD now for 4h time frame bullish trend continuationBUY EURCAD now for 4h time frame bullish trend continuation ...............
STOP LOSS: 1.5933
This buy trade setup is based on hidden bullish divergence trend continuation trading pattern ...
Always remember, the trend is your friend, so whenever you can get a signal that the trend will continue, then good for you to be part of it
TAKE PROFIT : take profit will be when the trend comes to an end, feel from to send me a direct DM if you have any question about take profit or anything...
Remember to risk only what you are comfortable with... trading with the trend, patient and good risk management is the key to success here

short chfjpyplan is to short CHFJPY and other pairs with JPY as quote as similar patterns prevails. that is USDJPY, CADJPY, EURJPY, NZDJPY, AUDJPY, etc and hold for 2 or 3 days. it could go as low as the 2.618 fib level but let's start locking profit at 1.618.

#012: LONG Investment Opportunity on EUR/USD
In this scenario, I placed a passive long order on EUR/USD at a key zone that has shown signs of accumulation and institutional defense in recent days.
The price showed bearish manipulation followed by a sharp rebound with a V-shaped pattern, often indicative of stop-loss hunting. In these phases, a direct entry is less effective than a passive strategy aimed at intercepting a possible technical pullback in the zone where abnormal volumes and algorithmic defenses have manifested.
The order was designed to be activated only if the market were to temporarily return to the previously absorbed zone, thus avoiding chasing the price after a directional candlestick.
The stop-loss placement was carefully chosen to avoid both typical retail hunting zones and areas visible to algorithms. It is positioned to ensure operational invisibility, but also consistency with the logic of institutional defense: if reached, the trade will be automatically invalidated.
The target is aligned with the superior technical structure and the normal range of movement that develops when this dynamic is respected.
This operation is designed to be left to operate completely autonomously, without the need for adjustments or active management. Either in or out. The sole objective is to align with institutional flows, with controlled risk and a favorable management structure.

Long EURUSDI want to long EURUSD here, kinda looks nice.
Good risk reward, expecting a rejection in this area.
USDCAD(20250721)Today's AnalysisMarket news:
Waller refused to comment on whether he would dissent at the July meeting, saying that the private sector was not performing as well as people thought, and said that if the president asked him to be the chairman of the Federal Reserve, he would agree.
Technical analysis:
Today's buying and selling boundaries:
1.3725
Support and resistance levels:
1.3785
1.3763
1.3748
1.3702
1.3687
1.3665
Trading strategy:
If the price breaks through 1.3725, consider buying, and the first target price is 1.3748
If the price breaks through 1.3702, consider selling, and the first target price is 1.3687

EURUSD TRADE IDEA EURUSD pulled back for a trade to the upside.
We got involved on the trade at our Fibonacci level and we seem to be powering to the upside.
Let's see how the market does it's thing.

GBPUSD SHORTMarket structure bearishh on HTFs 3
Entry at both Weekly and Daily AOi
Weekly Rejection at AOi
Previous Weekly Structure Point
Daily Rejection at AOi
Daily EMA retest
Around Psychological Level 1.34500
H4 EMA retest
H4 Candlestick rejection
Rejection from Previous structure
Levels 5.02
Entry 115%
REMEMBER : Trading is a Game Of Probability
: Manage Your Risk
: Be Patient
: Every Moment Is Unique
: Rinse, Wash, Repeat!
: Christ is King.

EUR/USD 6E Futures Risk Management: Navigating Macro Divergence As Risk Manager at WaverVanir International, I’m constantly evaluating asymmetrical setups where macroeconomic divergence aligns with technical structure. The current EUR/USD trade is one such instance—an evolving case of volatility compression within a descending triangle, positioned beneath key resistance at 1.1730.
🔻 Bias: Bearish
🧮 Structure: Daily lower highs + descending triangle
📉 Key Break Level: 1.1612 (horizontal support)
⚠️ Invalidation: Daily close above 1.1730
📊 Probability: 65% likelihood of downside continuation into August, driven by USD real yield strength and ECB rate path lag
We’re managing this trade with dynamic risk protocols:
🔐 Option hedge overlay for tail protection
🎛️ Exposure throttle post-FOMC volatility
💡 VolanX protocol flags 1.1530 and 1.1360 as likely liquidity pools if 1.1612 gives out
🧠 Remember: It's not about being right—it's about being protected when wrong.
—
This post is part of our ongoing commitment to transparency, system-level discipline, and volatility-aware macro execution.
#WaverVanir #VolanXProtocol #MacroTrading #RiskManagement #6EFutures #EURUSD #OptionsFlow #InstitutionalTrading #ForexStrategy

UsdZar-Buy Scenario123 Levels, Inverse Head and Shoulders, Trendline Breakout and retest, Bullish Pennant Formation

EURUSD Forecast – Smart Money Setup 21st July 2025Here’s the detailed breakdown of my current EURUSD setup based on internal/external liquidity and order block reaction:
🔹 Bias: Bullish (after deeper retracement)
🧠 Breakdown:
Liquidity Sweep ✅
A clear liquidity sweep took place below recent equal lows.
This sweep triggered a bullish displacement, confirming demand.
Market Structure Shift (MSS) 🔁
A valid MSS followed the sweep, confirming short-term reversal in structure.
4H Internal Liquidity 🫧
Price tapped into internal liquidity, setting the stage for a deeper retracement before continuation.
15 Min Order Block (OB) 🧱
Price is currently trading within a 15-minute OB zone, which aligns with minor resistance before a deeper retrace.
🔻 Anticipated Retracement:
Expecting a short-term rejection from the current OB zone.
Price may retrace into the 4H OB zone near 1.1590–1.1610, aligning with an upcoming 4H liquidity pool.
This zone also aligns with previous mitigation and accumulation areas.
🟢 Final Target:
If the 4H OB holds, I'm anticipating a bullish continuation targeting the external 4H liquidity near 1.1730+.
📌 Summary:
Waiting for retracement into demand zone → looking to long from 1.1590–1.1610 area → targeting 1.1730+.
✍️ Execution Plan:
Set alerts near 1.1610
Look for LTF CHoCH or BOS confirmation in demand
Enter with tight stop loss below 4H OB
Target external liquidity

AUD/CAD LIVE TRADE UPDATELIVE TRADE – VMS Pullback Strategy
We entered this trade based on a classic VMS pullback setup:
Price pulled back into a 3-touch S/R zone
Volume and momentum aligned with the direction
Engulfing candle trigger confirmed the move near the 50EMA
Now we’re simply letting the trade play out.
📌 The work is done before entry. Discipline does the rest.

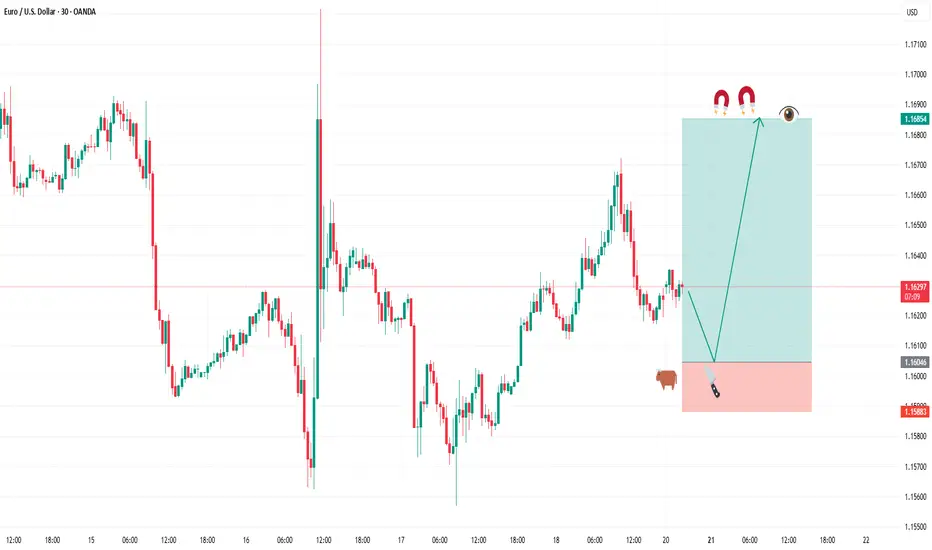
BUY FIBERGreetings traders, today we are looking for buys on EURUSD. Our first entry is at 1.16288 and second entry will be lower at 1.16046 our target is 1.16854 and stops are below 1.15883. use proper risk management and best of luck.
This trade is based on a fine tuned DAILY approach to the algo. Be careful and risk wisely.
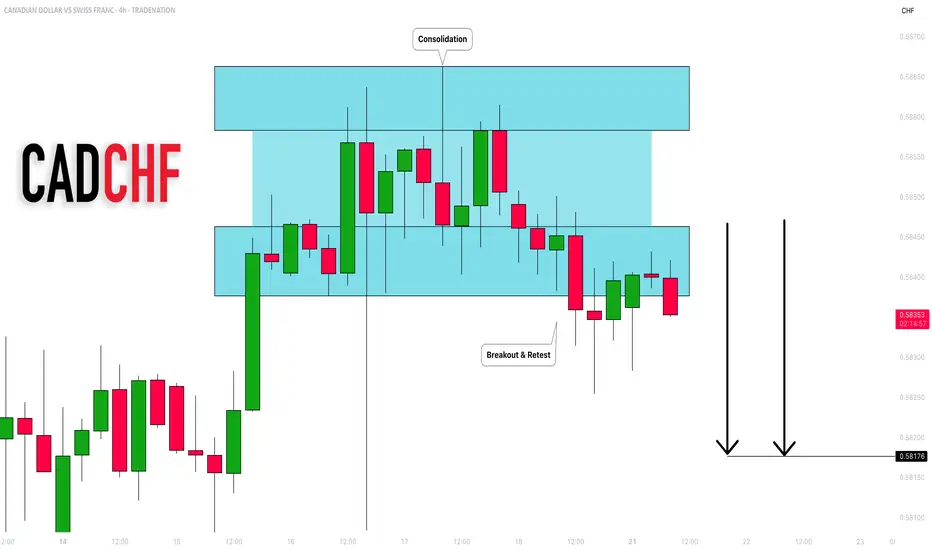
CADCHF: Bearish Outlook Explained 🇨🇦🇨🇭
CADCHF completed an intraday consolidation within a horizontal
parallel channel.
Its support was broken on Friday and we see a positive bearish
reaction to that after its retest.
With a high probability, the price will drop to 0.582 level soon.
❤️Please, support my work with like, thank you!❤️
I am part of Trade Nation's Influencer program and receive a monthly fee for using their TradingView charts in my analysis.
EURGBP CONTINUING BULLISH TREND STRUCTUREEURGBP CONTINUING BULLISH TREND STRUCTURE IN 4H TIME FRAME.
Price is currently in a secondary trend.
Price is expected to end the secondary trend and start primary trend again.
On higher side market may hit the targets of 0.87400
On lower side 0.85950 may act as a key support level.

EURJPY Bearish Bat PatternOn the weekly chart, EURJPY has currently formed a bearish bat pattern, and short selling can be considered at present. The downside target is around 166.8. After breaking through, the support below is around 162.2.

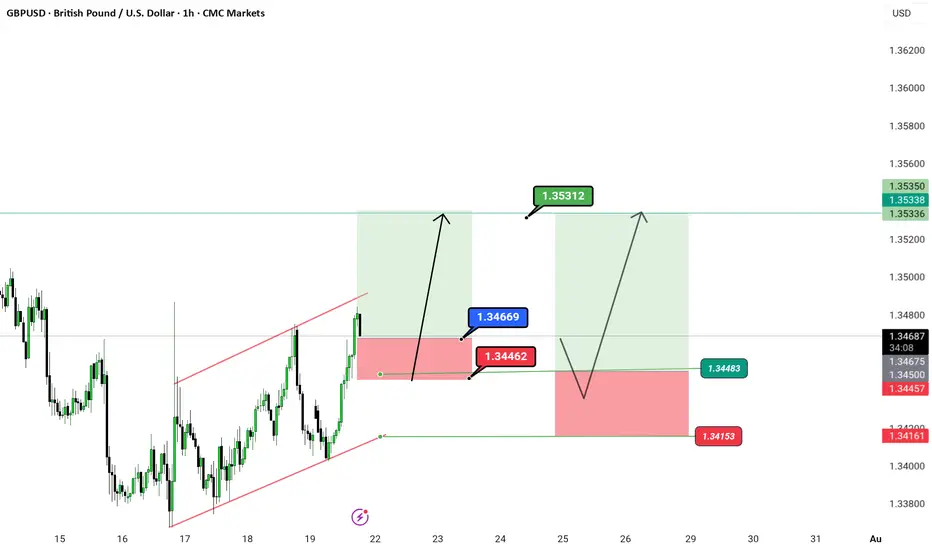
GBP/USD – Clean Breakout Play We just broke structure on the 1H. Simple setup, clean price action. Nothing complicated.
📍 Breakout Zone: 1.34669
✅ Target 1: 1.35312
✅ Target 2: 1.35350
❌ Stop Loss: 1.34462
⛔ Invalidation Level: 1.34153
🧠 Price broke out of the red channel and retested — now it's game on. If we stay above structure, next move is liquidity grab at the highs.
This is how you trap the market before it traps you.
🕒 Timeframe: 1H
⚙️ Strategy: Channel Breakout + Retest Confirmation

LOOKING FOR SHORTS ON AUD/USDWith Weekly time frame showing a strong downtrend then it is expected that lower timeframe aligns with it andso the Daily and 4HR are showing exactly that .
Double top formed and price trading in the area of our fib GOLDEN ZONE, We are expecting a decline in AUD potentially this upcoming week
GBP/USD – Breakout bullish bias O_o🎉 GBP/USD – Breakout Party Above the Channel! 🎉
Pound-Dollar just said “bye-bye” to the red channel and is getting ready to dance its way up 💃💵
We have a clean breakout with two possible flight paths 🚀:
📍 Entry Zone: Around 1.34669
🎯 Targets:
1️⃣ 1.35312
2️⃣ 1.35350 (Double top zone – watch this closely 👀)
🛑 Stop Loss: 1.34462
❗ Invalidation below: 1.34153
📐 Structure: Parallel channel breakout 💥
📆 Timeframe: 1H
📌 Chart by: @greenfire_forex
🧠
---
#GBPUSD #ForexTrading #BreakoutSetup
EURCAD looks great for buysOn the monthly timeframe, price recently broke and closed above a key resistance level, showing clear bullish direction in the bigger picture. The weekly chart confirms this bullish bias with a clean rejection of a strong Fibonacci support zone and weekly pivot area, highlighting solid buyer interest.
On the 4-hour chart, the pair broke out from a descending channel pattern, retested the breakout zone around the weekly pivot area, and bounced strongly. This re-test confirms buyer interest. Additionally, price is trading above both the 50 and 200 SMAs, indicating a strong bullish sentiment on lower timeframes.

Bull Market, Bear Move: Temporary Shift or Trend Change?Hello Traders,
Welcome to the new trading week.
The daily timeframe remains in a strong bullish trend; however, recent price action shows a break in alignment on the 4-hour chart. After sweeping a weak daily higher high, the 4-hour structure has shifted bearish, indicating a potential retracement or deeper correction. This internal shift suggests that price may now be heading toward the last weak low as liquidity and structural targets align. Caution is advised until the 4-hour and daily biases realign.

EURUSD Short ProjectDescription:
1. Price Drivers: smart money distribution
2. Current Trend: down
3. Momentum: confirmed bearish
Action: Waiting for entry on the intraday timeframe (Entry will be published further)
*Disclaimer: I will not accept liability for any loss or damage, including without limitation to any loss of profit, which may arise directly or indirectly from use of or reliance on such information.

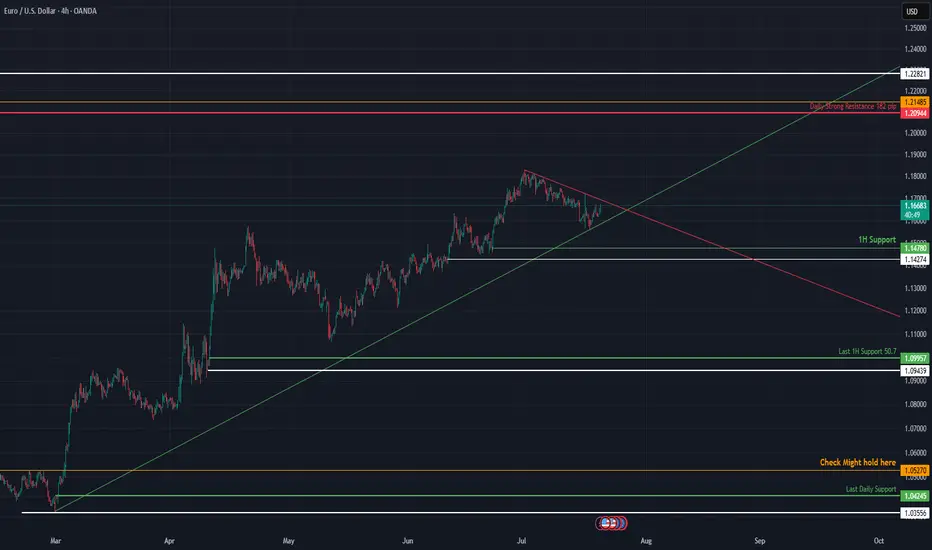
EURUSD Approaches Key Technical Breakout Point📈 EURUSD at a Critical Decision Point Between Two Trends
EURUSD is coiling between descending resistance and ascending support. A breakout from either direction will likely define the next leg of the move. This post breaks down the converging structure, high-probability levels, and what traders should watch to stay on the right side of the market.
🔍 Technical Analysis:
Price action is trapped between a downward sloping trendline (resistance) and a rising trendline (support), forming a symmetrical triangle. This compression indicates growing tension — and whichever trendline breaks first could dictate market direction in the coming weeks.
Currently, EURUSD is hovering near 1.1670, testing short-term structure while holding above prior swing supports.
🛡️ Support Zones (if downside breakout occurs):
🟢 1.1670 – 1H Support (High Risk)
First response zone on minor pullbacks.
Stop-loss: Below 1.1620
🟡 1.1470 – 1.1427 – Medium-Term Support (Medium Risk)
Confluence of diagonal and horizontal structure. Swing entry potential.
Stop-loss: Below 1.1380
🟠 1.0799 – Last 1H Support (Low Risk)
If the ascending trendline fails, this is the final zone to preserve a bullish structure.
Stop-loss: Below 1.0740
🔻 1.0242 – 1.0195 – Last Daily Support (Extreme Risk)
Loss of this zone marks a macro bearish shift.
🔼 Resistance Zones (if upside breakout occurs):
🔴 1.2094 – 1.2148: Daily Strong Resistance
Key breakout level. Strong historical supply. Clean close above here signals trend continuation.
Conclusion
EURUSD is at a technical fork — squeezed between opposing trendlines. The first decisive break will likely set the tone for Q3. Watch 1.2148 on the upside and 1.1427 on the downside for direction confirmation.
Not financial advice. Like & follow for more structured FX insights.