"USD/JPY Elliott Wave Short Setup – Targeting Key Support Zone"This chart shows a potential USD/JPY short trade setup based on Elliott Wave analysis. The price appears to have completed a 5-wave upward structure, reaching resistance near 148.75–149.19. A short position is suggested with:
Entry: Around 148.75
Stop Loss: Above 149.19
Target: 146.23–145.80 support zone
The trade aims to capture a corrective move following wave (5).
Forex market

EURUSD Will Go Down! Short!
Please, check our technical outlook for EURUSD.
Time Frame: 3h
Current Trend: Bearish
Sentiment: Overbought (based on 7-period RSI)
Forecast: Bearish
The price is testing a key resistance 1.161.
Taking into consideration the current market trend & overbought RSI, chances will be high to see a bearish movement to the downside at least to 1.155 level.
P.S
Please, note that an oversold/overbought condition can last for a long time, and therefore being oversold/overbought doesn't mean a price rally will come soon, or at all.
Disclosure: I am part of Trade Nation's Influencer program and receive a monthly fee for using their TradingView charts in my analysis.
Like and subscribe and comment my ideas if you enjoy them!

GBPUSD SELLBy utilizing levels, historical patterns, , we can formulate a hypothesis that the market might follow a similar trajectory if bearish sentiment prevails.
NZDUSD Will Move Lower! Sell!
Here is our detailed technical review for NZDUSD.
Time Frame: 2h
Current Trend: Bearish
Sentiment: Overbought (based on 7-period RSI)
Forecast: Bearish
The market is trading around a solid horizontal structure 0.594.
The above observations make me that the market will inevitably achieve 0.592 level.
P.S
The term oversold refers to a condition where an asset has traded lower in price and has the potential for a price bounce.
Overbought refers to market scenarios where the instrument is traded considerably higher than its fair value. Overvaluation is caused by market sentiments when there is positive news.
Disclosure: I am part of Trade Nation's Influencer program and receive a monthly fee for using their TradingView charts in my analysis.
Like and subscribe and comment my ideas if you enjoy them!

GBPUSD Is Bearish! Short!
Take a look at our analysis for GBPUSD.
Time Frame: 1h
Current Trend: Bearish
Sentiment: Overbought (based on 7-period RSI)
Forecast: Bearish
The market is testing a major horizontal structure 1.341.
Taking into consideration the structure & trend analysis, I believe that the market will reach 1.338 level soon.
P.S
We determine oversold/overbought condition with RSI indicator.
When it drops below 30 - the market is considered to be oversold.
When it bounces above 70 - the market is considered to be overbought.
Disclosure: I am part of Trade Nation's Influencer program and receive a monthly fee for using their TradingView charts in my analysis.
Like and subscribe and comment my ideas if you enjoy them!

USDCHF long term bullish playHello,
The USDCHF is back to where it last traded in mid 2011. This reflects a significant weakening of the U.S. dollar against the Swiss franc, erasing over a decade of gains. It suggests growing investor demand for safe-haven assets like the franc — possibly driven by concerns around U.S. interest rate policy, inflation trends, or broader global uncertainty. The last time the dollar was this weak against the franc was more than 13 years ago.
While a weaker dollar is seen as good for the United States, we see a long term buy opportunity for this pair from the current level based on technical analysis. The pair is now trading at the bottom of the range.
Next week will be an important time for this pair as we wait for the inflation data. This will be key in guiding what the FED might do during the next meeting towards the end of the month.

GBPUSD ANALYSIS From the previous trading day we can see that the pair has been making random up and down movements without a clear direction and even though we rejected a key support area the higher timeframes like daily and weekly still show bearish sentiment right now the best move is to wait

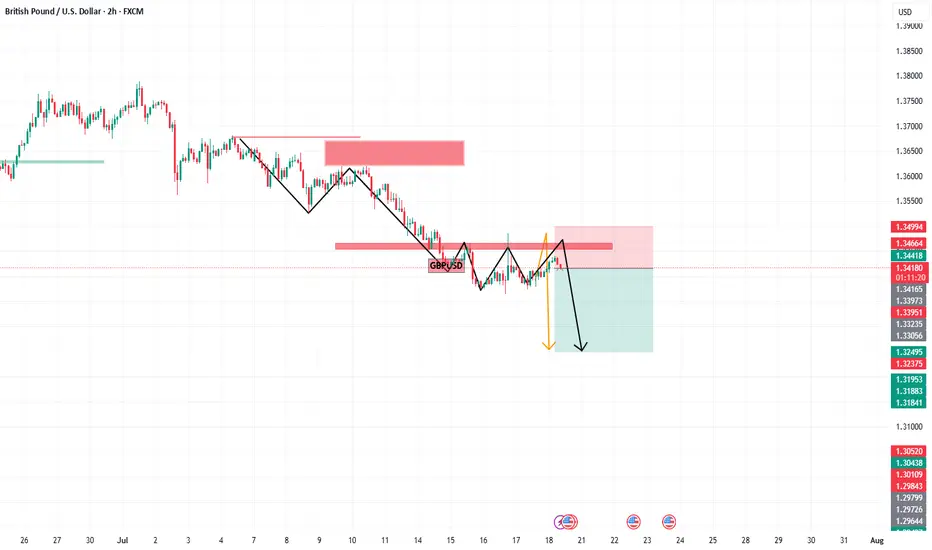
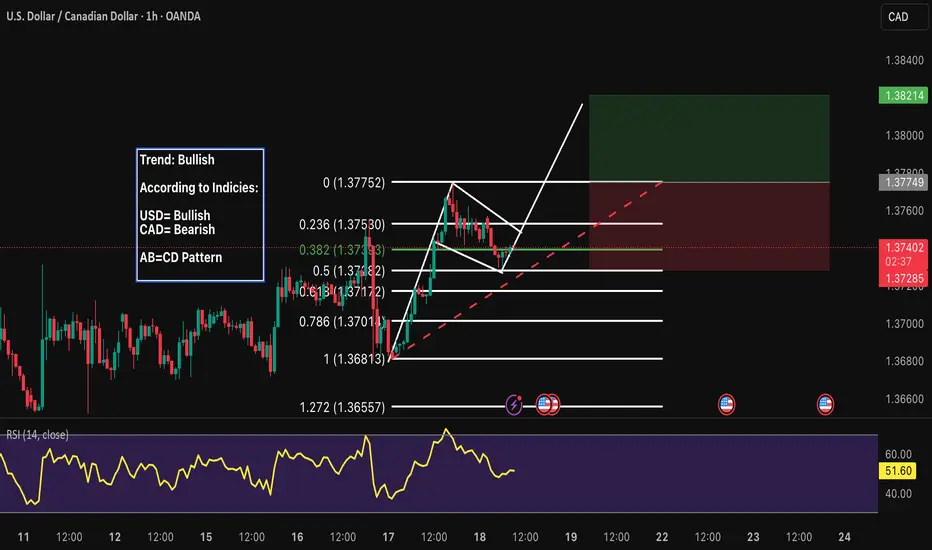
GBPUSD Trading The Gap # Revised GBP/USD London Session Bullish Setup
---
Market Context
- Price gapped up into the **breaker zone at 1.34160–1.34190, now acting as support.
- The Asian session rallied into the 0.25 **quadrant of the 4-hour wick** (not the daily range) before stalling and retracing.
- A buy-side imbalance (sell-side inefficiency) sits beneath that breaker, meaning liquidity is resting below the zone.
These factors set the stage for a **bullish reaction** once London session liquidity arrives.
-Trade Plan
1. Timeframes
- Entry: 15-minute chart
- Bias and structure: 1-hour and 4-hour charts
2. Reference Levels
- Breaker/imbalance zone: 1.34160–1.34190
- 4-hour wick high: ~1.34400
- Psychological level: 1.34500
3. Entry
- Wait for a pullback into 1.34180–1.34190.
- Confirm with a bullish price-action signal
4. Stop Loss
- Below the low of the imbalance zone.
5. Profit Targets
- T1: 4-hour wick high / Asian high at 1.34400
- T2: Psychological level at 1.34500
Execution Checklist
- Ensure London open shows bullish momentum (first 15-min close above zone).
- Check correlation: weak USD (DXY down) or EUR/USD strength adds confidence.
Ongoing Management
- Move stop to breakeven once T1 is hit.
- Scale out 25% at T1, let the remainder run to T2.
- If price closes below 1.34160 on a 15-minute chart, exit early to protect capital.

Buy EUR USD from Pivoton higher charts like 1D price seems in an uptrend so I would look to open a Long position
price is now correction to Monthly pivot line which could be good RR

EURUSD Will Go Lower! Sell!
Here is our detailed technical review for EURUSD.
Time Frame: 4h
Current Trend: Bearish
Sentiment: Overbought (based on 7-period RSI)
Forecast: Bearish
The market is approaching a significant resistance area 1.168.
Due to the fact that we see a positive bearish reaction from the underlined area, I strongly believe that sellers will manage to push the price all the way down to 1.159 level.
P.S
Please, note that an oversold/overbought condition can last for a long time, and therefore being oversold/overbought doesn't mean a price rally will come soon, or at all.
Disclosure: I am part of Trade Nation's Influencer program and receive a monthly fee for using their TradingView charts in my analysis.
Like and subscribe and comment my ideas if you enjoy them!

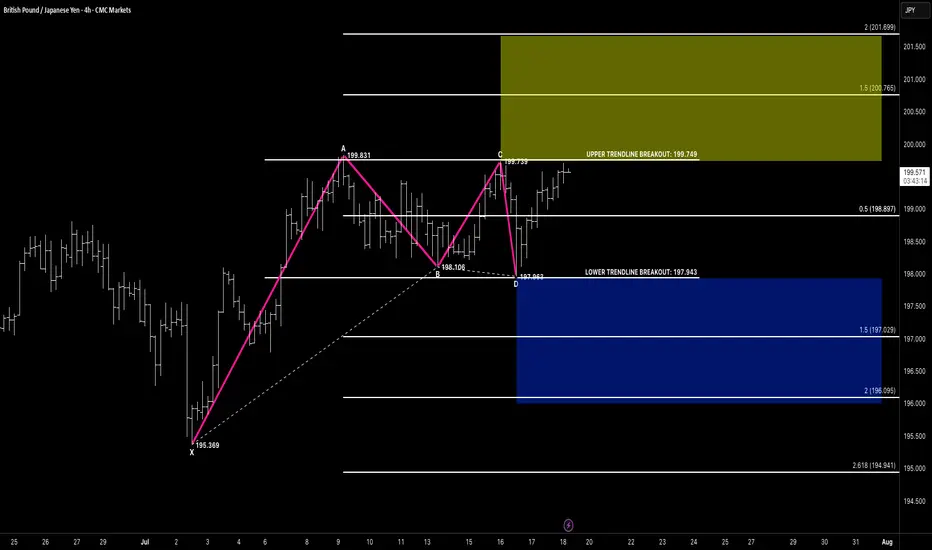
RECTANGLE CHANNELHello awesome traders! 👋
Hope you’ve managed to grab some solid pips from the markets this week. As we head into the weekend, I’m wrapping things up by dropping a few clean chart setups for you to review and reflect on.
Enjoy the weekend, recharge well — and I’ll see you sharp and ready next week for more structure-led opportunities.
📌 Pattern Breakdown
We’ve been tracking a developing rectangle channel between 197.94 (support) and 199.74 (resistance):
🔹 Price formed a clear 4-leg compression
🔹 CD leg bounced off lower support near 197.96
🔹 We’re now approaching the upper edge of the channel at 199.74
🔹 Compression structure suggests breakout potential is building
🚨 Breakout Setup in Focus
🔸 A breakout above 199.75 opens the door toward:
✅ Target 1 Zone:
• 1.5 extension = 200.76
✅ Target 2 Zone:
• 2.0 extension = 201.69
📌 Flip-side: A failed breakout and close back below 197.94 would shift structure toward:
🔻 Bearish Breakdown Targets:
• 1.5 = 197.02
• 2.0 = 196.09
• 2.618 = 194.94
We stay flexible — trade the breakout, not the anticipation.
🧠 Key Concepts in Play
✅ Rectangle consolidation
✅ Breakout-ready structure
✅ Defined upper/lower breakout levels
✅ Volume and reaction at edges = trigger
🗝 Final Thoughts
GBPJPY is boxed in tight — but momentum is clearly leaning bullish.
If we get that clean break above 199.75 with confirmation (volume, close, continuation), the 200.76+ range is firmly in sight. No breakout? No problem — structure has a plan either way.
“Boxes don’t trap the market — they build the tension. Breakouts reward the patient.”
EURJPY ANALYSISAfter seeing that the previous daily candle could not trade below the moving averages and had a retracement to the upside it will be a good idea to wait and see how the pair trades before executing in a specific direction

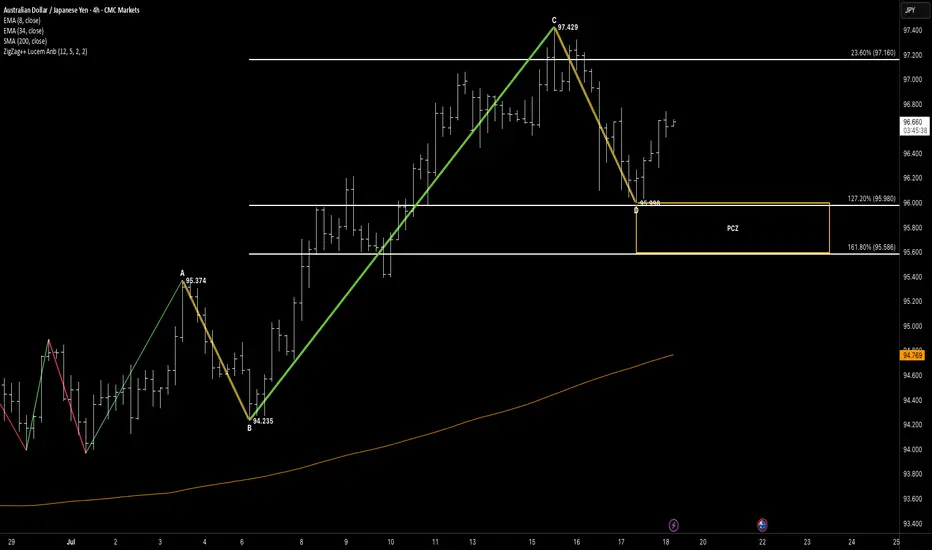
SYMMETRYHello awesome traders! 👋
Hope you’ve managed to grab some solid pips from the markets this week. As we head into the weekend, I’m wrapping things up by dropping a few clean chart setups for you to review and reflect on.
Enjoy the weekend, recharge well — and I’ll see you sharp and ready next week for more structure-led opportunities.
📌 Pattern Breakdown
We had a beautiful AB=CD symmetry setup, with a slight twist:
🔹 AB = CD structure extended slightly beyond traditional symmetry
🔹 CD stretched into the 127.2% fib projection — a known trap zone
🔹 Price tagged 95.980 and reacted with strong bullish momentum from the PCZ (95.98–95.58)
🔹 This zone also aligned with 161.8% fib extension support = strong confluence
🎯 Target Structure
Following the rejection, price is now rotating upward, moving toward:
✅ Target 1:
• 23.6% = 97.16
• 61.8% = 97.972
📍 Partial TP booked at 23.6%
🧭 Watching price behavior here before deciding whether to continue toward…
🔄 Target 2 Zone:
• 78.6% = 98.508
🧠 Key Concepts in Play
✅ AB=CD symmetry extended to 127.2%
✅ Valid PCZ rejection from confluence zone
✅ Partial profit taken at TP1
✅ Measured continuation play in motion
✅ Structure-led management with clear invalidation
🗝 Final Thoughts
AUDJPY gave us a clean extended symmetry rejection — and now we’re in the follow-through phase. The reaction off the 127% extension shows that even stretched patterns can hold when structure aligns.
We’ve locked some gains at the 23.6% zone and will let the rest play out or reassess early next week depending on price behavior around the 61.8% mark.
“Even when symmetry stretches — the reaction reveals the conviction.”
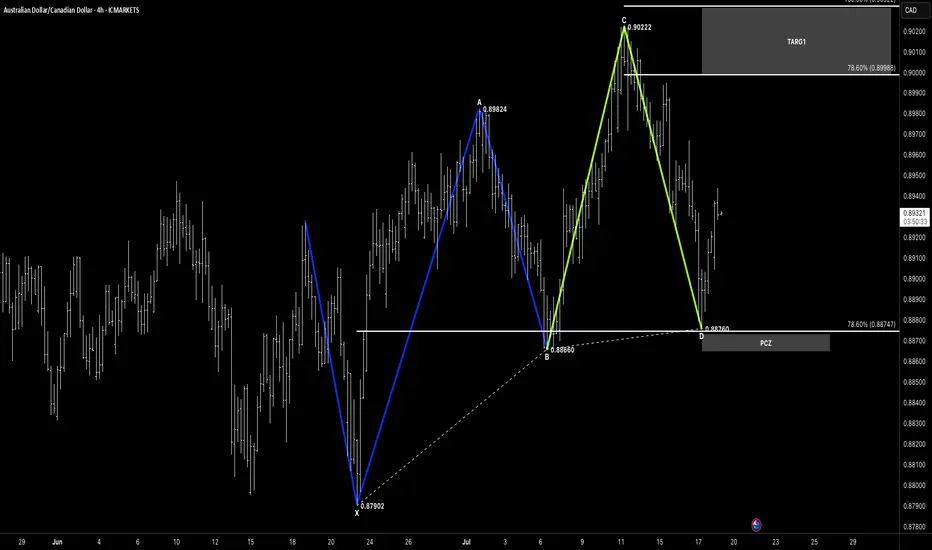
121Hello awesome traders! 👋
Hope you’ve managed to grab some solid pips from the markets this week. As we head into the weekend, I’m wrapping things up by dropping a few clean chart setups for you to review and reflect on.
Enjoy the weekend, recharge well — and I’ll see you sharp and ready next week for more structure-led opportunities.
📌 Pattern Breakdown
This one's a 1-2-1 Bullish Formation — clear, clean, and already reacting:
🔹 XA: 0.87902 → 0.89824
🔹 AB retracement → 0.88660
🔹 BC extension: 0.88660 → 0.90222
🔹 CD drops into the PCZ at 0.88760 — aligning with 78.6% retracement
We’ve now seen a clear bullish reaction off the PCZ, confirming it as a valid demand zone.
🎯 Targets Now in Play
With structure holding and price climbing from the PCZ:
✅ Target 1:
• 78.6% = 0.89988
• 100% = 0.90322
🔄 Target 2 (Extension):
• 78.6% = 0.90584
• 100% = 0.91080
We’ll keep managing toward Target 1, then reassess momentum and candle structure for continuation into Target 2 next week.
🧠 Key Concepts in Play
✅ 121 Bullish pattern
✅ Reaction at fib-based PCZ
✅ Controlled impulse off demand zone
✅ Target structure mapped + invalidation clearly below PCZ
🗝 Final Thoughts
Textbook measured move off the 1-2-1 setup, with price now rotating higher from structure.
This is what we look for every week — precision, confirmation, and opportunity.
Let’s protect gains, lock partials near Target 1, and come back Monday with a clear head.
“Structure gives you the zone — reaction gives you the trade.”
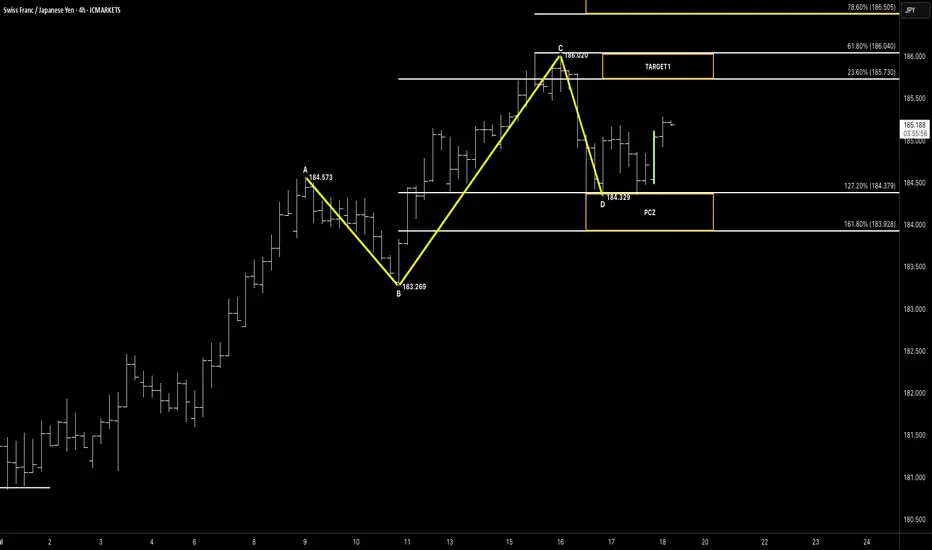
SYMMETRY
Hello awesome traders! 👋
Hope you’ve managed to grab some solid pips from the markets this week. As we head into the weekend, I’m wrapping things up by dropping a few clean chart setups for you to review and reflect on.
Enjoy the weekend, recharge well — and I’ll see you sharp and ready next week for more structure-led opportunities.
📌 Pattern Breakdown
This setup delivered exactly what we watch for:
🔹 Classic ABC structure with clean symmetry
🔹 CD leg completed directly into the Potential Completion Zone (PCZ)
• 127.2% BC = 184.379
• 161.8% BC = 183.928
🔹 Price tagged 184.329 and showed a strong, clean bullish rejection right from the zone
It’s a confirmation of intent — but the job’s not done just yet.
🎯 Next Levels in Focus
🚫 Target 1 has not yet been hit, but structure is holding well.
🎯 Target 1 Range: 185.73 – 186.04
🎯 Target 2 (extension): 186.50 – 187.10
As we head into close, this becomes a management decision:
🔸 Let partials run if you’re in
🔸 Stay flat if you missed entry — wait for next week’s confirmation or pullback opportunity
🧠 Key Concepts in Play
✅ Symmetry-based ABC pattern
✅ PCZ precision and confirmed bullish rejection
✅ Momentum building, but still below TP1
✅ Structure-based trade with defined targets and invalidation
🗝 Final Thoughts
This is a textbook end-of-week setup: clean structure, clear reaction, and patience now required.
Don’t force the next move — we’ve got rejection confirmation, now we let price follow through.
Target 1 is well-defined — and price is on its way. We'll reassess early next week for continuation toward the higher fib extensions.
“Rejection starts the move — but discipline finishes the trade.”
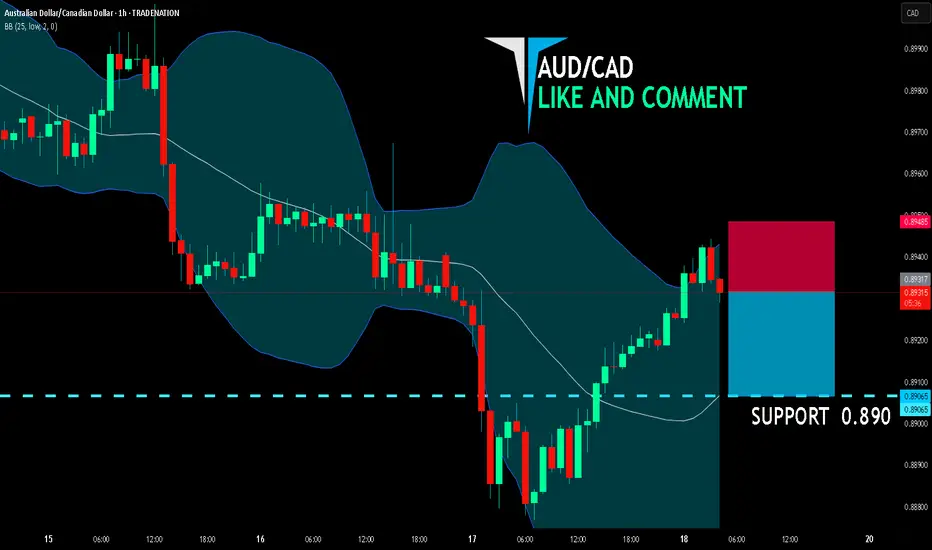
AUD/CAD BEARISH BIAS RIGHT NOW| SHORT
AUD/CAD SIGNAL
Trade Direction: short
Entry Level: 0.893
Target Level: 0.890
Stop Loss: 0.894
RISK PROFILE
Risk level: medium
Suggested risk: 1%
Timeframe: 1h
Disclosure: I am part of Trade Nation's Influencer program and receive a monthly fee for using their TradingView charts in my analysis.
✅LIKE AND COMMENT MY IDEAS✅
CHF/JPY BEST PLACE TO SELL FROM|SHORT
Hello, Friends!
CHF/JPY pair is in the uptrend because previous week’s candle is green, while the price is evidently rising on the 2H timeframe. And after the retest of the resistance line above I believe we will see a move down towards the target below at 184.005 because the pair overbought due to its proximity to the upper BB band and a bearish correction is likely.
Disclosure: I am part of Trade Nation's Influencer program and receive a monthly fee for using their TradingView charts in my analysis.
✅LIKE AND COMMENT MY IDEAS✅

USDJPY INTRADY OPPORTUNITY Hello traders , here is the full multi time frame analysis for this pair, let me know in the comment section below if you have any questions , the entry will be taken only if all rules of the strategies will be satisfied. wait for more price action to develop before taking any position. I suggest you keep this pair on your watchlist and see if the rules of your strategy are satisfied.
🧠💡 Share your unique analysis, thoughts, and ideas in the comments section below. I'm excited to hear your perspective on this pair .
💭🔍 Don't hesitate to comment if you have any questions or queries regarding this analysis.

USD/JPY(20250718)Today's AnalysisMarket news:
① Kugler: It is appropriate to keep the interest rate policy stable for "a while".
② Daly: Whether to cut interest rates in July or September is not the most critical.
③ Bostic: It may be difficult to cut interest rates in the short term.
Technical analysis:
Today's buying and selling boundaries:
148.45
Support and resistance levels:
149.80
149.30
148.97
147.93
147.61
147.10
Trading strategy:
If the price breaks through 148.97, consider buying in, the first target price is 149.30
If the price breaks through 148.45, consider selling in, the first target price is 147.93

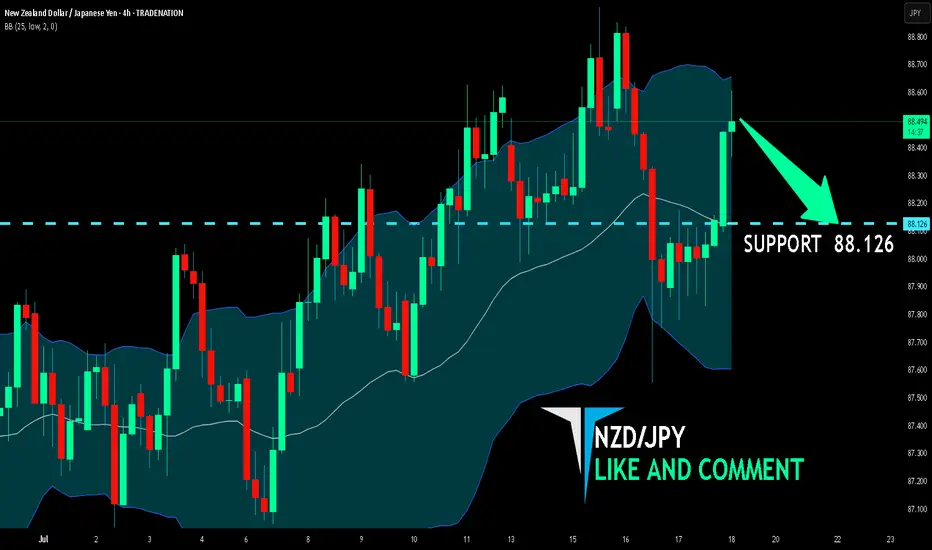
NZD/JPY BEARS ARE STRONG HERE|SHORT
Hello, Friends!
NZD/JPY pair is trading in a local uptrend which we know by looking at the previous 1W candle which is green. On the 4H timeframe the pair is going up too. The pair is overbought because the price is close to the upper band of the BB indicator. So we are looking to sell the pair with the upper BB line acting as resistance. The next target is 88.126 area.
Disclosure: I am part of Trade Nation's Influencer program and receive a monthly fee for using their TradingView charts in my analysis.
✅LIKE AND COMMENT MY IDEAS✅
USD/CAD(20250718)Today's AnalysisMarket news:
① Kugler: It is appropriate to keep the interest rate policy stable for "a while".
② Daly: Whether to cut interest rates in July or September is not the most critical.
③ Bostic: It may be difficult to cut interest rates in the short term.
Technical analysis:
Today's buying and selling boundaries:
1.3735
Support and resistance levels:
1.3827
1.3792
1.3770
1.3700
1.3678
1.3644
Trading strategy:
If it breaks through 1.3770, consider buying in, the first target price is 1.3792
If it breaks through 1.3735, consider selling in, the first target price is 1.3700

NZD/USD SELLERS WILL DOMINATE THE MARKET|SHORT
NZD/USD SIGNAL
Trade Direction: short
Entry Level: 0.607
Target Level: 0.592
Stop Loss: 0.617
RISK PROFILE
Risk level: medium
Suggested risk: 1%
Timeframe: 1D
Disclosure: I am part of Trade Nation's Influencer program and receive a monthly fee for using their TradingView charts in my analysis.
✅LIKE AND COMMENT MY IDEAS✅
