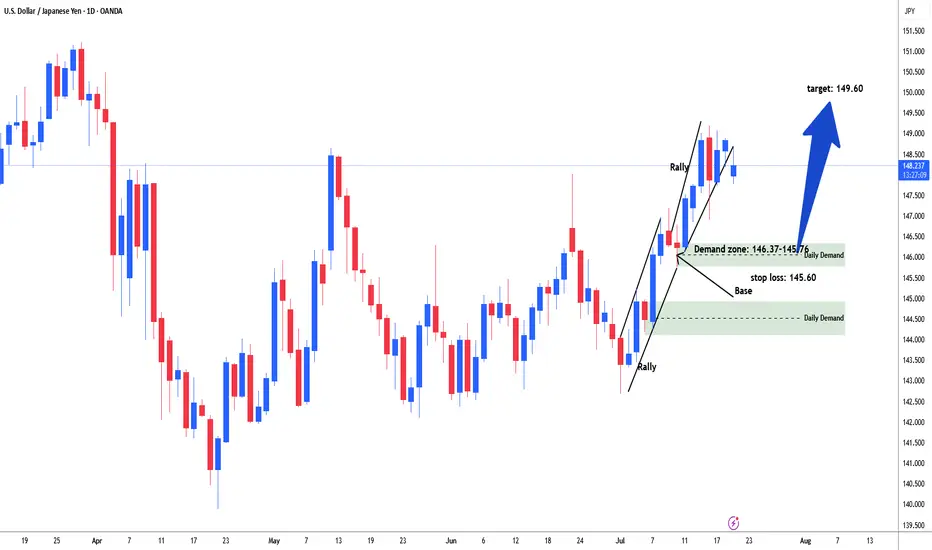
USDJPY Possible long for 149.60#usdjpy started rally from the start of the month of July. Price consolidate in range between 142.85-10. Then started rally. price again consolidate in range between 147.15-145.76 area. Market build energy and institutional add further longs and broke above the daily resistance line 148.60. Need to sell off / retracement to test demand zone range 146.37-145.78 area to test and filled remaining institutional orders for long. Buying area 146.37-145.76. stop loss: 145.60. Target: 149.60
Forex market
EURUSD – Preparing For Potential Volatility AheadThe week ahead has all the elements to be a volatile one for EURUSD traders to navigate. First, the unwind of long positions that has been on-going throughout July, since prices hit a 4 year high at 1.1830 on July 1st may have potentially found a short-term base after rebounding last week from printing a low of 1.1556 on Thursday. More on this in the technical section below.
Secondly, Bloomberg reported over the weekend that negotiations to agree a trade deal between the US and EU are proving to be more challenging than initially hoped. This leaves room for market moving headlines on this topic, or social media posts from President Trump that could influence the direction of FX markets, especially if it shifts trader expectations towards preparing for the prospect of a trade war between these two global economic heavyweights.
Then on Thursday, consideration needs to be given to the ECB interest rate decision (1315 BST) and then the press conference led by ECB President Lagarde, which starts at 1345 BST. After eight consecutive rate cuts at their previous meetings, the European Central Bank are expected to take a pause to assess incoming inflation and growth data, so this outcome would probably not be a surprise. However, the comments of Madame Lagarde in the press conference could increase EURUSD volatility given that there is some uncertainty surrounding whether a further rate cut is possible either in September, or later in the year.
Technical Update: Limited Price Correction or Reversal?
We all know well, even if an asset is trading within a positive uptrend, periods of price weakness can materialise, before fresh buying support develops. This can lead to renewed price strength that manages to break and close above a previous high, leading to an extension of a pattern of higher price highs and higher price lows.
Having been capped by the July 1st high at 1.1830, EURUSD has seen a price correction develop. Traders may be trying to decide if this is a limited move lower before fresh price strength is seen, or if it could be a price reversal, which may result in risks of a more extended phase of price weakness.
Much will depend on the outcome of the risk events outlined above, as well as future market sentiment and price trends, however it is possible to assess what may be the important support and resistance levels that traders could focus on to help gauge the next direction of price activity
Potential Support Levels:
After a period of price strength, it can be useful to calculate Fibonacci retracements on the latest up move to identify areas of potential support. As the chart below shows, for EURUSD, the latest phase of price strength seen from 1.1065 the May 12th low up to 1.1830, the July 1st high can be used for this purpose.
The 38% retracement of this advance stands at 1.1539 and after having remained intact during last week’s sell off, traders may now be watching how this support level performs on a closing basis.
Breaks below 1.1539, while not a guarantee of further price declines, may then lead to a deeper phase of weakness towards 1.1446, the June 19th low, even 1.1356, which is equal to the lower 61.8% retracement level.
Potential Resistance Levels:
If the 38% retracement support at 1.1539 holds any future price weakness in the week ahead, a positive trending condition may still be in place, opening the possibility of EURUSD moving back to higher levels again.
Any potential upside move could bring 1.1690 into play as an important resistance. This is the current level of the Bollinger mid-average, with closing breaks above this needed to open retests of 1.1830 July 1st highs, maybe further if this is in turn broken.
The material provided here has not been prepared accordance with legal requirements designed to promote the independence of investment research and as such is considered to be a marketing communication. Whilst it is not subject to any prohibition on dealing ahead of the dissemination of investment research, we will not seek to take any advantage before providing it to our clients.
Pepperstone doesn’t represent that the material provided here is accurate, current or complete, and therefore shouldn’t be relied upon as such. The information, whether from a third party or not, isn’t to be considered as a recommendation; or an offer to buy or sell; or the solicitation of an offer to buy or sell any security, financial product or instrument; or to participate in any particular trading strategy. It does not take into account readers’ financial situation or investment objectives. We advise any readers of this content to seek their own advice. Without the approval of Pepperstone, reproduction or redistribution of this information isn’t permitted.

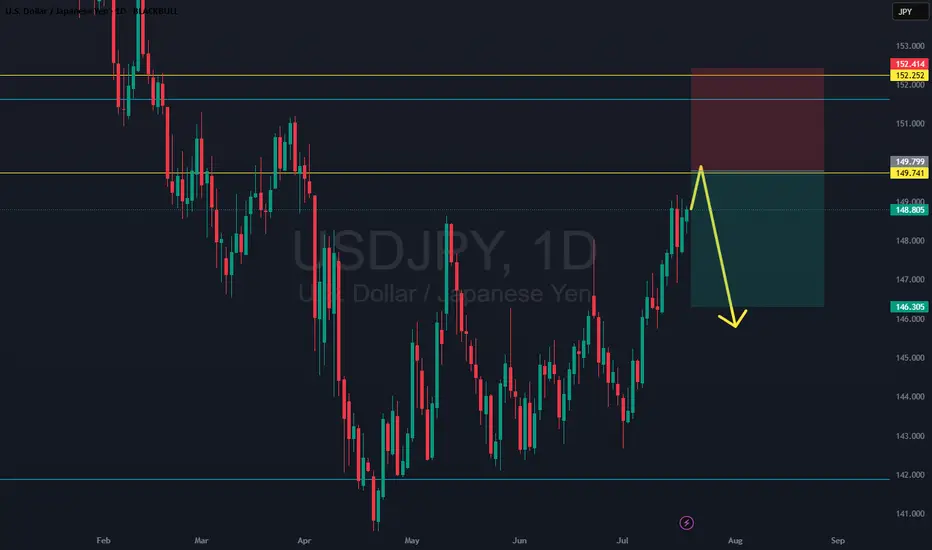
USDJPY: Range-on-Range SetupUSDJPY remains in a broader uptrend but has recently stalled after breaking out of multiple ranges. This setup targets a short-term move as price attempts to test the top of a lower timeframe range—likely the daily. We're trading within nested ranges here, looking to catch a small piece of the move before higher timeframe resistance steps in.
USDJPY Q3 | D21 | W30 | Y25 15' OB UPDATE 📊USDJPY Q3 | D21 | W30 | Y25 15' OB UPDATE
Daily Forecast 🔍📅
Here’s a short diagnosis of the current chart setup 🧠📈
Higher time frame order blocks have been identified — these are our patient points of interest 🎯🧭.
It’s crucial to wait for a confirmed break of structure 🧱✅ before forming a directional bias.
This keeps us disciplined and aligned with what price action is truly telling us.
📈 Risk Management Protocols
🔑 Core principles:
Max 1% risk per trade
Only execute at pre-identified levels
Use alerts, not emotion
Stick to your RR plan — minimum 1:2
🧠 You’re not paid for how many trades you take, you’re paid for how well you manage risk.
🧠 Weekly FRGNT Insight
"Trade what the market gives, not what your ego wants."
Stay mechanical. Stay focused. Let the probabilities work.
FRGNT 📊

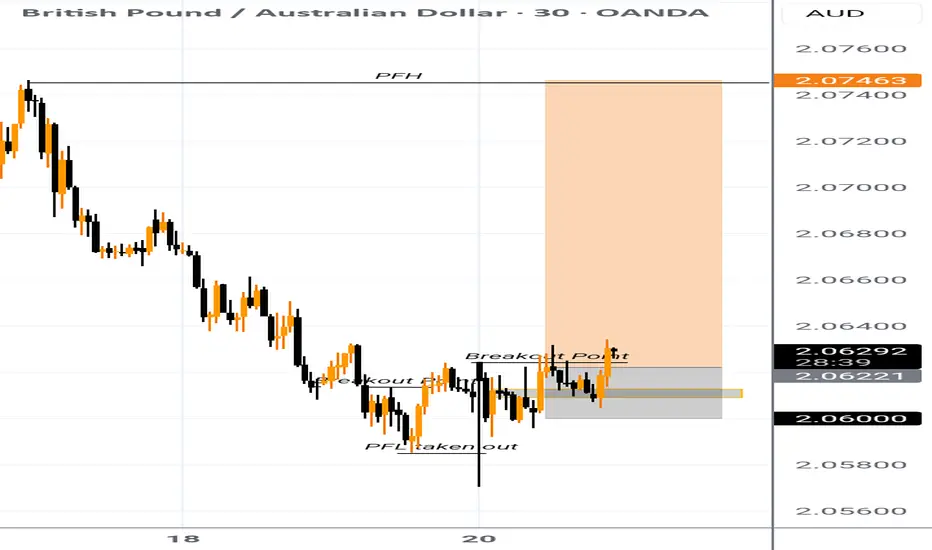
GBPAUD Buy swing setPrice has broken out new zone, we expect bullish continuation to the peak formation high as it aligns with the higher time frame bullish momentum
GBPCAD Q3 | D21 | W30 | Y25📊GBPCAD Q3 | D21 | W30 | Y25
Daily Forecast 🔍📅
Here’s a short diagnosis of the current chart setup 🧠📈
Higher time frame order blocks have been identified — these are our patient points of interest 🎯🧭.
It’s crucial to wait for a confirmed break of structure 🧱✅ before forming a directional bias.
This keeps us disciplined and aligned with what price action is truly telling us.
📈 Risk Management Protocols
🔑 Core principles:
Max 1% risk per trade
Only execute at pre-identified levels
Use alerts, not emotion
Stick to your RR plan — minimum 1:2
🧠 You’re not paid for how many trades you take, you’re paid for how well you manage risk.
🧠 Weekly FRGNT Insight
"Trade what the market gives, not what your ego wants."
Stay mechanical. Stay focused. Let the probabilities work.
FRGNT 📊

EURUAD is in the Buy directionHello Traders
In This Chart EUR/AUD 4 HOURLY Forex Forecast By FOREX PLANET
today EUR/AUD analysis 👆
🟢This Chart includes_ (EUR/AUD market update)
🟢What is The Next Opportunity on EUR/AUD Market
🟢how to Enter to the Valid Entry With Assurance Profit
This CHART is For Trader's that Want to Improve Their Technical Analysis Skills and Their Trading By Understanding How To Analyze The Market Using Multiple Timeframes and Understanding The Bigger Picture on the Charts

USDJPY Q3 | D21 | W30 | Y25📊USDJPY Q3 | D21 | W30 | Y25
Daily Forecast 🔍📅
Here’s a short diagnosis of the current chart setup 🧠📈
Higher time frame order blocks have been identified — these are our patient points of interest 🎯🧭.
It’s crucial to wait for a confirmed break of structure 🧱✅ before forming a directional bias.
This keeps us disciplined and aligned with what price action is truly telling us.
📈 Risk Management Protocols
🔑 Core principles:
Max 1% risk per trade
Only execute at pre-identified levels
Use alerts, not emotion
Stick to your RR plan — minimum 1:2
🧠 You’re not paid for how many trades you take, you’re paid for how well you manage risk.
🧠 Weekly FRGNT Insight
"Trade what the market gives, not what your ego wants."
Stay mechanical. Stay focused. Let the probabilities work.
FRGNT 📊

EURUSD Q3 | D21 | W30 | Y25 📊EURUSD Q3 | D21 | W30 | Y25
Daily Forecast 🔍📅
Here’s a short diagnosis of the current chart setup 🧠📈
Higher time frame order blocks have been identified — these are our patient points of interest 🎯🧭.
It’s crucial to wait for a confirmed break of structure 🧱✅ before forming a directional bias.
This keeps us disciplined and aligned with what price action is truly telling us.
📈 Risk Management Protocols
🔑 Core principles:
Max 1% risk per trade
Only execute at pre-identified levels
Use alerts, not emotion
Stick to your RR plan — minimum 1:2
🧠 You’re not paid for how many trades you take, you’re paid for how well you manage risk.
🧠 Weekly FRGNT Insight
"Trade what the market gives, not what your ego wants."
Stay mechanical. Stay focused. Let the probabilities work.
FRGNT 📊

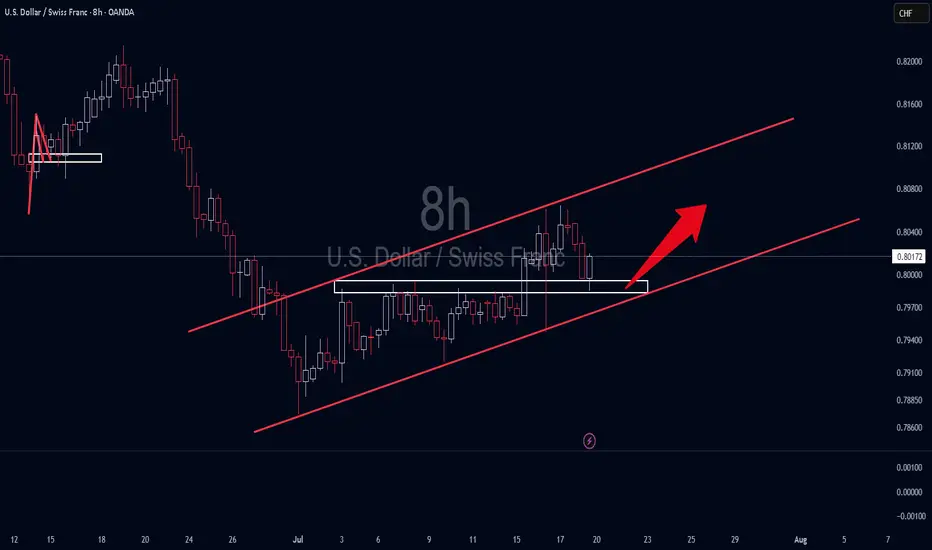
USD CHF LONGOK, Just two trades to start the week, if we have some profit tonight, lets see tomorrow,whats the markes show us

Eurusd changing trendPrepeair Ur selv to see euro against US dollar with a kinda big or minimum huge profit, going 2 cents above, from 1.1620 to 1.1840, ofc this is only in my POV.
Keep Ur investment safe and use lways a stop loss under wht you can lose, and I don't mean this trade, but all I mean, is that it need to be after Ur analista and Ur own Point of View.
Keep Ur trade simple
Abd do your own research, always.

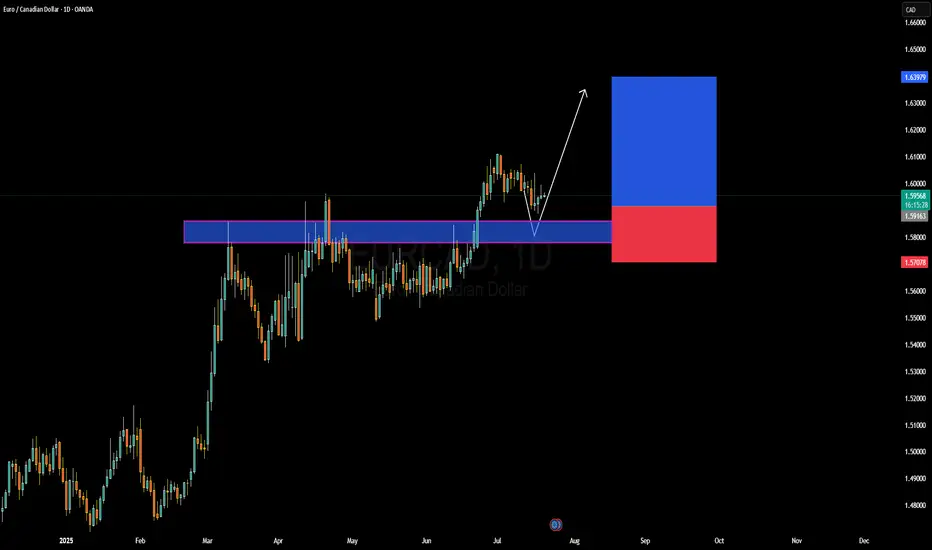
EURCAD Forming Bullish ContinuationEURCAD has recently respected a key demand zone and is now beginning to show early signs of bullish continuation. After a clean breakout above the 1.5900 resistance level earlier this month, price retested this structure and held strongly, creating a textbook bullish rejection wick. This price behavior suggests the pair is gearing up for another impulsive leg to the upside. I'm watching for follow-through momentum targeting the 1.6390–1.6400 zone in the coming weeks, aligning with the risk-to-reward setup visible on the chart.
From a fundamental perspective, the euro remains relatively supported following recent ECB comments signaling a more patient stance on future rate cuts. While inflation in the Eurozone has shown some signs of easing, policymakers remain cautious, especially with energy prices fluctuating again. On the other side, the Canadian dollar has been under pressure due to weaker-than-expected domestic growth and the Bank of Canada’s more dovish tone. Crude oil, which typically supports CAD, has been consolidating with no strong bullish drive lately, limiting CAD’s upside potential.
Technically, the current structure favors bullish continuation. The clean rejection from the previous resistance-turned-support, combined with bullish price action forming a higher low, reinforces the bullish setup. As long as the 1.5900 zone holds, this remains a high-probability long trade setup with potential to deliver strong profits in alignment with the trend.
Watch for daily closures above 1.6000 to confirm the next leg higher. Momentum indicators are flattening, and with liquidity sweeping both sides recently, it’s primed for a move. EURCAD remains on my radar for a swing buy opportunity, with the setup offering excellent technical confluence and favorable fundamental backing.
Watch out for EURUSDEURUSD continues to move sideways above the support zone.
This week, the key event is the ECB’s interest rate decision.
Keep an eye on whether there's enough momentum for a breakout above 1,1720.
If it gets rejected again, we might see a deeper correction.

EURJPY 4Hour TF - July 20th, 2025EURJPY 7/20/2025
EURJPY 4hour Bullish Idea
Monthly - Bullish
Weekly - Bullish
Daily - Bullish
4hour - Bullish
Bullish Continuation - This is the most likely scenario for EJ this week as nothing suggests anything other than Bullish activity.
EJ could take off right at market open and start pushing up without giving us a retest to enter on. If we do get some sort of retest or pullback, look for rejection as close to 172.400 as possible before looking long.
If this does execute it looks like it will be a very small window of opportunity to enter. Trade cautiously with EJ in this bullish scenario.
Bearish Reversal - This scenario is less likely but is much more favorable in my opinion.
For us to consider EJ bearish we would need to see a clear break below 172.400 with a lower high below. This would give us enough confidence to consider short scenarios and start looking lower toward major support levels like 170.750.

EURUSD M15 I Bearish Reversal Based on the M15 chart, the price could rise toward our sell entry level at 1.1641, a pullback resistance.
Our take profit is set at 1.1604, a pullback support that aligns closely with the 62.8% Fib retracement.
The stop loss is set at 1.1670, an overlap resistance.
High Risk Investment Warning
Trading Forex/CFDs on margin carries a high level of risk and may not be suitable for all investors. Leverage can work against you.
Stratos Markets Limited (tradu.com ):
CFDs are complex instruments and come with a high risk of losing money rapidly due to leverage. 66% of retail investor accounts lose money when trading CFDs with this provider. You should consider whether you understand how CFDs work and whether you can afford to take the high risk of losing your money.
Stratos Europe Ltd (tradu.com ):
CFDs are complex instruments and come with a high risk of losing money rapidly due to leverage. 66% of retail investor accounts lose money when trading CFDs with this provider. You should consider whether you understand how CFDs work and whether you can afford to take the high risk of losing your money.
Stratos Global LLC (tradu.com ):
Losses can exceed deposits.
Please be advised that the information presented on TradingView is provided to Tradu (‘Company’, ‘we’) by a third-party provider (‘TFA Global Pte Ltd’). Please be reminded that you are solely responsible for the trading decisions on your account. There is a very high degree of risk involved in trading. Any information and/or content is intended entirely for research, educational and informational purposes only and does not constitute investment or consultation advice or investment strategy. The information is not tailored to the investment needs of any specific person and therefore does not involve a consideration of any of the investment objectives, financial situation or needs of any viewer that may receive it. Kindly also note that past performance is not a reliable indicator of future results. Actual results may differ materially from those anticipated in forward-looking or past performance statements. We assume no liability as to the accuracy or completeness of any of the information and/or content provided herein and the Company cannot be held responsible for any omission, mistake nor for any loss or damage including without limitation to any loss of profit which may arise from reliance on any information supplied by TFA Global Pte Ltd.
The speaker(s) is neither an employee, agent nor representative of Tradu and is therefore acting independently. The opinions given are their own, constitute general market commentary, and do not constitute the opinion or advice of Tradu or any form of personal or investment advice. Tradu neither endorses nor guarantees offerings of third-party speakers, nor is Tradu responsible for the content, veracity or opinions of third-party speakers, presenters or participants.

GBPUSD M15 I Bearish Reversal Based on the M15 chart, the price could rise toward our sell entry level at 1.3437, a pullback resistance.
Our take profit is set at 1.3377, an overlap support that aligns closely with the 161.8% Fib extension
The stop loss is set at 1.3484, a swing high resistance.
High Risk Investment Warning
Trading Forex/CFDs on margin carries a high level of risk and may not be suitable for all investors. Leverage can work against you.
Stratos Markets Limited (tradu.com ):
CFDs are complex instruments and come with a high risk of losing money rapidly due to leverage. 66% of retail investor accounts lose money when trading CFDs with this provider. You should consider whether you understand how CFDs work and whether you can afford to take the high risk of losing your money.
Stratos Europe Ltd (tradu.com ):
CFDs are complex instruments and come with a high risk of losing money rapidly due to leverage. 66% of retail investor accounts lose money when trading CFDs with this provider. You should consider whether you understand how CFDs work and whether you can afford to take the high risk of losing your money.
Stratos Global LLC (tradu.com ):
Losses can exceed deposits.
Please be advised that the information presented on TradingView is provided to Tradu (‘Company’, ‘we’) by a third-party provider (‘TFA Global Pte Ltd’). Please be reminded that you are solely responsible for the trading decisions on your account. There is a very high degree of risk involved in trading. Any information and/or content is intended entirely for research, educational and informational purposes only and does not constitute investment or consultation advice or investment strategy. The information is not tailored to the investment needs of any specific person and therefore does not involve a consideration of any of the investment objectives, financial situation or needs of any viewer that may receive it. Kindly also note that past performance is not a reliable indicator of future results. Actual results may differ materially from those anticipated in forward-looking or past performance statements. We assume no liability as to the accuracy or completeness of any of the information and/or content provided herein and the Company cannot be held responsible for any omission, mistake nor for any loss or damage including without limitation to any loss of profit which may arise from reliance on any information supplied by TFA Global Pte Ltd.
The speaker(s) is neither an employee, agent nor representative of Tradu and is therefore acting independently. The opinions given are their own, constitute general market commentary, and do not constitute the opinion or advice of Tradu or any form of personal or investment advice. Tradu neither endorses nor guarantees offerings of third-party speakers, nor is Tradu responsible for the content, veracity or opinions of third-party speakers, presenters or participants.

EURUSD BUY SETUPEURUSD has touched our sloping support trendline and support zone , ITS still in an uptrend it just came for retest . so our expectations is that we might see it going up since it has tested the major zone but we stay watch on what's going to follow next .

USD/CHF LongPrice broke structure and retraced back to a major support area that was resistance in the past the bulls are stepping in this week.
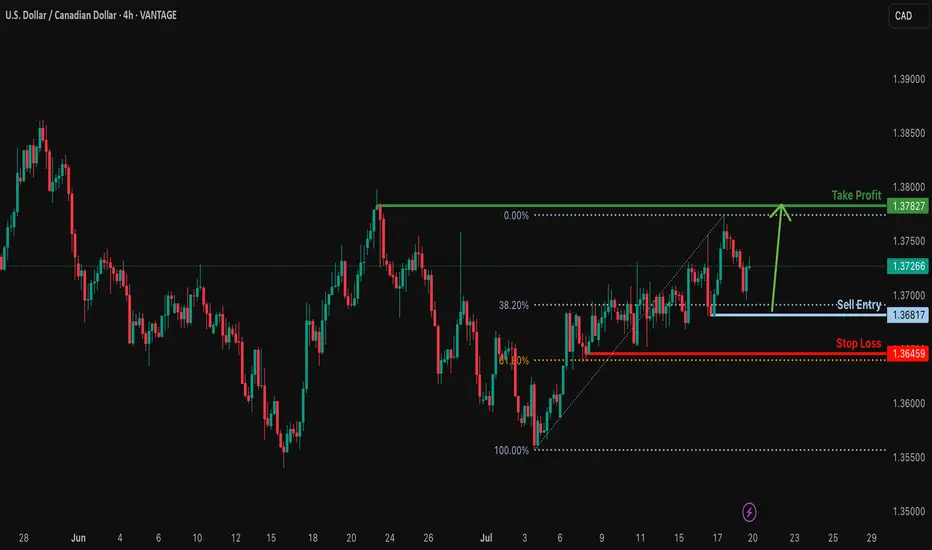
Bullish bounce off pullback support?USD/CAD is falling towards the support level which is a pullback support that lines up with the 38.2% Fibonacci retracement and could bounce from this level to our take profit.
Entry: 1.3681
Why we like it:
There is a pullback support level that aligns with the 38.2% Fibonacci retracement.
Stop loss: 1.3645
Why we like it:
There is a pullback support that lines up with the 61.8% Fibonacci retracement.
Take profit: 1.3782
Why we like it:
There is a pullback resistance.
Enjoying your TradingView experience? Review us!
Please be advised that the information presented on TradingView is provided to Vantage (‘Vantage Global Limited’, ‘we’) by a third-party provider (‘Everest Fortune Group’). Please be reminded that you are solely responsible for the trading decisions on your account. There is a very high degree of risk involved in trading. Any information and/or content is intended entirely for research, educational and informational purposes only and does not constitute investment or consultation advice or investment strategy. The information is not tailored to the investment needs of any specific person and therefore does not involve a consideration of any of the investment objectives, financial situation or needs of any viewer that may receive it. Kindly also note that past performance is not a reliable indicator of future results. Actual results may differ materially from those anticipated in forward-looking or past performance statements. We assume no liability as to the accuracy or completeness of any of the information and/or content provided herein and the Company cannot be held responsible for any omission, mistake nor for any loss or damage including without limitation to any loss of profit which may arise from reliance on any information supplied by Everest Fortune Group.
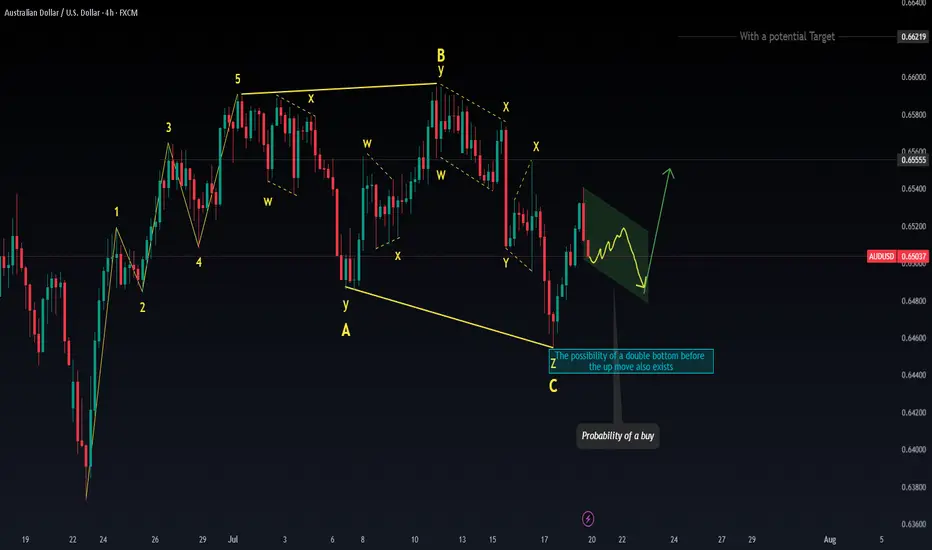
Audnzd buy Audnzd is looking rdy for recoil back north , current pullback is landing in a poi buy area, the current trend is up and we should be looking for potential buy signals around here . Stay vigilant here

NZDCAD bearish continuatiuonPrice was consolidating in the last 2 months, now it finally broke the level and got the retest waiting for a beutiful Bearsih Engulfing 30M,1H,2H to enter this trade.
very clear trade for me this week, it has to start now the downtrend.
---
### 🔎 **Multi‑timeframe Bias**
* **Weekly:** Bullish (but higher‑timeframe bullishness often takes longer to play out; intraday moves can still be bearish).
* **Daily:** Bearish
* **12H:** Bearish
* **6H:** Bearish
* **4H:** Bearish
✅ **Result:** 80% of your major timeframes are **aligned bearish**, giving you strong confluence to look for sells rather than buys.
---
### 📉 **Structure and Price Action**
* **Market Structure:**
Price is making **lower highs and lower lows** on the 4H and 1H timeframes, which confirms a **downtrend** in the short/medium term.
* **Current Zone:**
Price is currently reacting from a **Weekly Area of Interest (AOI)**, a previous support now acting as resistance.
* **Bearish Rejection:**
The recent move up into the AOI has been rejected, shown by the price failing to break above the resistance zone and starting to turn down.
---
### 📊 **Moving Averages**
* **50 EMA (blue) is below the 200 EMA (red):** classic bearish alignment.
* Price is currently **under the 200 EMA** and testing the 50 EMA from above — if it breaks back below, this often signals momentum returning to the downside.
---
### 📐 **Risk‑Reward and Setup**
* You’ve marked a **short entry** from the AOI, with:
* **Stop Loss** above the resistance zone (red area)
* **Take Profit** targeting lower liquidity levels (green area near 0.8110)
* The projected move matches the dominant trend direction, increasing probability.

I'm looking for potential buy setups after a consolidation.Those who are passionate about trading know that this is a tough business. What you have to understand is that the predictions people are making regarding the price movement directions are based on probabilities. There is no such thing as 100 percent direction in the market, and that is because the market can turn against you or your direction at any time it wants. The reason doesn't even matter; it could be the news of some geopolitical changes, oil cut production or war, or many other factors that could impact the financial market. If you have one or more good reasons that the price will follow a certain direction, all you have to do is take a small risk entry in your direction with a good risk-to-reward ratio and just wait and see how the market will perform. A trader could have 1 good reason or a few reasons why his bias is up or down. The reasons could be based on particular studies, past behavior, fundamentals, technical analysis, or certain observations. The important part for you to understand is that the market is in a continuously changing process; this means that yesterday's prediction, today, could be irrelevant. The market does not have to follow your analysis. You have to follow the market, observe its changes, and react accordingly to them! I hope some of you will find this helpful. Good luck!
EURUSDThis is the EURUSD 1H chart showing a potential bullish setup. Here’s a breakdown of your market structure and what you can do:
Observations:
1. Trendline Support: Price is respecting a daily trendline, which shows potential for upward continuation.
2. Order Block: Price has tapped into a clear order block zone, indicating institutional interest and potential for a reversal.
3. BOS (Break of Structure) & CHoCH (Change of Character): Previous BOS confirms downward movement, but recent CHoCH suggests a possible shift to bullish momentum.
4. Bullish Projection: Your markup shows a forecasted bullish leg with a minor pullback before continuation.
What to do:
- Entry: Wait for a confirmation candle (bullish engulfing or strong rejection wick) within or just above the order block to go long.
- Stop Loss: Place it just below the order block or trendline for safety.
- Take Profit: You can scale out at recent highs or follow price using trailing stops. Consider targeting previous supply zones for partial exits.
