GBPJPY - Bullish Continuation Setup• Pair: GBPJPY
• Bias: Bullish (Buy)
• HTF Overview (4H):
• Strong bullish momentum with clear breaks to the upside.
• No signs of price reaching deeper 4H SSL — continuation more likely.
• MTF Refinement (30M):
• Watching for price to mitigate lower 30M OB zone.
• Expecting bullish continuation from that area.
• Entry Zone:
• Wait for LTF confirmation inside 30M OB.
• Switch to trader mode after valid CHoCH / intent confirmation.
• Targets:
• Structure highs / clean extension into the next liquidity pool.
• Mindset Note:
• Be patient, trust bullish structure. Let price come to you.
Bless Trading!
Forex market

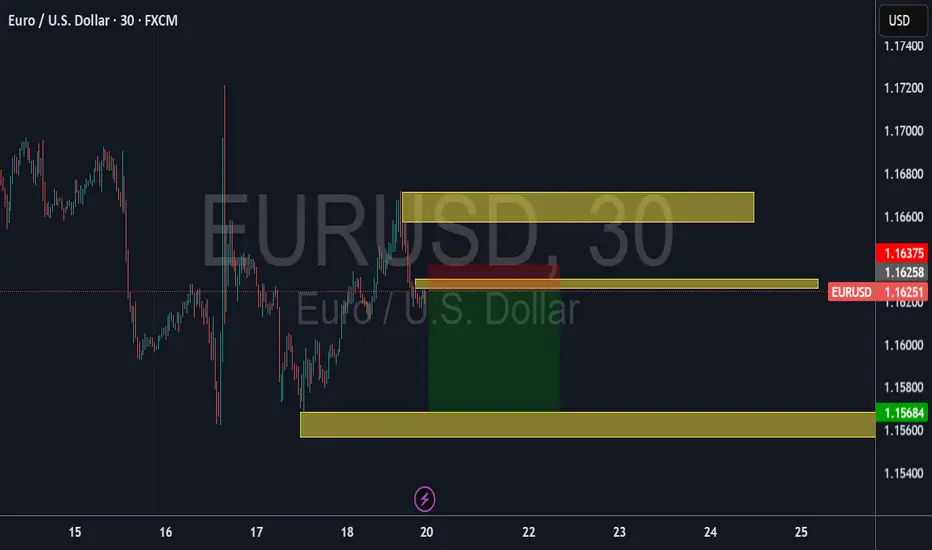
Am selling........Currency Pair: Euro / U.S. Dollar (EUR/USD)
Timeframe: 30-minute intervals (H1)
Data Source: FXCM
Price Data:
Open: 1.16265
High: 1.16275
Low: 1.16189
Close: 1.16251
Change: -0.00014 (-0.01%)
Price Levels:
The chart displays price levels ranging from 1.17400 (highest) to 1.15400 (lowest), with the current price near 1.16251.
Notable levels include 1.16258 (near the close) and 1.15684 (support level).
Time Axis:
The horizontal axis shows time intervals, likely for July 20, 2025, with labels at 15, 16, 17, 18, 20, 22, 23, 24, and 25 (possibly representing hours in UTC).
Chart Type:
The chart appears to be a candlestick or line chart, though the specific type isn't visible in the provided data.
Observations:
The EUR/USD pair showed minimal movement during this period, with a slight decline of -0.01%.
The price traded in a tight range between 1.16189 (low) and 1.16275 (high).
The close (1.16251) was slightly below the open (1.16265), indicating minor bearish pressure.
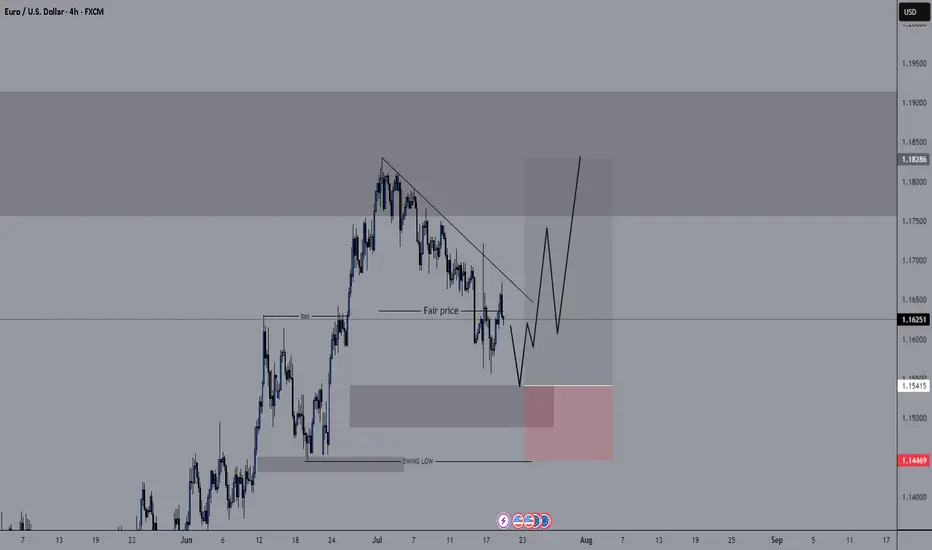
EURUSD 4H - BUYOver all it's an uptrend, I believe price finish the correction by reach 61.8 Fib and price is showering Divergency in the daily Time farm, I expect price to continue with the uptrend.

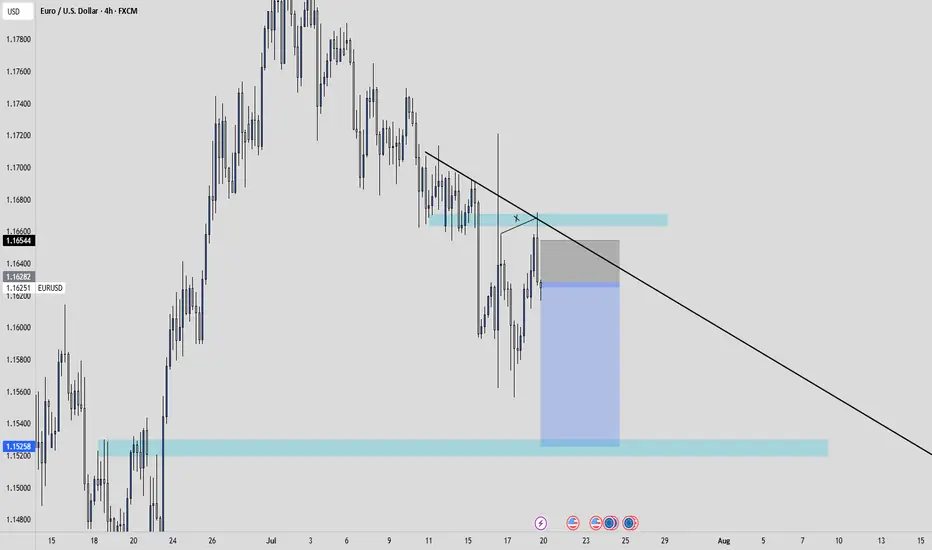
EURUSD SHORTS IDEA
Key take away poins : FX:EURUSD
Fundamental :
The Euro has been weaker because of USA's tariff on the EU. Which caused an increased demand for USD, as the tariffs supports US economical growth, which boost the short term currency strength.
Technical :
EURUSD has made a break and retest of a previous SnR area.
We printed a H4 engulfing after we swept liquidity.
We have a strong LQ grab
Price retested a really POWERFUL trendline.
I will look to enter directly at the engulfing for some sell opportunities.
TMAS20X, entertainement purpose only. Not financial advice.
CNY/USD Trend since 06 2007. Channel. Reversal zone.Logarithm. Time frame 1 week. At the moment, the currency is stronger than the dollar.
The main trend is a descending channel. The price is in it now.
Secondary trend — breakout of the descending trend line. Price growth to the median of the channel, and in case of its breakthrough, to the resistance. If not, then a pullback to the lower zone of the channel.
Local trend — The nearest events and news background, which can affect (not necessarily) locally (movements to the median of the channel, i.e., the middle, if it is positive) on the yuan rate. This, in less than 1 month, namely from October 22 to 24, 2024 will be held 7.16 XVI BRICS summit (short for Brazil, Russia, India, China, South Africa) in Russia in Kazan.
Line graph for visualization.

NZDCAD TRADE SETUPWait for retest the entry level and bearish momentum candle then take a trade for Sell otherwise skip this setup

GBPUSD TRADE SETUPWait for retest the entry level and bullish momentum then take a trade for Buy otherwise skip this setup

Week of 7/20/25: EURUSD AnalysisLast week's price action was bearish and has finally reached the extreme daily demand level and provided some reaction. Price has swept bulls and bears, so now we follow internal structure and wait to see where price actually wants to go. If internal 1h structure breaks bearish, we have confirmation to trade bearish until price goes deeper into the daily extreme zone.

EURJPY in Uptrend ContinuationBuy Limit
Entry Price 172.536
Stop Loss 171.730
Risk 1%
Lot Size 0.46
TP (1RR) 173.342
TP (3RR) 174.954

It has a good risk-reward ratio.Hello friends..
The transaction shown, if it reaches the specified area, you can enter the transaction in the lower time frame with confirmation.
Follow our page to see more analysis.
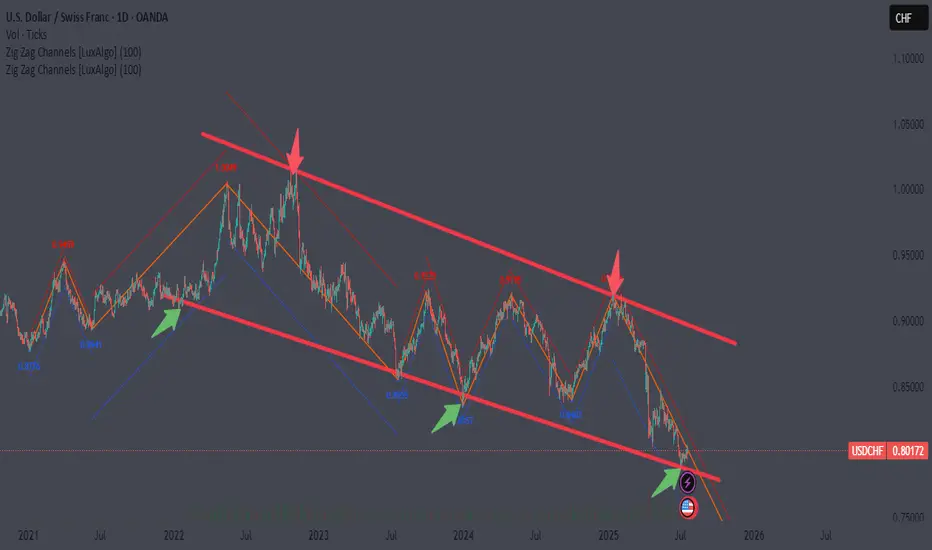
H4 LongUSDCHF is touching levels that it only touched in 2011. Its presently sitting on a very strong support. We expect a very long retracement which will last the remainder of 2025.
USDJPY - Bullish Structure in Play• Pair: USDJPY (UJ) • Bias: Bullish • HTF Overview (4H): • Clean external break to the upside confirms bull control heading into the new week. • Structure shift is undeniable — market bias is now favoring continued strength.
• MTF Refinement (30M): • Zoomed in to the 30M and identified internal liquidity (SSL) taken out. • Strong mitigation of internal OB followed. • Still in analysis mode — no trades taken yet.
• LTF Confirmation (5M): • Waiting on a refined CHoCH (marked by green lines at highs). • Once that prints and rules align, I’ll shift into trader mode for the execution.
• Entry Zone: • 30M OB mitigation + LTF (5M) CHoCH confirmation.
• Mindset Note: • Patience is the play. No guessing, no hesitation — just clean reads and precision strikes. • Analysis first, execution second. That’s the system.
Bless Trading!

GBPJPY TRADE SETUPWait for retest the entry level and bearish momentum candle then take a trade for Sell othewise skip this setup

USDCHF in Uptrend ContinuationBuy Limit
Entry Price 0.7995
Stop Loss 0.7968
Risk 1%
Lot Size 0.74
TP (1RR) 0.8022
TP (3RR) 0.8076

Eurnzd buy Eurnzd is in uptrend currently, now we have a pullback to a interesting support where we have a bounce . Looks a solid area to buy up to next resistance zone of 1.9500 to 1.9700 areas take profits.

GBPAUD Bullish BiasPrice has entered the weekly demand zone and formed an inverse head and shoulders.
Price also shows bullish divergence on the RSI indicator.
Recent fundamental news of AUD showed increase in unemployment and father rate cuts are expected in the near future.

NZD_JPY PULLBACK EXPECTED|SHORT|
✅NZD_JPY has been growing recently
And the pair seems locally overbought
So as the pair has approached
A horizontal resistance of 88.900
Price fall is to be expected
SHORT🔥
✅Like and subscribe to never miss a new idea!✅
Disclosure: I am part of Trade Nation's Influencer program and receive a monthly fee for using their TradingView charts in my analysis.

EURJPY break of strong support , at fib 0.5 short EURJPY was trending in uptrend but recently a strong support was broken and Big Sell candle is formed and currently price has pulled back to fib 0.5 and soon may price go down.


AUDUSD Ready to enter Buy?✅ **Market & Timeframe:**
AUD/USD, 1‑hour chart.
✅ **Overall Bias (multi‑timeframe):**
* Weekly: Bullish
* Daily: Bearish
* 12H: Bullish
* 6H: Bullish
* 4H: Bullish
➡️ **≈ 80% Bullish bias overall.**
✅ **Pattern & Structure:**
You’ve clearly highlighted an **Inverse Head and Shoulders**:
* Left Shoulder near 0.6520
* Head near 0.6500
* Right Shoulder near 0.6525
Price has broken above the neckline (\~0.6540 area).
✅ **Key Levels:**
* **Daily AOI (Area of Interest):** 0.6537–0.6541
(price currently above, expected to retest this zone)
* **Next upside target:** 0.6588–0.6590
* **Major support:** Lower Daily AOI around 0.6466–0.6490
✅ **Moving Averages:**
* Blue MA (shorter) is above red MA (longer) – showing upward momentum.
✅ **Price Action Plan (illustrated by your arrows):**
1. Price has just broken out above the neckline.
2. Expecting a **retest back into Daily AOI (\~0.6540)**.
3. Looking for bullish confirmation there (e.g., bullish candlestick pattern) to enter **long**.
4. Targeting the resistance zone around **0.6588–0.6590**.
---
📌 **Summary:**
Your chart signals an **80% bullish setup**.
✅ Inverse head & shoulders → breakout above neckline.
✅ Wait for price to pull back into Daily AOI (0.6537–0.6541).
✅ Look for bullish confirmation → then enter long.
🎯 Target: \~0.6588–0.6590.

Eurcad buyEurcad is looking like testing my dynamic support zone and a possible push back up is looming to next level upwards. 1.60407 for the next retest of resistance.

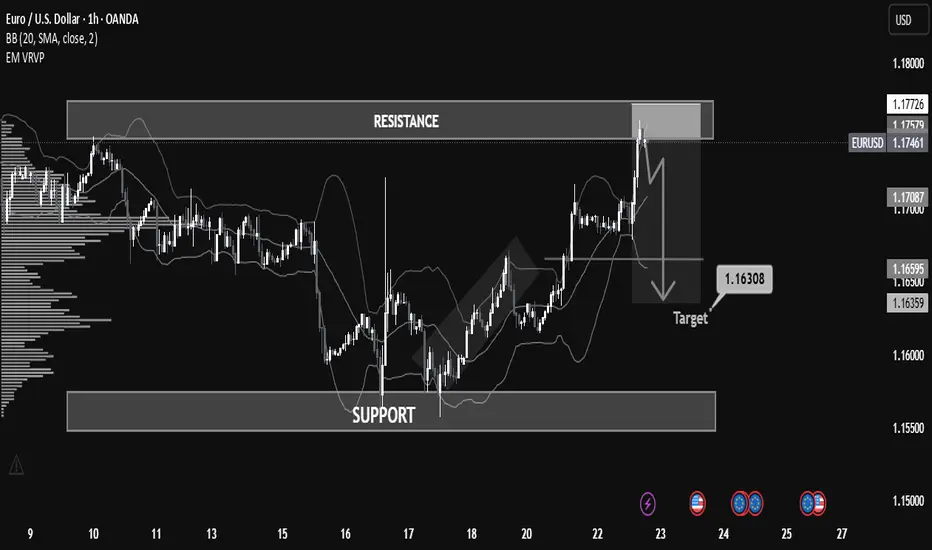
Why EUR/USD Dropped: A Step-by-Step Breakdown for Learners📉 Overview:
The EUR/USD has recently approached a key resistance zone near 1.17726, showing signs of a potential rejection after a bullish rally. The price is currently hovering around 1.17468, forming a short-term bearish setup that could lead to a retracement or reversal.
⸻
⚙ Key Technical Zones:
• 🔼 Resistance: 1.17500 – 1.17726
Price was strongly rejected after testing this area. This level has historically acted as a supply zone.
• 🔽 Support: 1.15500 – 1.16000
This is a historically significant demand zone, where price previously consolidated and reversed.
• 🎯 Target Zone: 1.16308
Marked as a potential take-profit level based on prior price structure and volume profile imbalance.
⸻
🧠 Indicators & Tools:
• Bollinger Bands: Price touched the upper band in overbought conditions, suggesting a possible mean reversion.
• Volume Profile (VRVP): Indicates declining volume near resistance, pointing to weak buyer momentum.
• Price Action: Bearish engulfing candle and strong rejection wick at resistance, confirming selling pressure.
⸻
🧭 Market Bias:
📌 Short-Term Bearish
A short opportunity is forming based on the rejection from resistance and overextension of price.
⸻
🧩 Possible Scenario:
1. Breakdown below 1.17061 (mid-level support) could trigger acceleration to the downside.
2. 1.16500 and 1.16308 are ideal short targets before reevaluation for continuation or bounce.
⸻
🛑 Risk Management Tips:
• Consider SL above 1.17800 (previous high).
• Monitor for confirmation before entry (e.g., bearish candle close below 1.17000).
• Adjust size and risk-reward ratio appropriately.
EUR/USD - Final Push Before Collapse?This EUR/USD daily chart highlights a bearish setup within a weakening rising wedge.
A Change of Character (CHoCH) confirms a potential shift in structure as price pushes toward buy-side liquidity above previous highs—where retail stops are likely resting.
Once this liquidity is swept, smart money is expected to reverse price sharply, breaking wedge support. The projected move targets the 1.03 zone, representing a 7% drop, aligning with internal liquidity and a return to the discount zone.
This setup illustrates classic SMC behavior: liquidity grabs, structural shifts, and institutional unloading before a major move.
EUR/USD – Final Push Before Collapse?
