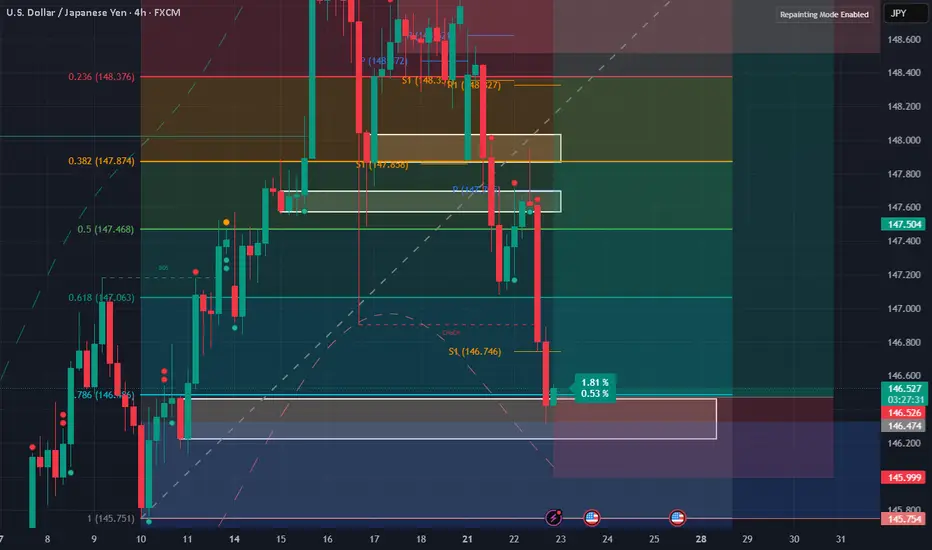
USDJPY Exposed Bullish zone Key Reversal Zones
Bullish Reversal: 146.450
If price breaks above with confirmed surge in volume (relative to recent baseline), initiate long.
Breakout Confirmed: Price closes beyond reversal level (not just taps). Volume Surge: Spike exceeds previous 3–5 bar average; look for institutional signature (non-retail flow) Trap Signature: Prior candle(s) must show wicks or indecision = fuel for move.
Breakout Compression: Low volume chop signals energy build-up. Sudden spike at level = intention exposed. Through: 2nd candle must confirm; hesitation = abort. Rapid thinning above/below = hidden hands preparing.
The price breaks — but the volume reveals.”
Don’t front-run memory levels. Let the market show its hand, then strike with precision.
Ready for deployment. Set alerts at 146.450 and 147.350.
Monitor volume, not emotion.
Would you like a trade log template or live tracking sheet for this setup?
Forex market

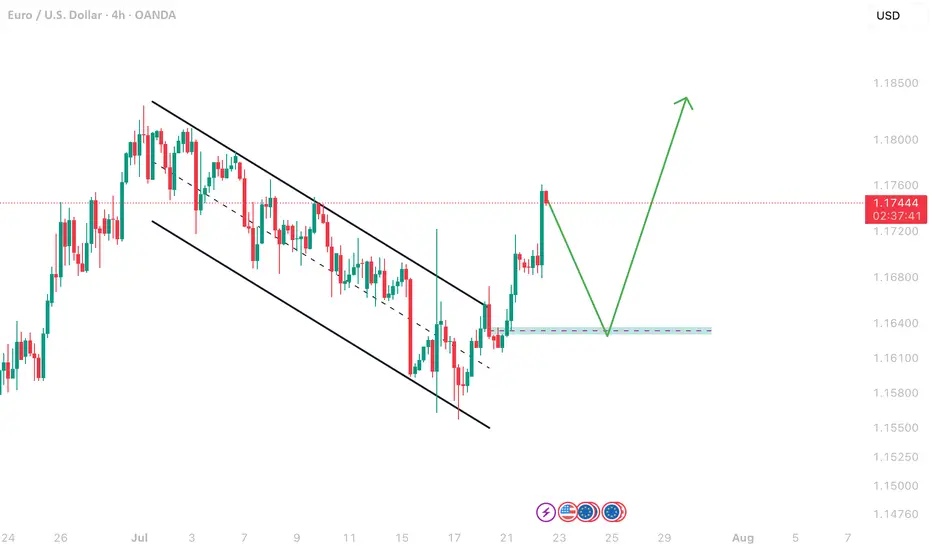
EURUSD Channel TradeAs you can see EU trading inside a channel and next predicted move can be possible retest and go again upside.

EUR/USD - Potential TargetsDear Friends in Trading,
How I see it,
KEY SUPPORT AREA @ 1.1250
If support area holds, more bullish action will follow
I sincerely hope my point of view offers a valued insight
Thank you for taking the time study my analysis.

NZDUSD Updated analysis This analysis is an update of the previous one I made on NZDUSD. And if you're not following me, you can do that so you don't miss my analysis as I drop them often.
So eventually, the NZDUSD took out the level, and eventually used the extreme OB which also had an inducement. This is why we must stay reactive when trading.
Live and learn, Follow me for more trading setups.

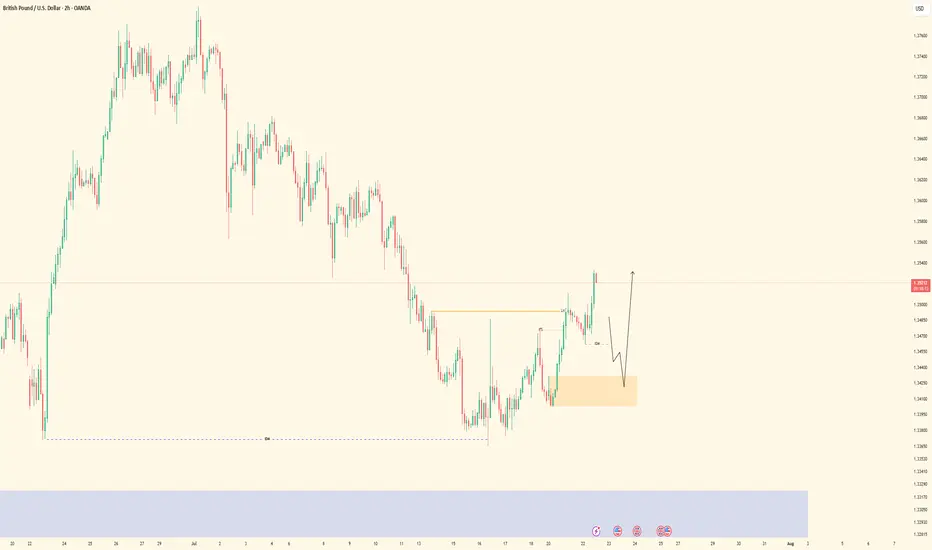
GBPNZD POTENTIAL LONGSHi guys, As you know I'm always sharing my thoughts with you guys and making updates. And today I'm taking a trade on GBPNZD and this is how I see it.
Do your own analysis, but I hope this helps.

EURUSD| Back Aligned Bullish - Still in Analysis ModePair: EURUSD
Bias: Bullish
Following price closely and adapting to the market’s rhythm.
Recent structure showed that price is still respecting last week’s key zones — so I’ve realigned with the bullish bias accordingly.
No entries yet — still in analysis mode, which honestly is the best part 😉
Watching for clean LTF confirmations before engaging. No guessing. No forcing.
Price always tells the truth — you just gotta stay patient enough to listen.
#EURUSD #SMC #bullishbias #marketstructure #inducementking #smartmoneyflow
Bless Trading!

GBPUSD| Bullish Structure Intact - Waiting on BSL SweepPair: GBPUSD
Bias: Bullish
Been following price closely while staying in analysis mode — no rush.
Recent structure remains intact and aligned to the upside. Now waiting for a clean BSL sweep to clear liquidity before looking for LTF confirmations to engage in buys.
Momentum is there, structure is clean — I just need price to do its part.
Staying patient. Still in sync.
#GBPUSD #SMC #bullishstructure #orderflow #inducementking #smartmoneytrader
Bless Trading!
Gbpjpy buy The pound looks like it has finally given a signal for a buy bouncing off a nice support zone and fib , I can see a good healthy rise from 198.126 take profits at 199.857

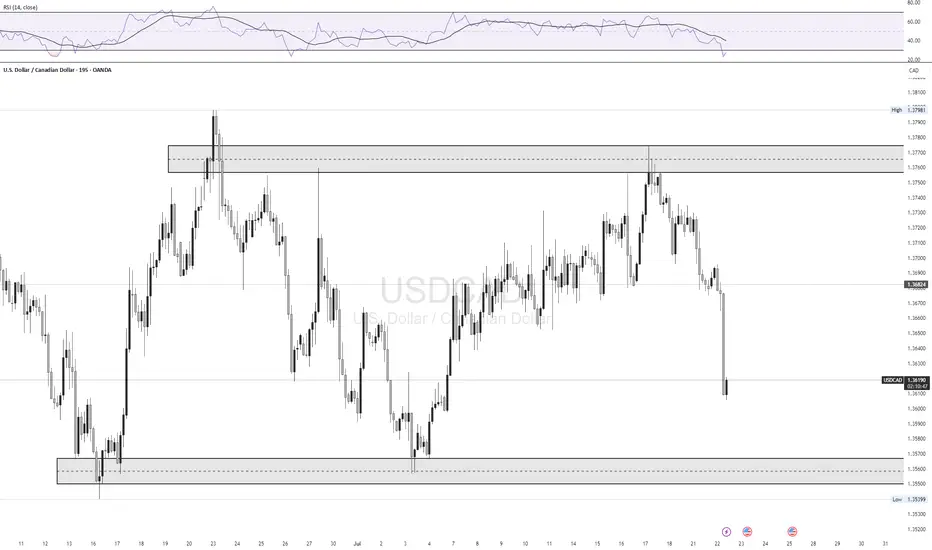
USD/CAD LongLooking for a retest of 1.35600 zone for a bounce back up to 1.37650 supply zone
FX:USDCAD
UsdJpy LongFX:USDJPY
Fibo test of 0.786 breakout movement + block order test, on m5, structure break in long, at the top we have targets (Imbalances, gaps and liquidity behind highs)
USDJPY| Bullish Bias - Mitigated OB, Waiting for LTF ConfirmsPair: USDJPY
Bias: Bullish
Price swept deeper liquidity and has now mitigated a key 30M bullish order block.
From the 2H bird’s eye view, structure is still aligned to the upside — but I remain in analysis mode until LTF confirms the shift.
No need to force anything — price is doing its job, and I’m waiting for it to speak clearly through confirmation.
Bullish structure still in play, but we wait for the perfect moment.
#USDJPY #SMC #bullishbias #orderblock #structuretrader #inducementking
Bless Trading!

Trump did it again!Donald Trump did exactly what he did in his previous term: Dollar Devaluation .
Reason? Strengthening the US exports.
Will it work? We'll see.
What's your thoughts?
#dollar #forex #euro #devaluation #trump #exports #trading #algo

#EURUSD - Pivot Point is 1.174Date: 22-07-2025
#EURUSD - Current Price: 1.175
Pivot Point: 1.174 Support: 1.162 Resistance: 1.185
Upside Targets:
Target 1: 1.190
Target 2: 1.195
Target 3: 1.203
Target 4: 1.211
Downside Targets:
Target 1: 1.157
Target 2: 1.152
Target 3: 1.144
Target 4: 1.136
#TradingView #Forex #Currency #StockMarket #Investing #Trading #EURUSD
#TechnicalAnalysis #SotockCharts #Finance
#PivotPoints #SupportResistance

AUD/CAD LIVE TRADE UPDATE📍AUD/CAD – Live Trade Update
We’re still in this trade, and the structure suggests more downside potential.
All VMS criteria remain intact, and we’ll continue to monitor volume, momentum, and price behavior closely.
📌 Patience is part of the plan. Let the setup work.

GU shortsbased on LTF analysis GU currently trading at a PD array Be-OB and look to push market to the recent Bu-OB

AUD/JPY LOSS❌ AUD/JPY Loss – Market Shifting
We anticipated another move up on AUD/JPY, but price had other plans.
Looks like a new downtrend may be starting—which is actually good news.
We don’t trade in consolidation.
We wait for structure, direction, and alignment.
📌 Movement = opportunity. And we might have a new one setting up soon.
Losses are part of the process. The VMS strategy keeps us focused, patient, and ready for the next valid setup.

GBP/USD - Potential LONG After sweeping Liquidity last week, GBP/USD has been pushing higher.
Price has now pushed towards a 4H Bearish FVG, if price pushes through this area and its gets invalidated, we can look for Long positions on the lower timeframes.
Note - I only take my trades during London or New York sessions, this is a potential for London open.

EUR/USD LOSS❌ EUR/USD Loss – Part of the Process
We were in this trade for 4 days before price made a sharp move against us, taking out our stop.
No strategy wins every time—and this is one of those times.
But losses like this are easier to handle when you have a rules-based system like the VMS strategy behind you. It’s built to:
Filter only high-probability setups
Keep emotions out of decision-making
Win more than it loses over time
📌 This wasn’t a bad trade—it was a trade that didn’t work this time. Big difference.
We stay focused. We stay patient. And we keep showing up.

GBP/USD is having a bearish bias and it just mitigate the BBGBP/USD is having a bearish bias and it just mitigate the Braker block in my extreme POI as a results today Tue/jul/2025 i decided to open a short position.

GBP/JPY WIN📈 VMS Strategy – GBP/JPY Triple Top Win
Another clean triple top reversal, this time on GBP/JPY, using the VMS strategy.
This trade checked every box:
✅ Clear triple top structure
✅ Strong engulfing candle
✅ Volume + momentum aligned perfectly
✅ Entry near the 50EMA with patience and confirmation
Price made a solid move in our favor and hit the profit target earlier this morning.
If you’re finding value in the VMS system, consider sharing it with someone who needs structure, patience, and a real edge.
📌 The trade either fits the rules—or it doesn’t. That’s what makes this work.

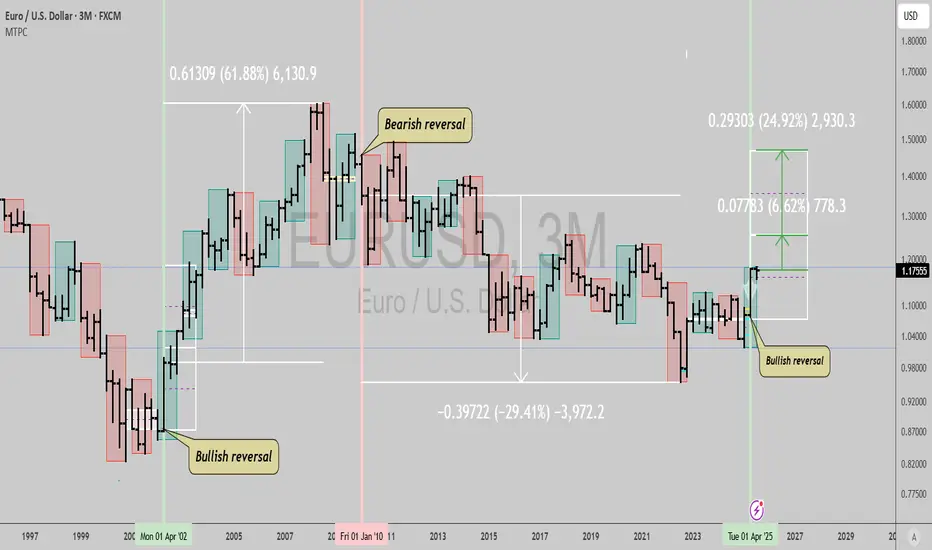
$EURUSD: Massive signal not seen since 2002...GM gents, wanted to bring your attention to the Euro here. This type of signal hasn't happened since 2002, which makes it a very big deal and a very real risk if you're in Europe and holding USD exposure.
We could see a 7% to 25% rally in the coming 2 years from this spot, with pretty high probability, and maybe even a series of similar signals in the same direction for longer like from 2002 to 2010 when the quarterly trend turned bearish decisively.
It's wise to find some way to generate enough returns to cover this currency risk, if you're invested in US stocks, crypto (stables mostly denominated in USD), etc.
Best of luck!
Cheers,
Ivan Labrie.
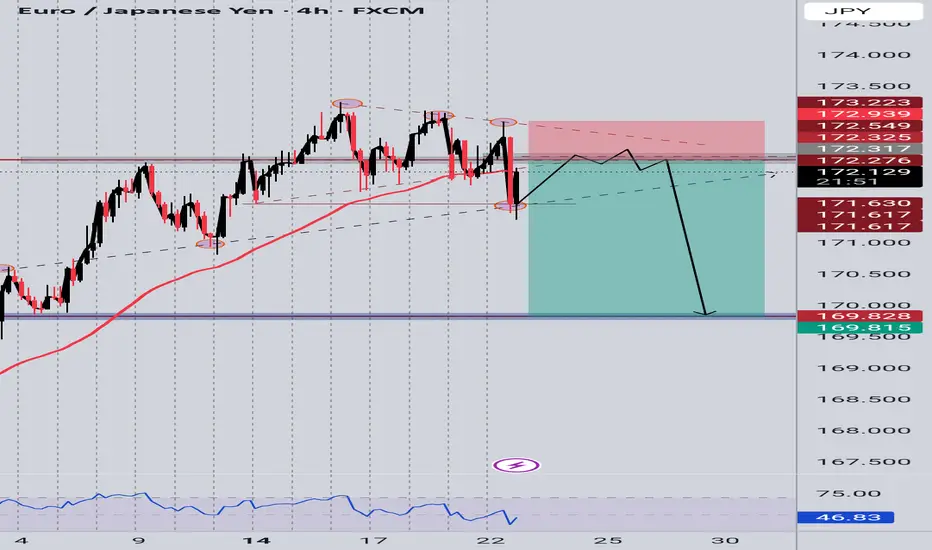
EURJPY 4H chartIf price fails to reclaim above 172.5 and prints a bearish confirmation candle on the retest, it's a high-probability short opportunity targeting the 170.000–169.800 support zone — as you've marked.