CADJPY daily 20EMA bounceSimple idea here, CADJPY is testing the daily 20EMA (overlayed on this 4H chart) and recently broke above the monthly 20EMA (overlayed)... if price reclaims the daily 10EMA (overlayer) could be a nice move up.
Very simple trade, tight SL if entering.
Forex market

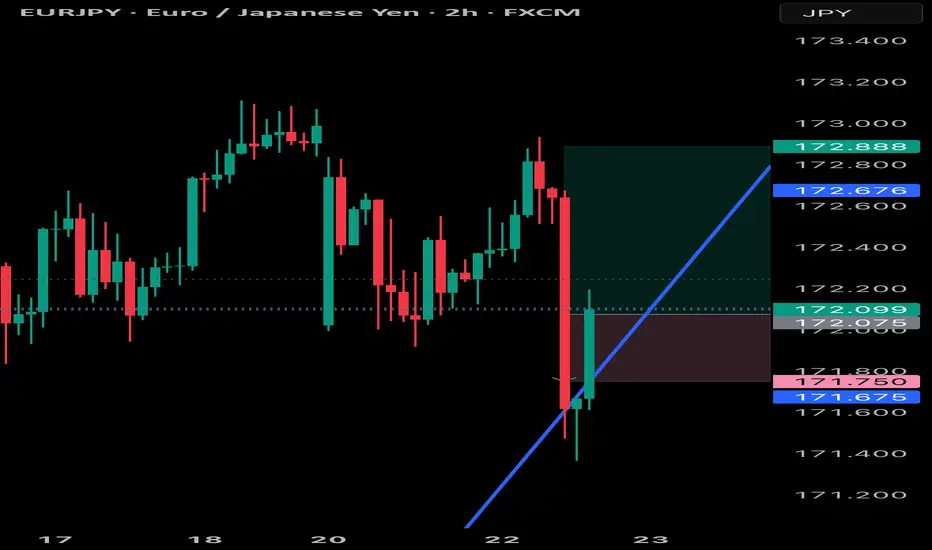
RESET PRICE FOR EJEurjpy has gone down but only to clear stops and lows but we keep following the trend because it is the only true direction for now
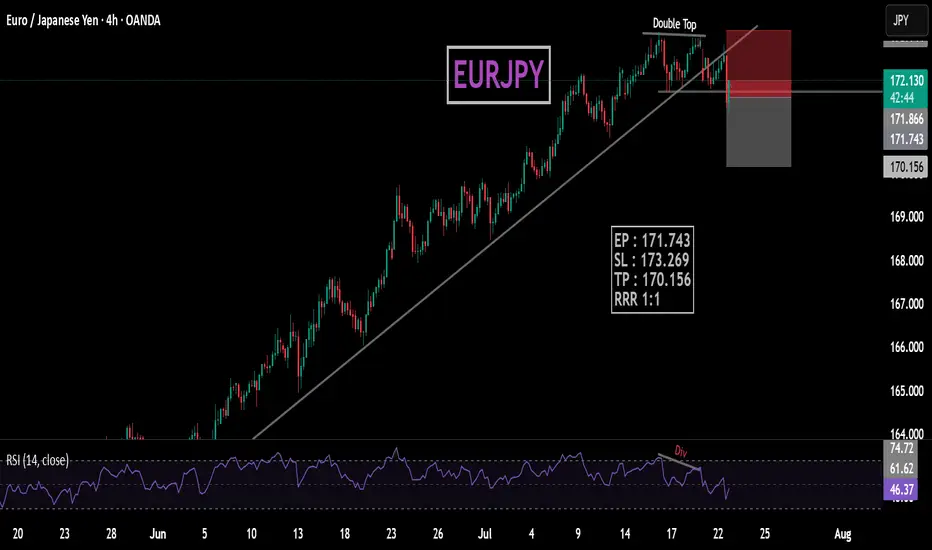
EURJPYDouble top with rsi bearish Divergence also bulish trendline beark.
EP : 171.743
SL : 173.269
TP : 170.156
RRR 1:1
EUR/GBP Pushing higherLooks like a good trade to the upside on the EUR/GBP.
Risk to reward potential 3:1
Upward trend is well formed

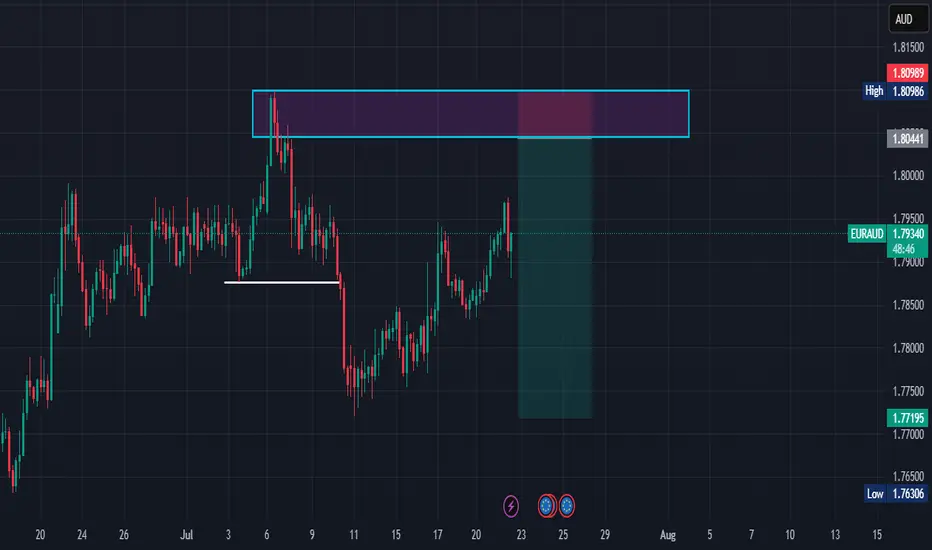
EURAUD Bearish Possible Move.Price on weekly signifies a possible sell move, with an engulfing pattern. Daily formed a supply zone, signifying a possible bearish move. Price retracing to the 4hr supply zone for possible entry.
Remember: Risk Management very important.
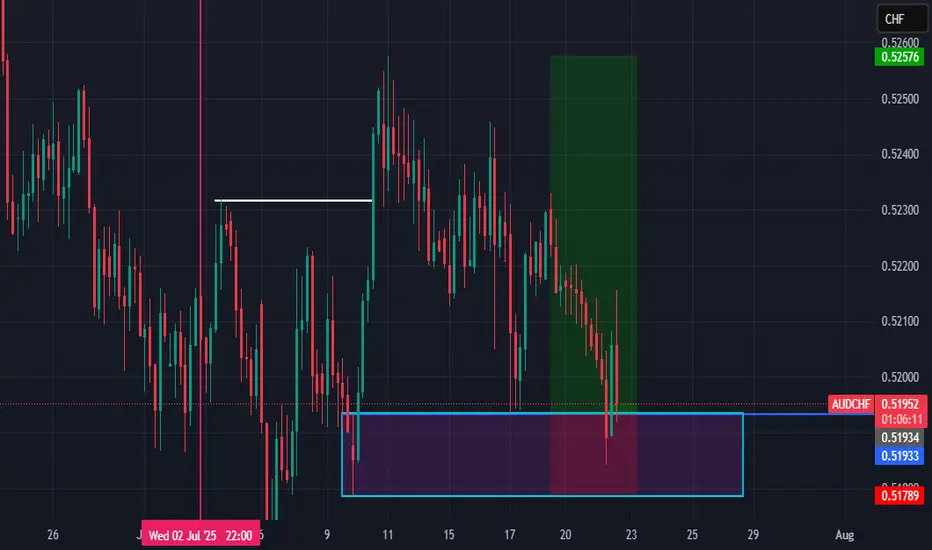
AUDCHF Bullish MovePrice from the weekly shows a possible bullish trend with an engulfing. daily created a demand zone also signifying a possible buy. Price retraced to 4hr demand zone for entry.
Entry Triggered.
Remember: Risk Management Very Important.
Market Overview/Trade RecapsKeep it simple guys keep learning keep getting better every single day find put what you need to become profitable

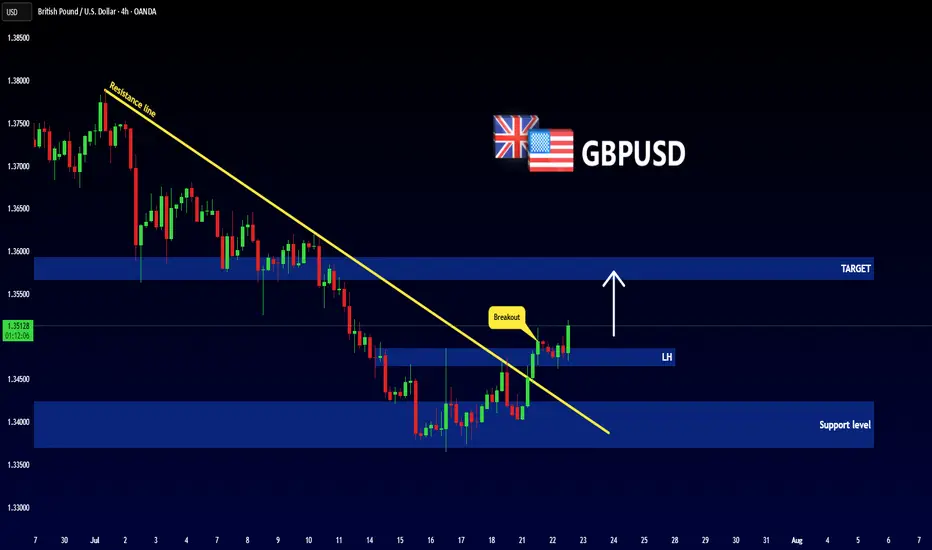
GBPUSD - New Breakout !Hello Traders !
The GBPUSD failed to create a new lower low!
Currently, The lower high is broken (change of character).
So, I expect a bullish move🚀
__________________
TARGET: 1.35670🎯
GBPUSD Long📊 Market Structure Overview:
After forming a swing low near 1.3474, GBPUSD respected the demand zone and initiated a strong bullish impulse.
This rally broke above internal market structure, triggering a Break of Structure (BOS) at 1.3519, indicating a momentum shift favoring the bulls.
A short-term retracement is anticipated, offering a potential higher low formation before continuation toward untested higher timeframe liquidity.
📌 Key Zones ("Your Borders"):
🟢 Demand Zone (Support / Re-Entry Area)
Level: 1.3480 – 1.3495
This green demand block is strategically positioned just above the 0.5 Fibonacci retracement level (1.3490) and below the IDM low (1.3474).
This confluence adds strength to the zone, making it a high-probability re-accumulation area where buyers are expected to defend.
If price retests this level after the recent BOS, it may present an ideal long entry opportunity with a bullish continuation target above the local high.
⚪ Mid Supply Zone (Breakout Zone)
Level: 1.3519 – 1.3530 (gray shaded area)
This zone was the prior resistance level before the BOS. Now that price has broken above, it may act as a minor resistance-turned-support if price consolidates or pulls back temporarily.
🔄 Price Expectation:
A pullback into the 1.3480–1.3495 demand zone is anticipated to attract renewed buying pressure.
If bullish structure holds, the market is likely to form a higher low, then resume upward momentum, potentially breaking through the minor supply near 1.3530 and targeting 1.3550–1.3570 as a liquidity draw.
A failure to hold above the IDM low at 1.3474 and the structural CHoCH at 1.3461 would invalidate the bullish scenario and shift bias back to the downside.

USDJPYDate:
July 22,2025
Session:
Tokyo and London session
Pair:
USDJPY
Bias:
Long
1. Clean liquidity pool left unswept from last week's NYC Open (Thursday).
Took this trade earlier today but looks like price wanted to consolidate in the liquid pool its currently in. I still hold the same idea and think the sweep will definitely take place sometime this week. Now looks like the perfect time to enter. If Asia session cant get it done its up to London and New York session.
Entry:147.534
Stop Loss:147.215
Target:148.768
RR:3.89


EURJPY about to enter into a DowntrendRecently EURJPY reached high points in the chart at 173.016
From there it fell and continued downwards.
I took a quick demo trade with an inverse risk to reward. Not the ideal thing to do, but I didn't want to keep my TP higher than 173.016 since we know it's a strong resistance level.
Got a quick win there.
Now, on the 4H, we can see that one huge red candle look out the previous five green candles.
It indicates that selling pressure is incoming.
This would be a good time to sell now. But I do want to see price go below 171.540 just to get that extra confirmation. Just in case, price decides to consolidate or go high for a while.
Have to stay vigilant with this market now.
TP1 will be 171.100.
TP2 will be 170.000
TP3 will be 168.800
Lets see how this trade plays out.

Bullish Momentum Builds: Long Setup on AUD/JPYThe AUD/JPY pair has recently broken out of a long-term descending trendline, signaling a strong shift in market structure. This breakout was supported by multiple bullish BOS (Break of Structure) and ChoCH (Change of Character) signals, indicating institutional buying interest. Price has since retested the breakout zone and is showing signs of continuation, now consolidating just below a key supply zone. With momentum building and previous resistance flipping to support, I’ve entered a long position at 95.65, aiming for a clean push toward the next major resistance at 98.13.
This trade setup aligns with the overall bullish sentiment supported by strong volume during recent rallies and the current market structure. The stop loss is set at 94.94, just below a key demand zone, allowing room for healthy retracement without invalidating the setup. MFI remains neutral, giving the pair more upside potential, while the Stochastic suggests short-term consolidation may be nearing completion. If momentum continues to build, a breakout toward the target is highly probable.

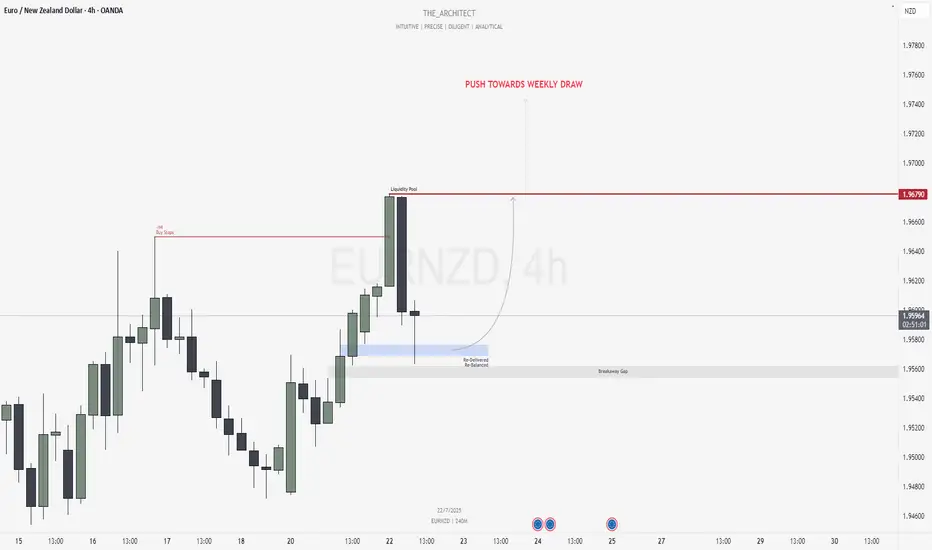
EURNZD: Bullish Confluence Aligns for Buy Setups at Key ArraysGreetings Traders,
In today’s analysis of EURNZD, we identify that the current institutional order flow is bullish. With this bias in mind, we aim to capitalize on high-probability buying opportunities from key points of interest aligned with institutional behavior.
Higher Timeframe Context:
The weekly timeframe is showing a clear bullish narrative. This bullish order flow is confirmed by the H4 timeframe, which is also delivering higher highs and higher lows—providing confluence between both the macro and intermediate timeframes. This alignment increases our confidence in seeking long setups.
Key Observations on H4:
Buy-Side Liquidity Sweep: Price recently took out H4 buy stops, which triggered a retracement into internal range price action.
Re-Delivered Re-Balanced Zone (RDRB): Price has now pulled back into a re-delivered, re-balanced array—a significant institutional level that typically offers low-risk buy setups. Given the nature of this zone, we do not anticipate a deeper pullback into the fair value gap (FVG), thereby treating it as a potential breakaway gap.
Draw on Liquidity: The next probable target is the external liquidity pool resting in premium prices. The market appears poised to gravitate towards that area.
Trading Plan:
Entry Strategy: Monitor the lower timeframes for bullish confirmations within the RDRB array.
Targets: The primary target is the engineered liquidity pool in premium prices.
For a detailed analysis, please watch this weeks Forex Outlook:https://www.tradingview.com/chart/EURNZD/BZC9xW1L-July-21-Forex-Outlook-Don-t-Miss-These-High-Reward-Setups/
Remain patient, trust the structure, and execute with precision as the bullish narrative unfolds.
Kind Regards,
The Architect 🏛️📈
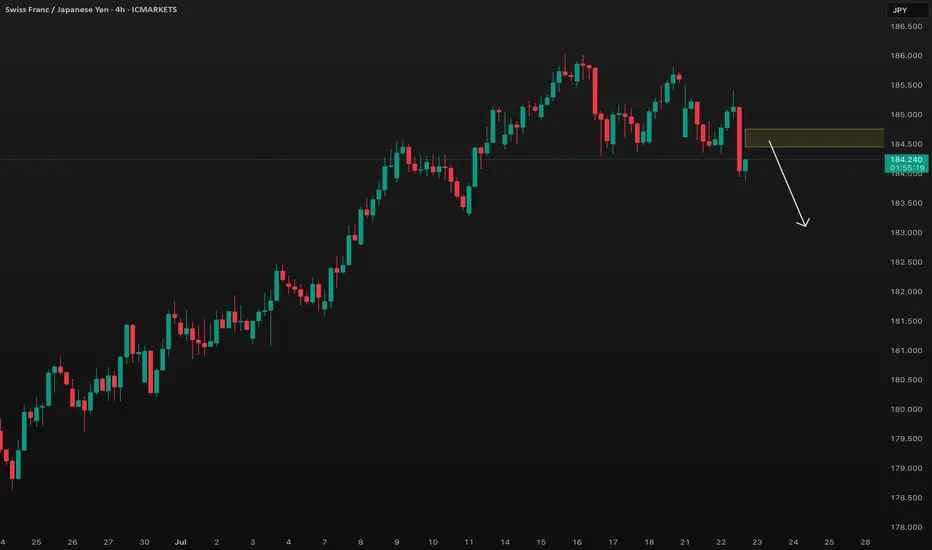
CHFJPY SELL TRADE PLAN🔥 CHFJPY TRADE PLAN 🔥
📅 Date: 22 July 2025
📋 Trade Plan Overview
Type Direction Confidence R:R Status
Swing Sell ⭐⭐⭐⭐ (82%) 4.0:1 Awaiting Confirmation
Guidance: Focus on Scenario A Primary Plan – high confluence bearish rejection zone after extended bullish run. Scenario B remains tactical, lower probability unless impulsive breakdown.
Total risk: 1.2% (standard swing).
Primary Trade Plan: Swing Sell
📈 Market Bias & Trade Type
Bias: Bearish
Trade Type: Reversal - Post-Parabolic Exhaustion
🔰 Confidence Level
⭐⭐⭐⭐ (82%)
Reason:
D1 parabolic exhaustion + rejection wicks.
H4 strong bearish engulfing.
H1 impulsive breakdown from 185.40 zone.
Volume spike on H1 selling.
Fib 61.8% rejection.
Sentiment stretched overbought JPY weakness.
Breakdown:
Price Structure: 30%
Candlestick Patterns: 20%
Volume / Fib / RSI: 22%
Macro / Sentiment: 10%
📌 Status
Awaiting Confirmation
📍 Entry Zones
🟥 Primary Sell Zone:
184.45 – 184.75 (H4 bearish order block + imbalance + prior rejection)
👉 Status: Waiting for rejection wick / bearish engulfing / LTF breakdown.
🟧 Secondary Sell Zone:
185.20 – 185.45 (H4 final supply zone; riskier short).
❗ Stop Loss
185.65 (above secondary zone wick + structure + 1.2x ATR).
🎯 Take Profit Targets
🥇 TP1: 183.10 (H1 imbalance fill; 125 pips; ~2.0:1 R:R)
🥈 TP2: 182.20 (liquidity pool, structure target; 210 pips; ~3.5:1 R:R)
🥉 TP3: 180.90 (deeper swing pullback; H4 demand zone; ~4.8:1 R:R) – Optional trail.
📏 Risk:Reward
TP1: 2.0:1
TP2: 3.5:1
TP3: 4.8:1
🧠 Management Strategy
Risk 1.2% of $ ($ , lots).
Move SL to breakeven after TP1 hit.
Close 60% at TP1, 30% at TP2, leave 10% runner for TP3 (trail SL).
If impulsive bullish reclaim above 185.00, exit manually.
Portfolio Risk capped at 3% max open trades.
⚠️ Confirmation Checklist
H1 bearish engulfing OR rejection wick in primary zone.
H1/H4 volume spike during London or NY session.
RSI divergence (optional).
No major JPY risk events upcoming.
⏳ Validity
H4 Swing: Valid for 2–4 days (expires 26 July 2025).
❌ Invalidation
4H candle close above 185.65
Bullish BOS on H1 beyond secondary zone.
🌐 Fundamental & Sentiment Snapshot
COT: CHF neutral / JPY oversold.
DXY: Rangebound.
Retail: 77% buyers CHFJPY (contrarian bearish bias).
Cross-Pair: EURJPY and AUDJPY showing topping signs.
Cross-Market: Risk sentiment fragile (SP500 fading).
Macro: No major CHF/JPY news.
Sentiment Score: +7/10 bearish CHFJPY.
📋 Final Trade Summary
Sell CHFJPY targeting reversal after extended bullish run.
Focus is on rejection from 184.45–184.75 with strict SL above 185.65.
Patience mandatory for confirmation candlesticks.
Aggressive scaling only if H1 breaks down from current price.
NZDJPY: Long Trade Explained
NZDJPY
- Classic bullish setup
- Our team expects bullish continuation
SUGGESTED TRADE:
Swing Trade
Long NZDJPY
Entry Point - 87.616
Stop Loss - 87.361
Take Profit - 88.064
Our Risk - 1%
Start protection of your profits from lower levels
Disclosure: I am part of Trade Nation's Influencer program and receive a monthly fee for using their TradingView charts in my analysis.
❤️ Please, support our work with like & comment! ❤️

NZDUSD Is a Short-Term Rebound on the Table?NZD/USD is down nearly 0.4% in Tuesday’s European session, trading near the key support area of 0.5940 — a confluence of the 0.5 Fibonacci retracement and the midline of a descending channel. The pair is pressured by rising expectations that the RBNZ may cut rates in August, while the USD remains volatile amid uncertainty surrounding trade talks between the US and its key partners.
🔍 Technical Overview – Structure & Momentum
✅ Overall Trend: Bearish short-term (descending channel)
✅ Current Structure: Price is testing key technical support at 0.5940
✅ Volume Profile: VPOC and upper supply zones remain key targets on a bounce
NZD/USD continues to respect the bearish channel structure. However, the support zone at 0.5940 (Fibo 0.5 + recent demand) is showing signs of holding. If price sustains above this level, a bullish correction toward the 0.6006 and 0.6040 supply zones is a valid scenario.
🧭 Trade Scenarios
🔸 Bullish Short-Term Scenario (if 0.5940 holds):
Entry: Buy around 0.5940
TP1: 0.60064 (VPOC + supply zone)
TP2: 0.60400 (OBS sell zone)
SL: Below 0.5905 (sell-side liquidity break)
🔹 Bearish Continuation (if support breaks):
A clean break below 0.5905 confirms downside continuation
Look for retest and short entries targeting deeper channel lows (0.586x–0.583x)
⚠️ Macro Risk Drivers
Growing expectations of an RBNZ rate cut in August
Ongoing US trade negotiation uncertainty with key partners
Potential USD volatility around upcoming macroeconomic releases
📌 Key Price Levels to Watch
Technical Support 0.5940 Fibo 0.5 + mid-channel
Sell-Side Liquidity 0.5905 Bearish confirmation if broken
VPOC + Supply Zone 0.60064 First upside target
OBS Sell Zone 0.60400 Final bullish target / resistance
💬 The descending channel remains in control, but 0.5940 could be the key pivot. Wait for confirmation before entering, and watch volume closely.

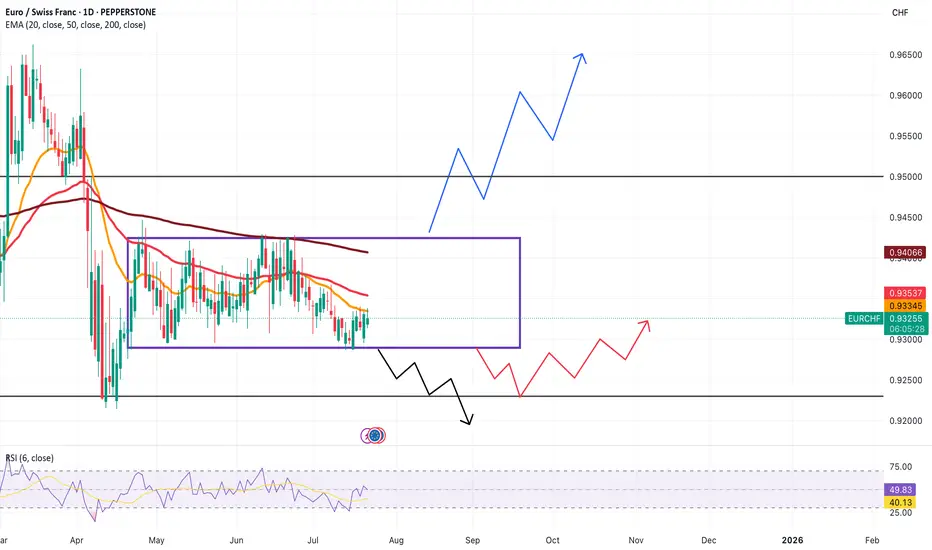
EURCHF has been a Terrible Market to Trade inEURCHF on the 1D has been consolidating for a few months now. Box has been drawn to indicate that.
It's been all noise and I dont think it would be wise to trade in a choppy market.
I'm wondering if anyone is trading EURCHF and has found a profitable way to trade it in this choppy market. Open to hearing any strategies being used in this market.
Key level of support is present at 0.92300. If price breaks the consolidation zone, I'll look to sell till 0.92300.
If the price moves up and above the consolidation zone, we could push till 0.95000
Would be setting alerts for these key levels but may not look to trade at the moment.
Open to hearing any profitable strategies being used in these market conditions.
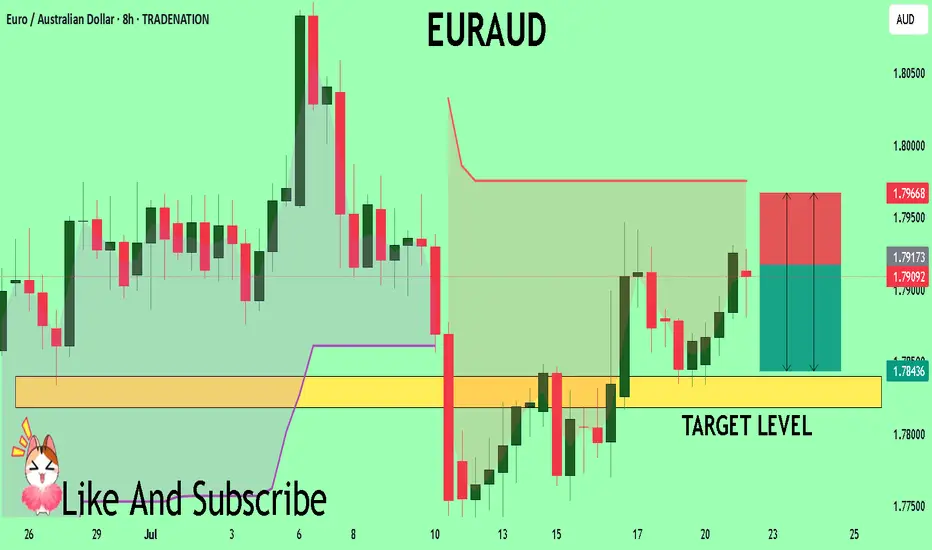
EURAUD Set To Fall! SELL!
My dear followers,
I analysed this chart on EURAUD and concluded the following:
The market is trading on 1.7917 pivot level.
Bias - Bearish
Technical Indicators: Both Super Trend & Pivot HL indicate a highly probable Bearish continuation.
Target - 1.7840
Safe Stop Loss - 1.7966
About Used Indicators:
A super-trend indicator is plotted on either above or below the closing price to signal a buy or sell. The indicator changes color, based on whether or not you should be buying. If the super-trend indicator moves below the closing price, the indicator turns green, and it signals an entry point or points to buy.
Disclosure: I am part of Trade Nation's Influencer program and receive a monthly fee for using their TradingView charts in my analysis.
———————————
WISH YOU ALL LUCK
China's Economic Storm: A Global Wake-Up CallChina, the world’s second-largest economy, is facing a perfect storm of demographic collapse, a housing market crash, and a strategic sell-off of US treasuries. These interconnected crises threaten not only China’s stability but also global markets, impacting forex traders, investors, and businesses worldwide. This article unpacks the unfolding challenges and their far-reaching implications, as discussed in our latest Edge Forex podcast.
A Demographic Time Bomb
China’s population is aging faster than any major economy in history, driven by a fertility rate of just 1.1–1.2 children per woman—well below the 2.1 needed to sustain a population. The legacy of the one-child policy has left a shrinking workforce and a projected 400 million people over 65 by 2050, comprising one-third of the population. This demographic cliff strains pensions and healthcare systems while youth unemployment, reported at 20% in 2023, fuels social discontent. Government subsidies to boost birth rates have failed, as high living costs and a drying job market deter young couples from starting families.
The result? A shrinking labor force, slowing GDP growth, and brewing social unrest. By 2080, China’s population could halve, leaving empty cities and businesses without workers. This isn’t just a numbers game—it’s a crisis that could derail China’s economic engine for decades.
Housing Market Collapse: A Crumbling Pillar
Once the backbone of China’s economic miracle, the housing sector is now a liability. New home prices have plummeted 23–25%, with monthly declines of 6–7%. Accounting for 25–30% of GDP, this sector’s collapse is catastrophic. The liquidation of Evergrande in 2024, with $310 billion in debt, exposed the over-leveraged nature of China’s property market. Goldman Sachs estimates $13 trillion (93 trillion RMB) in excess inventory—millions of empty condominiums in ghost towns, with malls and highways leading nowhere.
Housing represents 60–70% of Chinese household wealth, so falling prices are crushing consumer confidence and spending. Local governments, reliant on land sales, face budget crises, and an 8 trillion RMB stimulus has fallen short. This slow-motion crash, reminiscent of Japan’s 1989 property bubble but worsened by demographic decline, threatens financial stability and global economic growth.
US Treasury Sell-Off: A High-Stakes Gamble
In 2024, China slashed its US mortgage-backed securities holdings by 20%, part of a broader sell-off of US treasuries. This isn’t a choice but a necessity, driven by declining export revenues and insufficient funds to meet domestic and international obligations. The sell-off, fueled by a trade war and a sharp drop in US exports post-tariffs, forces China to liquidate treasuries to access US dollars. However, this move risks raising US interest rates, disrupting global housing markets, and escalating geopolitical tensions.
Charts show China’s treasury holdings peaking around 2005 before a sharp decline, while other economies like the Eurozone and UK increase their purchases. This shift could flood bond markets, pushing up yields and affecting forex pairs like USD/CNY. While short-term relief for China, this sell-off is a long-term gamble that could isolate it financially and signal deeper economic distress.
Global Implications for Markets and Forex
China’s export slump, treasury sell-offs, and housing crisis paint a picture of a nation losing its economic grip. For forex traders, the weakening Chinese Yuan against the US Dollar (USD/CNY) is a key focus, as economic stagnation and treasury sales pressure the currency. Higher US interest rates from these sell-offs could strengthen the USD, impacting global currency pairs and emerging markets. Investors in Chinese equities or real estate face risks from declining growth prospects, while businesses reliant on Chinese demand—think commodities or luxury goods—may see revenues shrink.
At Edge Forex, we see this as a red flag for long-term investors. Diversifying into assets less tied to China, such as Eurozone or UK markets absorbing treasury sales, could mitigate risks. The global ripple effects are undeniable: China’s slowdown could depress demand, disrupt bond markets, and create volatility across forex and equity markets.
What’s Next for Traders and Investors?
Monitor USD/CNY: Expect volatility as China’s economic woes weaken the Yuan.
Track Global Rates: Treasury sell-offs could push up US yields, impacting housing and forex markets.
Diversify Portfolios: Reduce exposure to Chinese assets and explore26% of Chinese household wealth, so falling prices erode consumer confidence.

EURGBP Pushing Up about to reach Major Resistance Level!EURGBP has been in a nice uptrend on the 1D and 4H.
Now, it is reaching a major resistance level at 0.86900.
Looking at the strong buying, there is a chance that price may break that level a move above 0.86900, but that is yet to be determined.
I've taken a demo position in this case, aiming 1:1 but possibly aiming for that 0.86900 level.
I saw a nice bounce of the 20 EMA and also that the 20, 50 and 200 EMA are lined very well. The RSI is also pointing upwards suggesting some strength.
It's been a while since the entry has passed by, but I'd like to post this idea to document this trade.
When price comes at the 0.86900 level, we can see what happens at the time and decide whether we are long or short.
It'll be interesting to see how this trade plays out.


AUD/USD – 15m Demand📊 Trade Breakdown:
Pair: AUD/USD
Timeframe: 15 Minute
Bias: Bullish
Type: Demand Zone Rejection
Entry: 0.65264
Stop Loss: 0.65186
Take Profit: 0.65570
Risk-to-Reward: ~3R
⸻
📌 Key Confluences:
• Clean 15m demand zone formed after a sharp impulse move
• Strong bullish engulfing candle from demand
• Liquidity sweep to the left prior to demand forming
• Structure shift with higher highs and higher lows
• Previous resistance flipped to support at entry zone
• AUD strength showing on intraday sentiment across multiple pairs
⸻
⚙️ Trade Setup:
Entered long after price tapped into the refined 15m demand zone and printed a bullish rejection wick. SL placed just below the zone to avoid noise. TP set near a prior 15m supply area / liquidity sweep zone.
I’m watching for continuation on the next 15m-1h candle closures. If price breaks above 0.6544, expecting follow-through to 0.6557+.
⸻
🧠 Mindset:
Stayed patient waiting for price to come to me. No FOMO. Clear invalidation and clean R:R. Confidence in the setup due to structure, confluences, and reaction off the zone. Trusting the process and letting the trade breathe.
Trade Simple, Live Lavish
