AUD/USD – 15m Demand📊 Trade Breakdown:
Pair: AUD/USD
Timeframe: 15 Minute
Bias: Bullish
Type: Demand Zone Rejection
Entry: 0.65264
Stop Loss: 0.65186
Take Profit: 0.65570
Risk-to-Reward: ~3R
⸻
📌 Key Confluences:
• Clean 15m demand zone formed after a sharp impulse move
• Strong bullish engulfing candle from demand
• Liquidity sweep to the left prior to demand forming
• Structure shift with higher highs and higher lows
• Previous resistance flipped to support at entry zone
• AUD strength showing on intraday sentiment across multiple pairs
⸻
⚙️ Trade Setup:
Entered long after price tapped into the refined 15m demand zone and printed a bullish rejection wick. SL placed just below the zone to avoid noise. TP set near a prior 15m supply area / liquidity sweep zone.
I’m watching for continuation on the next 15m-1h candle closures. If price breaks above 0.6544, expecting follow-through to 0.6557+.
⸻
🧠 Mindset:
Stayed patient waiting for price to come to me. No FOMO. Clear invalidation and clean R:R. Confidence in the setup due to structure, confluences, and reaction off the zone. Trusting the process and letting the trade breathe.
Trade Simple, Live Lavish
Forex market

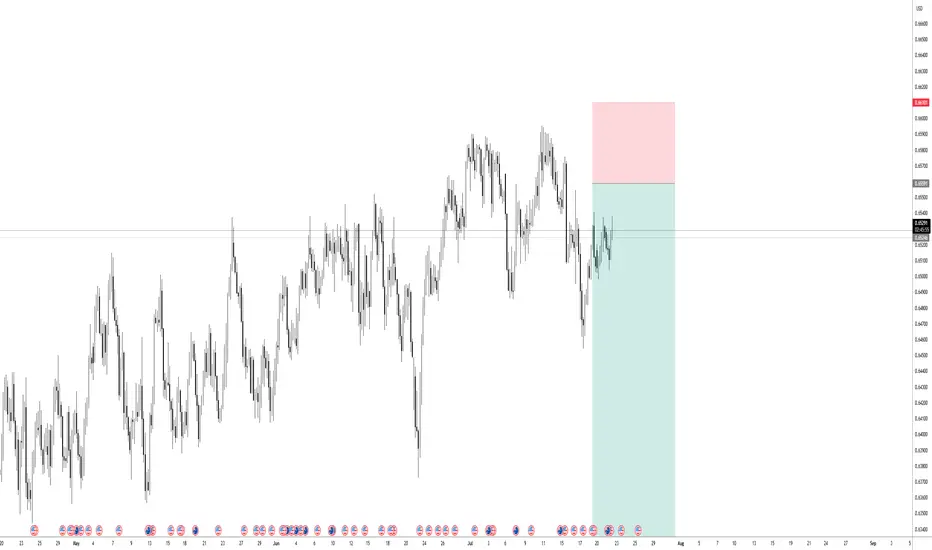
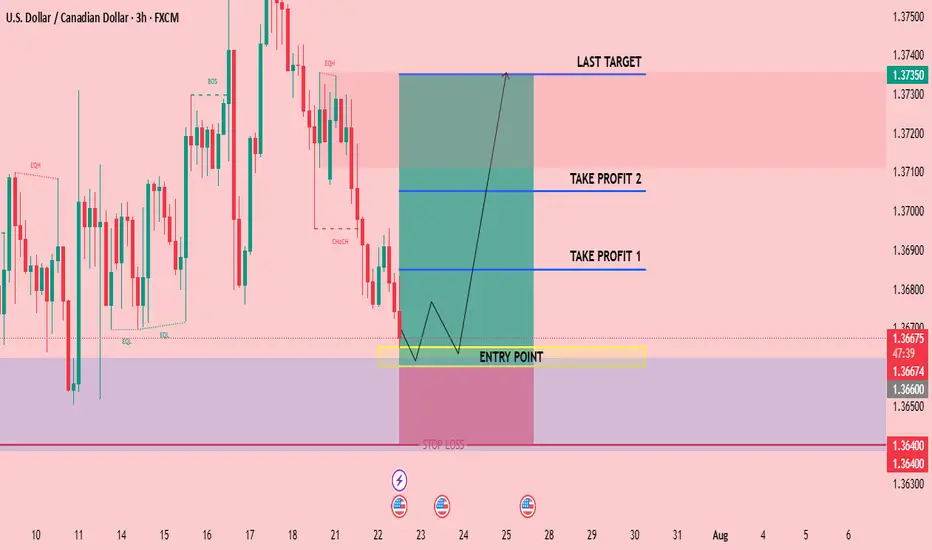
CHECK USDCAD SIGNAL READ THE CAPTAINEntry Point: Around 1.36650 1.36600
Stop Loss: Around 1.36400
🎯 Target Levels
Take Profit 1:
1.36850
Take Profit 2:
1.37050
last target
1.37350
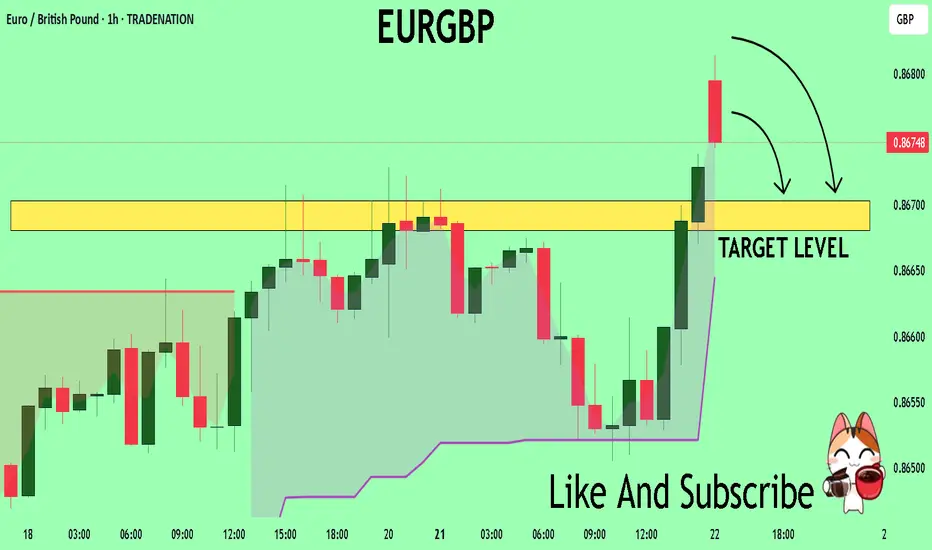
EURGBP The Target Is DOWN! SELL!
My dear friends,
Please, find my technical outlook for EURGBP below:
The price is coiling around a solid key level - 0.8676
Bias - Bearish
Technical Indicators: Pivot Points High anticipates a potential price reversal.
Super trend shows a clear sell, giving a perfect indicators' convergence.
Goal - 0.8670
About Used Indicators:
The pivot point itself is simply the average of the high, low and closing prices from the previous trading day.
Disclosure: I am part of Trade Nation's Influencer program and receive a monthly fee for using their TradingView charts in my analysis.
———————————
WISH YOU ALL LUCK
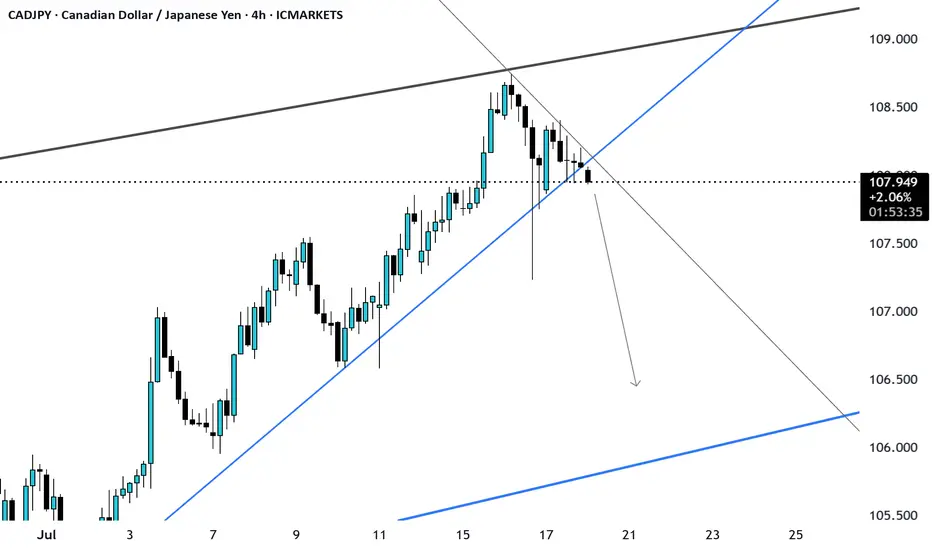
CADJPY Possible Down trend CADJPY has brokend the support the price may likely to go down and touch the support of 106.
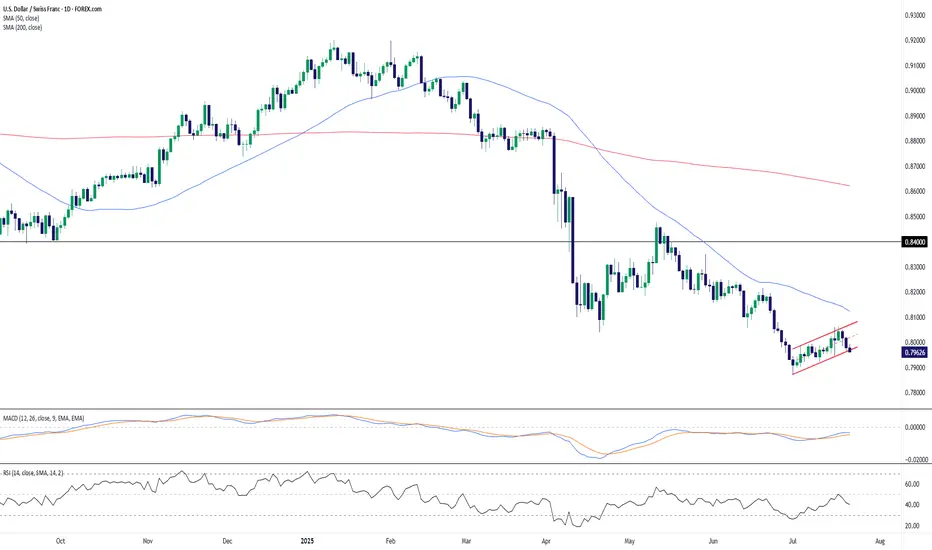
USD/CHF – Bearish Flag Forms Below Resistance, Trend Still DownUSD/CHF remains under pressure after a sustained downtrend and is currently consolidating within a potential bearish flag pattern. Price action has carved out a rising channel after the sharp June selloff, but the structure appears corrective rather than impulsive—suggesting the dominant bearish trend may soon resume.
The pair is struggling to hold the 0.7950–0.8000 zone and trades below both the 50-day (0.8124) and 200-day (0.8621) SMAs, confirming a bearish market structure. Momentum indicators also lean bearish: the MACD is below zero and has begun to curl lower again, while RSI hovers near 40, not yet oversold but lacking bullish momentum.
A breakdown below the flag’s lower boundary would confirm the continuation pattern, exposing 0.7900 initially, with scope toward fresh multi-month lows. On the upside, a close above 0.8100 would challenge the flag’s validity and place the 50-day SMA in focus as resistance.
Bias: Bearish continuation favored unless price breaks and holds above 0.8100. Flag breakdown would reconfirm downside momentum.
Time frame: Short-term (days)
-MW

EUR / NZD - Buy on H1Buy EUR / NZD at Current Market Price on H1.
Entry Price : 1.95746
Stop Loss : 1.94668
TP1 : 1:1
TP2 : 1:2
Confluences for the trade are as follows:
- Price is an upward Channel
- No Divergence Detected
- Price is retracing and is at the 0.5 to 0.618 level after breaking the last higher high

SIMPLEST SELL SETUP YOU'VE EVER SEEN...POTENTIAL USDJPY SHORTSHey hey Tradingview community!!! Hope you are all doing amazing! Just wanted to do a very detailed and complex breakdown for potential swing short opportunities I see for USDJPY...let's dive in!!
OK so first....lol
I'm kidding. Very simple. Look at the chart. Mark those zones to look for shorts. Swing trading opportunity...Love you all!!
Cheers!
OH...if you need the RSI settings it is the 7 period deviation. Cheers pt. 2!

Market analysis 7/22/2025Today we look in to AUD and JPY and discuss their fundamentals and also their relative strength. With strength and activity not matching the fundamentals outlined from this weeks and last weeks.
after review it did not appear that fundamentals were being followed currently. We have to respect this and continue to wait for our opportunity.
Bye for now.

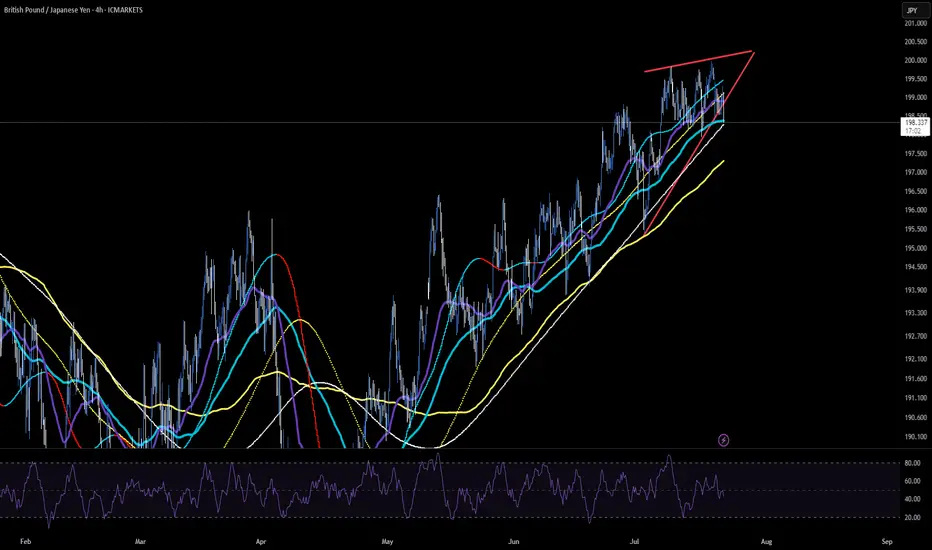
GBPJPY Reversal SetupFundamentals in Politics:
Japan's ruling coalition (Liberal Democratic Party and Komeito) has lost its majority in the upper house of parliament in recent elections. This is a significant setback for Prime Minister Shigeru Ishiba, though he has stated he will remain in office to combat inflation and continue trade talks with the US.
The election results indicate a surge in support for right-wing populist parties, fueled by public frustration over economic challenges like soaring rice prices and inflation exceeding wage growth. This weakened position for Ishiba's government could lead to legislative gridlock and impact future policy decisions, including those related to trade and the Bank of Japan's monetary policy.
JPY has been experiencing notable fluctuations, largely influenced by the recent election results and their potential implications for monetary policy:
Initial Yen Strength Post-Election: Following the weekend election results where Japan's ruling coalition lost its upper house majority, the Japanese Yen showed significant strength, gaining nearly 1% against the USD. This was somewhat counter-intuitive for some analysts who expected political uncertainty to be yen-negative.
However, technicall DRAGON ( GBPJPY) seem to make a correction after testing 200.000 line.
Closing below 197.000s will trigger a deeper bearish correction.
Good Luck!
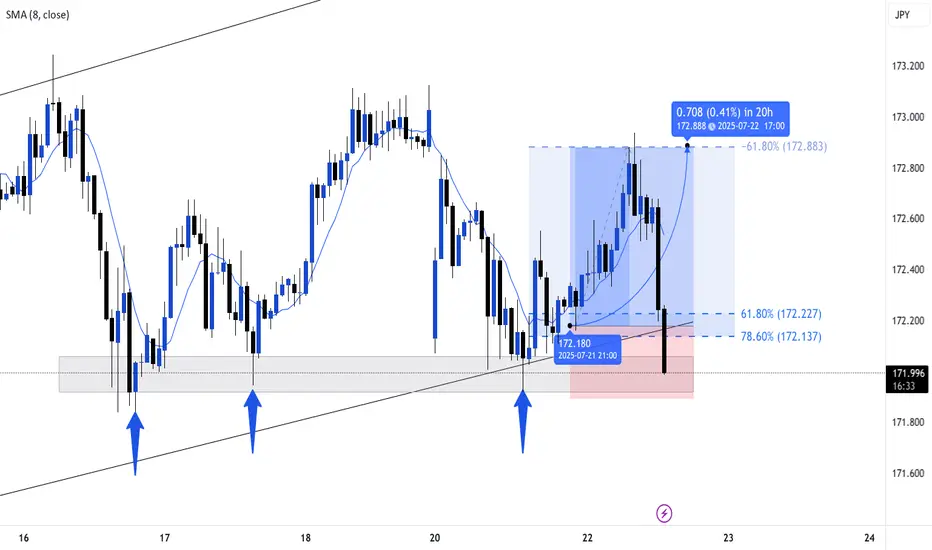
USDJPYUSDJPY showing short-term bearish momentum due to potential pullback and risk-off sentiment, but the long-term outlook remains bullish supported by U.S.–Japan rate differentials and BoJ's dovish stance.


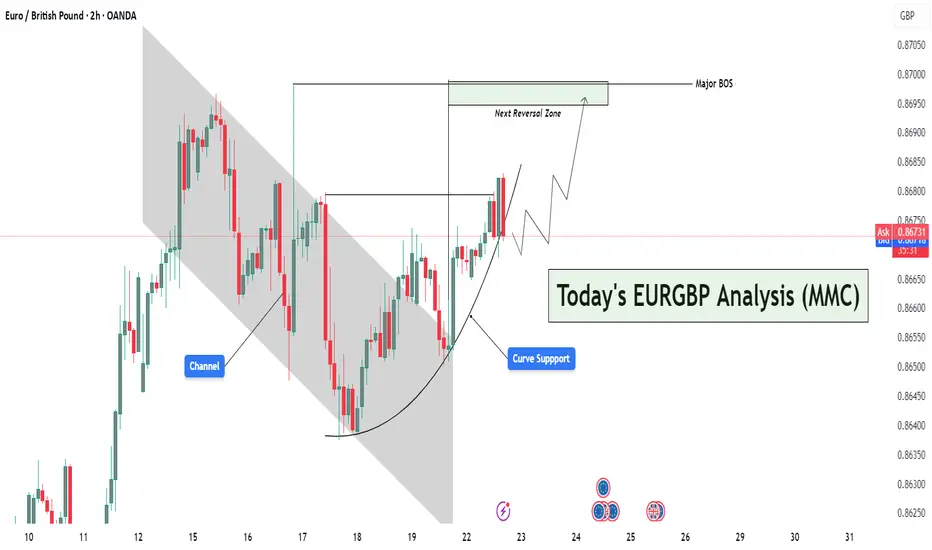
EURGBP Curved Support Breakout – Targeting Reversal Zone🔍 Market Context & Structural Narrative (MMC Style)
The EURGBP pair is currently displaying a textbook MMC structural evolution, transitioning from a bearish trend into a potential bullish leg driven by curve dynamics and trap-break logic.
🔨 Phase 1: Bearish Channel & Trap Formation
The market initially moved within a clearly defined descending channel, which acted as a trap for reactive sellers. Each lower high and lower low within the channel created a perception of sustained bearishness, luring breakout traders and late sellers into short positions.
✅ Key Insight:
This trap zone represents the first step in MMC logic — create a visible structure, generate bias, then prepare for inversion.
🌙 Phase 2: Curve Support – Psychological Accumulation
Around the base of the channel, the market began forming a rounded bottom or curve support. This is a signature MMC accumulation pattern, where market makers gradually absorb sell orders and build long positions without triggering immediate attention.
The curve support has the following implications:
Represents passive accumulation.
Suggests waning bearish pressure.
Builds bullish pressure subtly, often missed by retail traders.
🧠 MMC Mindset Tip:
Curved price action isn't just technical — it's psychological. It represents a controlled shift in sentiment, not an impulsive change, which is what makes it so powerful.
💥 Phase 3: Break of Structure (BOS) – Confirmation of Strength
Price breaks out of both the descending channel and the curved base, leading to a Major Break of Structure (BOS). This BOS is critical, as it confirms the invalidity of the previous bearish narrative and activates a new bullish leg.
📌 This BOS is more than a line — it’s a wall of liquidity getting broken. Price has now closed above key swing highs, which suggests:
Smart money is in control.
Trend shift is validated.
New demand zone created below.
🎯 Projection: The Path to the Next Reversal Zone (NRZ)
Following the breakout, price is projected to:
Possibly retest the breakout level (structure retest) aligned with the curve support — a healthy bullish pullback.
Then move higher towards the Next Reversal Zone (NRZ), which is your defined target area.
📌 NRZ Insight:
This zone is where the market is likely to face:
High liquidity.
Strong previous supply.
Potential profit-taking by early bulls.
Thus, this becomes the make-or-break zone — price either:
Reverses sharply,
Or breaks through and continues the bull rally.
⚠️ Multiple Scenarios Based on MMC Conditions
✅ Scenario 1: Retest & Bounce (Ideal MMC Setup)
Price pulls back to retest the breakout level or the curve support.
Shows bullish confirmation (e.g., pin bar, bullish engulfing).
Targets the NRZ above 0.8700.
❌ Scenario 2: Failed Retest – Fakeout Trap
Price breaks below the curve and structure again.
Suggests that the BOS was a false breakout.
Could re-enter the previous bearish channel structure.
🔄 Scenario 3: Direct Rally Without Retest
Strong momentum buyers push price directly to NRZ.
Wait for reaction at NRZ — could trigger a reversal or continuation depending on price behavior.
🧠 MMC Strategic Takeaways:
Trap → Break → Shift is the psychological framework in play.
The curve is not just support — it's evidence of silent accumulation.
The NRZ isn’t just resistance — it's the battleground where MM logic resolves.
🔐 Trading Insights (Optional Entry Ideas):
Entry: On bullish confirmation near 0.8660–0.8665 (curve/structure support).
SL: Below curve base (e.g., 0.8640).
TP: Near or slightly below NRZ (0.8700–0.8705), partial profits or full exit.
ELLIOTT WAVE EURUSD H4 update
EW Trade Set Up H4
subminuette W4 seems finished
monitor the breakout of the descending channel that appears to contain wave IV
The bullish movement that started on July 17th must assume a 5-wave pattern
key levels (area)
1.1705
1.1684 POC
1.1654
note :
the breakout upwards of the leading span B (red line) by the lagging span (green line) will confirm the start of a bullish movement in the subminuette wave v.
Failure to break above price levels 1.1684 and 1.1705 will result in a recalculation of the waves count


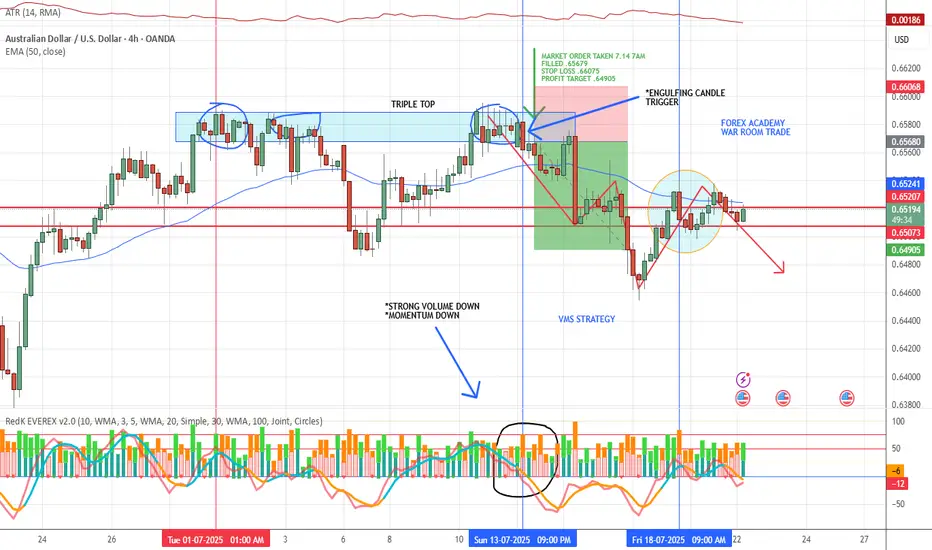
VMS STRATEGY APPLIED📈 VMS Strategy – Triple Top Win Example
We took this trade last Monday based on a textbook triple top reversal:
✅ Clean engulfing candle at resistance
✅ Strong downward volume
✅ Momentum clearly shifting in the trade direction
✅ Perfect timing with all elements aligning
On the 4-hour chart, we focus on specific reversal patterns within the VMS framework:
***Triple tops/bottoms
***Head & shoulders
***1-2-3 formations
***Hammer and shooting star reversals
Each setup must meet all VMS criteria before being considered.
A quick note on back testing:
We know traditional back testing can feel flawed—but here’s what works for us:
Start at the beginning of the month, hide future candles, and scan for VMS setups in real-time conditions. The trade either fits the rules—or it doesn’t. There’s no debate.
We’re not claiming perfection. This strategy does take losses—sometimes multiple in a row. But over time, through strict rule-following and patience, we’ve found consistency and success.
If this helps you, feel free to share it—or even just take a closer look.
With respect, always test it for yourself before trading live.
We’re here to share what’s working for us. We welcome thoughts and suggestions—but know this:
👉 This is a rules-based strategy rooted in discipline, not prediction.
🔒 Aligned Execution is the Edge.

PAIRS WITH JPY QOUTES MOVING THE SAME IN RECENT DAYSSo in my previous analyses, i did talk talk about shorting all jpy quote pairs and yen gaining strength this week. this chart shows the similar movements accross all board


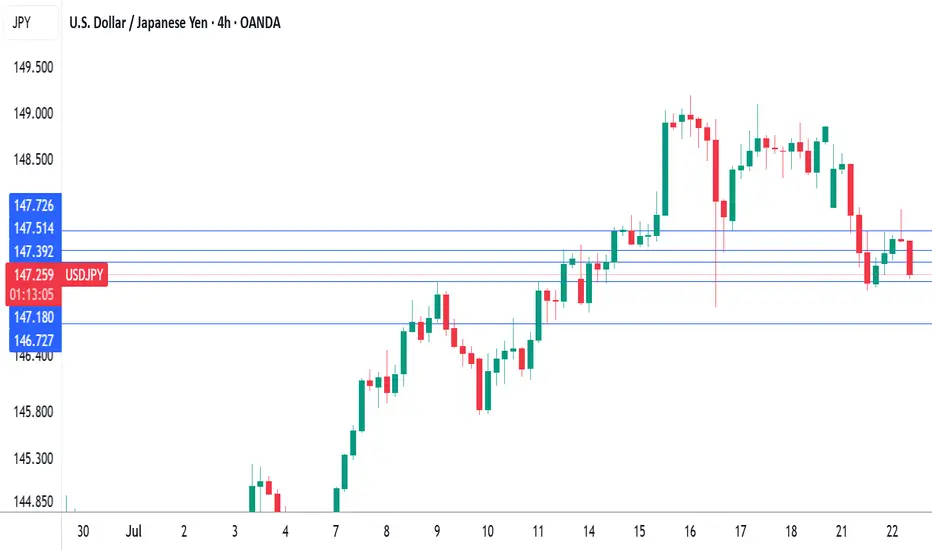
Japan's coalition loses majority, yen higherThe Japanese yen has started the week with strong gains. In the European session, USD/JPY is trading at 147.71, down 0.07% on the day.
Japanese Prime Minister Ishiba's ruling coalition failed to win a majority in the election for the upper house of parliament on Sunday. The result is a humiliating blow to Ishiba, as the government lost its majority in the lower house in October.
The stinging defeat could be the end of the road for Ishiba. The Prime Minister has declared he will remain in office, but there is bound to be pressure from within the coalition for Ishiba to resign.
The election result was not a surprise, as voters were expected to punish the government at the ballot box due to the high cost of food and falling incomes. The price of rice, a staple food, has soared 100% in a year, causing a full-blown crisis for the government, which has resorted to selling stockpiled rice from national reserves to the public.
The election has greatly weakened Ishiba's standing, which is bad news as Japan is locked in intense trade talks with the US. President Trump has warned that he will impose 25% tariffs on Japanese goods if a deal isn't reached by August 1. Japan is particularly concerned about its automobile industry, the driver of its export-reliant economy.
The Bank of Japan meets on July 31 and is widely expected to continue its wait-and-see stance on rate policy. The BoJ has been an outlier among major central banks as it looks to normalize policy and raise interest rates. However, with the economic turbulence and uncertainty due to President Trump's erratic tariff policy, the Bank has stayed on the sidelines and hasn't raised rates since January. Japan releases Tokyo Core CPI on Friday, the last tier-1 event before the rate meeting.
There is resistance at 148.39 and 149.08
147.95 and 147.70 are the next support levels
USDCHF looking Bearish!!USDCHF Looking for sell side as it holding at trendline support.
Safe Player go after breaking trendline and risky can look out for now before the US Session.
Support Zone is 0.79200, We can expect a buy from that zone or Buys above 0.79900 after breaking and retesting the resistance.
