USDJPY ShortPrice in currently on a downtrend on the 4H timeframe. Price formed an orderblock on the 15 min timeframe and a FVG on the 15 min timeframe after the orderblock had formed. Stoploss is at 147.580 and take profit is at 147.160
Forex market

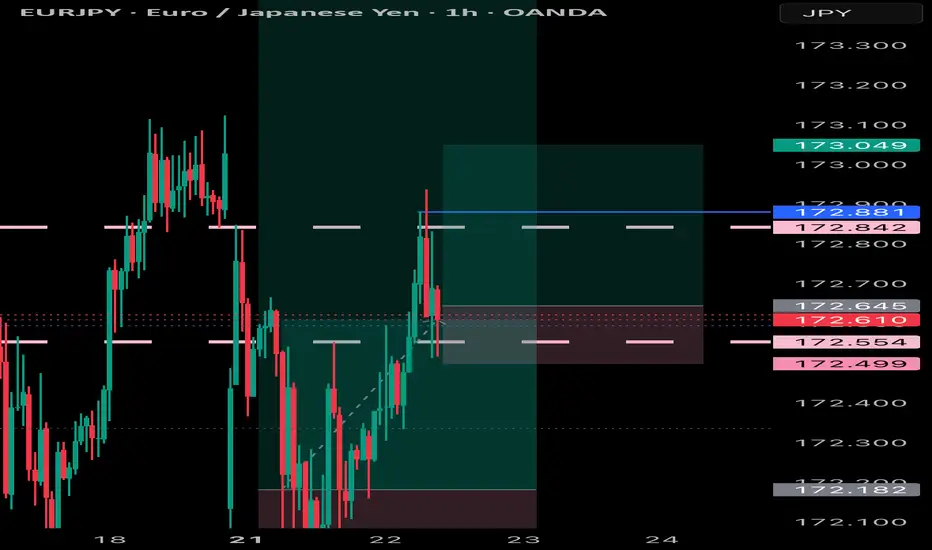
USD/JPY probable move Target 1 waiting for confirmationWaiting for confirmation on candles and Real Volume 5min or 15min (power of Real Volume)-without real volume I am like a blind man in a dense forest :)
Tools:
- real volume (proper interpretation)
- Fibonacci expansion ABC (an additional, new goal every day)
- Fibonacci retracement (combined with the real volume, it shows me the real probable movement for the next hours and days)
- volume support and resistance levels (confirmation of the price recovery level)
- oversold/overbought index (focusing on 1H and 4H something is already overvalued or undervalued)
- candlestick patterns (my entry point for 5 minutes or 15 minutes candlestick formations confirmed by particularly increasing volume).

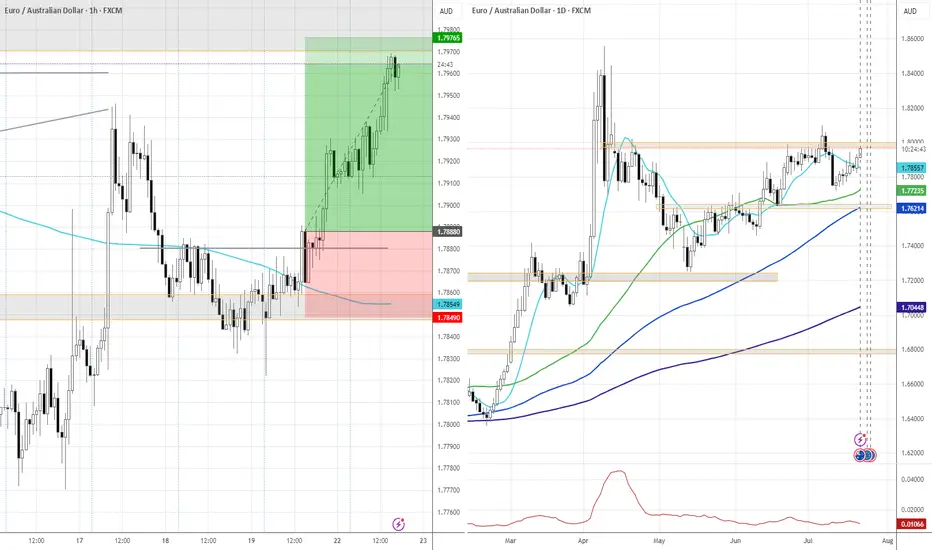
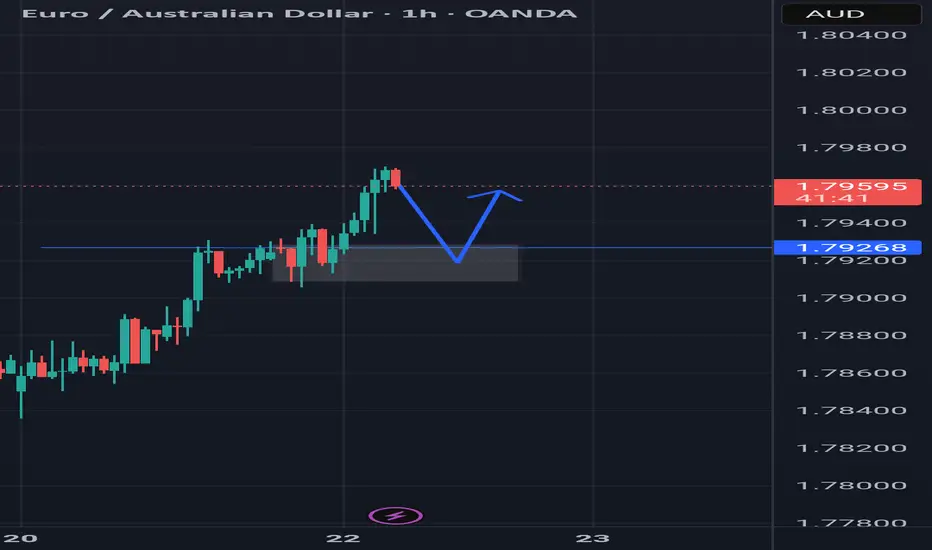
EURAUD~+ RBA is dovish
~+ Recent AU weak labor data
~+ The euro has been in the role of a safe haven recently
GBPUSDLong opportunity
- broke through 4 hr descending trendline
- you can see CHOCH where the grey dashed box is
- continues bullish now
- order block where blue dashed box is
- bullish candle engulfed the previous bearish candle ( this is where i entered )
- SL below demand zone
- TP at major supply zone

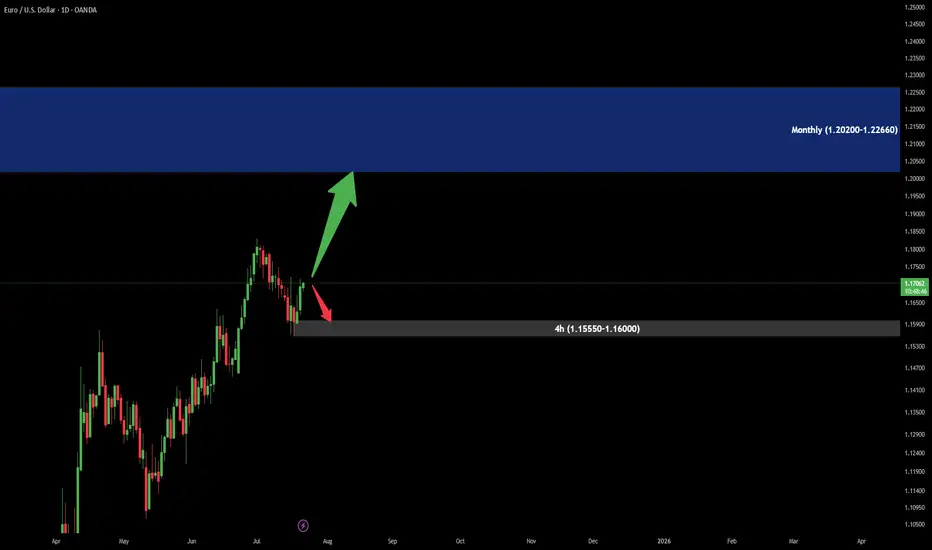
EuroUsd Analysis in MidtermTrend is UP!
As we can see there is a Supply area in monthly Time Frame around (1.20200-1.22660).
Price should have a good reaction there.
In lower Time Frame there is Demand area (in 4hour), which could be a good Buy position.
UP TREND Simple up trend that is being followed and respected here by the price , we BULLS are in control
idealistic trade of usdchfsharing my insights of the trade that im holding .....hopefull this will educate lot of people out the ....................

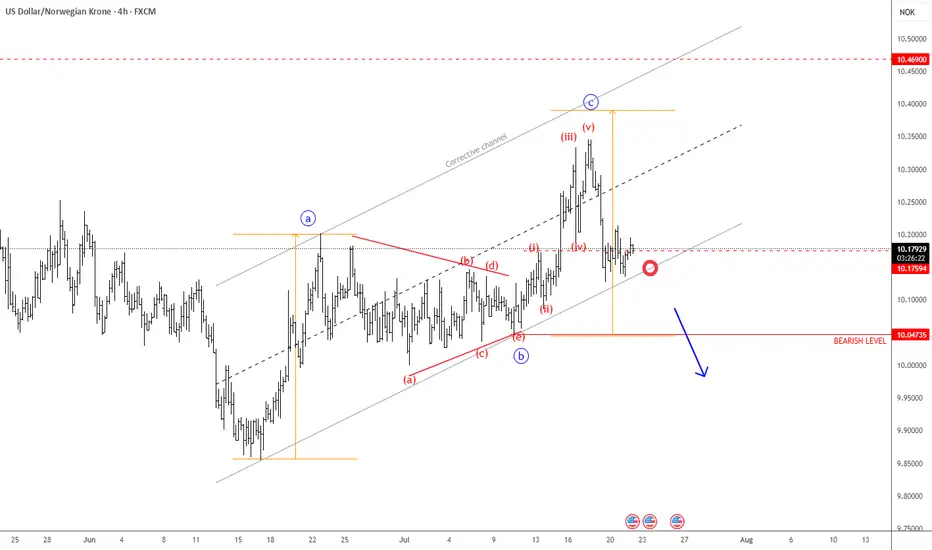
USDNOK Remains BearishUSDNOK made a three-wave rise from the recent low, indicating an abc correction within a downtrend—especially considering the triangle in wave "b" in the middle, and the current sharp decline following a completed five-wave impulse in wave "c". As long as this structure remains intact, there is still a risk of another leg lower. Therefore, we can expect further weakness toward the June lows, especially if it breaks below the channel support line. Just watch out for short-term intraday pullbacks.
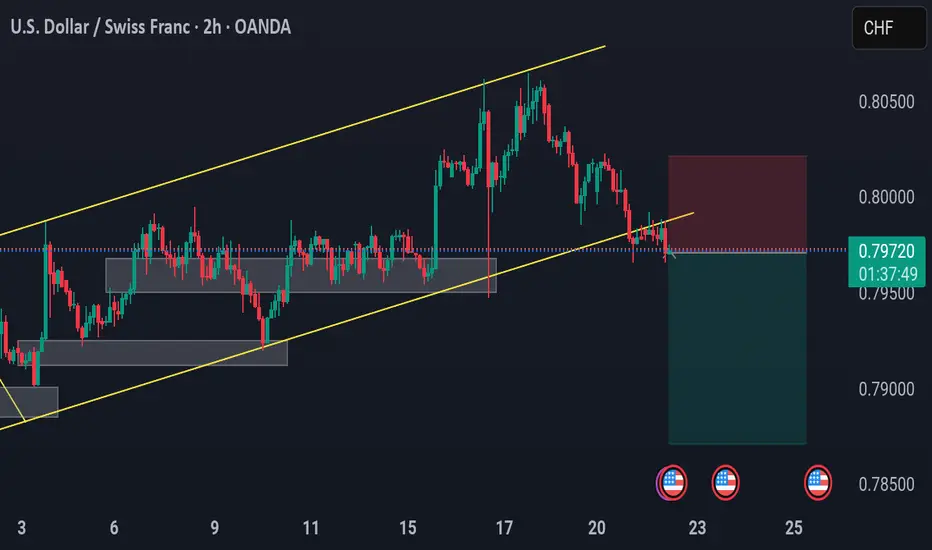
USD/CHF – Channel Breakdown & Bearish Rejection SetupUSD/CHF – Channel Breakdown & Bearish Rejection Setup
🔹 2H Chart by PULSETRADESFX
USD/CHF has broken below its ascending channel structure after multiple rejections at key resistance. Price is now retesting the underside of the broken trendline, presenting a clean break–retest–drop setup.
Sellers stepped in just below 0.80000, and momentum now leans bearish toward the next key demand around 0.79000.
📌 Trade Setup:
Entry: 0.79714
SL: 0.80050 (Above trendline)
TP: 0.78750 (Previous demand zone)
This setup is ideal for short-term continuation traders looking to ride the bearish momentum as structure breaks align with market reaction.
---
✅ Confluence Checklist:
Ascending channel break
Bearish retest confirmation
Supply zone reaction near 0.80000
Risk-to-reward > 2:1
Clean structure and price action
📅 July 22, 2025
📊 OANDA Feed | USD/CHF (2H)
#USDCHF #ForexTrading #BearishBreakdown #SupplyZone #PriceAction #TechnicalSetup #TradingView #PULSETRADESFX
EurAud buy setupSnrc1 setup align with htf trend
When market reach this zone try to find ltf entry 5m 15m
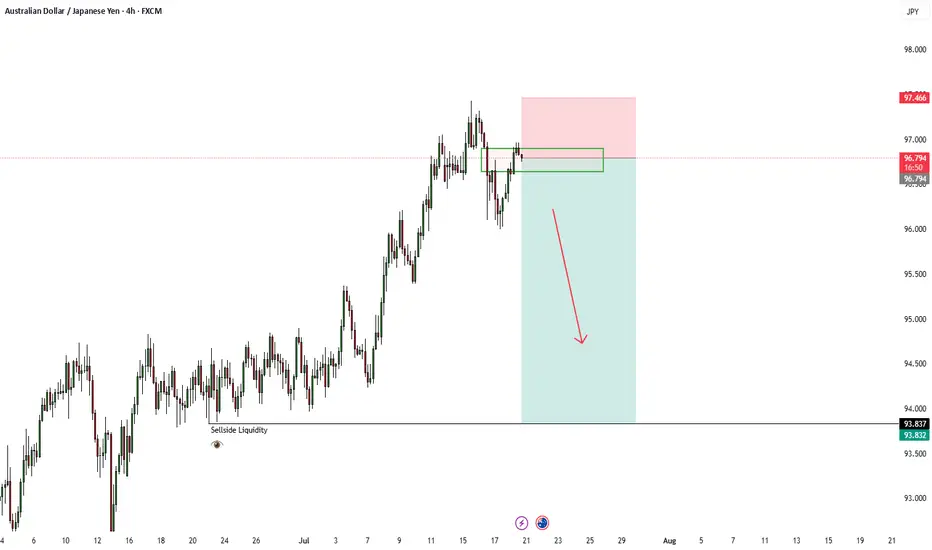
AUDJPY 1:4.41 R Trade Idea on a bearish scenario - ICTBullish on JPY, 1:4.41 R on this AUDJPY short aiming for the sell side liquidity
EURHUF Long OANDA:EURHUF Long Trade, with my back testing of this strategy, it hits multiple possible take profits, manage your position accordingly.
Note: Manage your risk yourself, its risky trade, see how much your can risk yourself on this trade.
Use proper risk management
Looks like good trade.
Lets monitor.
Use proper risk management.
Disclaimer: only idea, not advice

GBPJPY Looking Bullish in the 30 minute Timeframe Since markets are dynamic, I identify both bullish and bearish trading opportunities whenever this strategy appears at equilibrium levels

Trade Uni Long EURAUDKeep it simple, go long in trend on bullish momentum shifts. Learning structure and applying it correctly will help advance your trading career.

AUDCHF SHORT TRADE PLANThe pair is trading in a global bearish trend. It recently tested a falling trendline and approaching a key zone. If this zone is broken below, it will be an indication of a bearish trend.
Please do your own analysis before placing any trades.
Cheers and Happy Trading !!!!

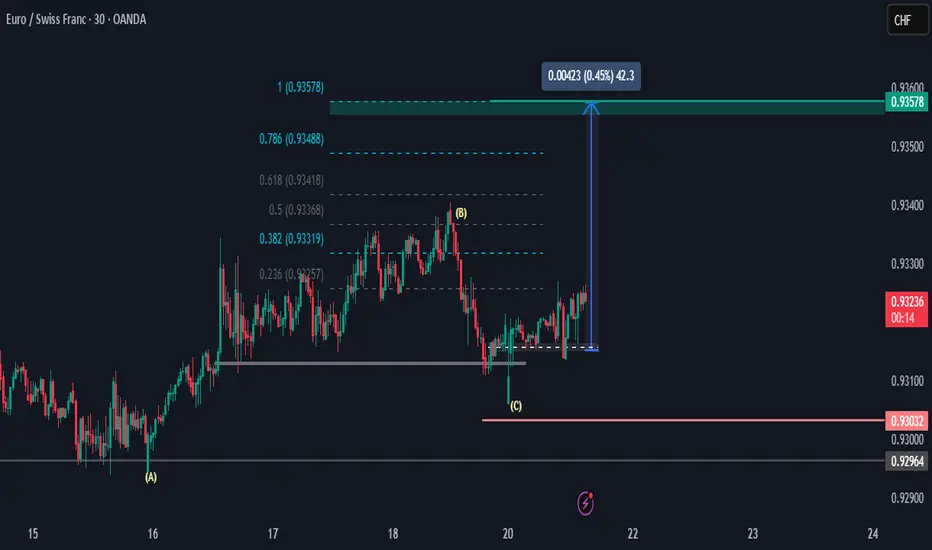
EURCHF Price Is looking UpHi there,
The EURCHF looks bearish at the M30, with the first resistance target potentially being 0.93319. I anticipate for the price to reach above area (B) into the 0.93419 price area for a potential push up to the 0.93488 area, and if momentum is strong in the higher time frames, then the bias is set for 0.93578.
Happy Trading,
K.
Not trading advice.
The EUR & the USD. Events that can affect the move this weekThis week we are monitoring EUR and USD carefully, as we could see some interesting moves, due to some events on the economic calendar. Let's dig in.
FX_IDC:EURUSD
MARKETSCOM:EURUSD
TVC:DXY
MARKETSCOM:DOLLARINDEX
Let us know what you think in the comments below.
Thank you.
75.2% of retail investor accounts lose money when trading CFDs with this provider. You should consider whether you understand how CFDs work and whether you can afford to take the high risk of losing your money. Past performance is not necessarily indicative of future results. The value of investments may fall as well as rise and the investor may not get back the amount initially invested. This content is not intended for nor applicable to residents of the UK. Cryptocurrency CFDs and spread bets are restricted in the UK for all retail clients.

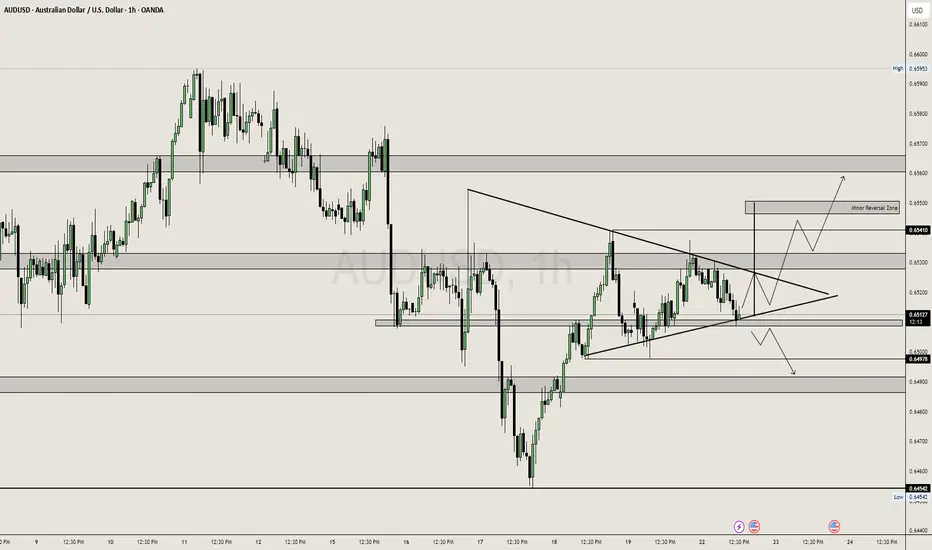
AUDUSD: Symmetrical Triangle
Price is consolidating inside a symmetrical triangle, showing indecision between bulls and bears.
Before entering the triangle, the market showed strong bullish momentum, indicating a possible continuation pattern.
Price is hovering near a key support level (0.6513) where multiple candle wicks suggest buying pressure is defending.
🔍 Key Zones & Levels:
Support (0.6500–0.6510):
Price is reacting strongly here.
A break below this = bearish pressure → could retest lower demand zones.
Resistance (0.6530–0.6541):
Mid-structure resistance.
Clean breakout above this confirms bullish control.
Minor Reversal Zone (0.6555):
If bulls break above triangle, this area may stall price or reverse short term.
Ideal area for TP or trailing SL.
Demand Zone (0.6454):
Strong historical buy zone.
Only likely to hit if triangle breaks down aggressively.
📈 Bullish Scenario:
If price breaks and closes above triangle + 0.6530 zone, expect:
Rally to 0.6541 (first target)
Extension toward 0.6555 where reversal/supply could kick in.
Momentum and volume confirmation needed — no breakout = no trade.
📉 Bearish Scenario:
If price breaks below triangle & 0.6500, expect:
Drop to 0.6490 (minor support)
Further slide toward 0.6454 (major support) if downside accelerates.
Could the Cable bounce from here?The price is falling towards the pivot, which lines up with the 50% Fibonacci retracement and could bounce to the 1st resistance.
Pivot: 1.3462
1st Support: 1.3402
1st Resistance: 1.3532
Risk Warning:
Trading Forex and CFDs carries a high level of risk to your capital and you should only trade with money you can afford to lose. Trading Forex and CFDs may not be suitable for all investors, so please ensure that you fully understand the risks involved and seek independent advice if necessary.
Disclaimer:
The above opinions given constitute general market commentary, and do not constitute the opinion or advice of IC Markets or any form of personal or investment advice.
Any opinions, news, research, analyses, prices, other information, or links to third-party sites contained on this website are provided on an "as-is" basis, are intended only to be informative, is not an advice nor a recommendation, nor research, or a record of our trading prices, or an offer of, or solicitation for a transaction in any financial instrument and thus should not be treated as such. The information provided does not involve any specific investment objectives, financial situation and needs of any specific person who may receive it. Please be aware, that past performance is not a reliable indicator of future performance and/or results. Past Performance or Forward-looking scenarios based upon the reasonable beliefs of the third-party provider are not a guarantee of future performance. Actual results may differ materially from those anticipated in forward-looking or past performance statements. IC Markets makes no representation or warranty and assumes no liability as to the accuracy or completeness of the information provided, nor any loss arising from any investment based on a recommendation, forecast or any information supplied by any third-party.

Bullish bounce off major support?USD/JPY is falling towards the pivot, which acts as an overlap support and could bounce to the 1st resistance, which is a swing high resistance.
Pivot: 145.96
1st Support: 144.98
1st Resistance: 149.18
Risk Warning:
Trading Forex and CFDs carries a high level of risk to your capital and you should only trade with money you can afford to lose. Trading Forex and CFDs may not be suitable for all investors, so please ensure that you fully understand the risks involved and seek independent advice if necessary.
Disclaimer:
The above opinions given constitute general market commentary, and do not constitute the opinion or advice of IC Markets or any form of personal or investment advice.
Any opinions, news, research, analyses, prices, other information, or links to third-party sites contained on this website are provided on an "as-is" basis, are intended only to be informative, is not an advice nor a recommendation, nor research, or a record of our trading prices, or an offer of, or solicitation for a transaction in any financial instrument and thus should not be treated as such. The information provided does not involve any specific investment objectives, financial situation and needs of any specific person who may receive it. Please be aware, that past performance is not a reliable indicator of future performance and/or results. Past Performance or Forward-looking scenarios based upon the reasonable beliefs of the third-party provider are not a guarantee of future performance. Actual results may differ materially from those anticipated in forward-looking or past performance statements. IC Markets makes no representation or warranty and assumes no liability as to the accuracy or completeness of the information provided, nor any loss arising from any investment based on a recommendation, forecast or any information supplied by any third-party.

NZDCAD Long Trade Risking 1% to make 1.37%OANDA:NZDCAD Long Trade, with my back testing of this strategy, it hits multiple possible take profits, manage your position accordingly.
Note: Manage your risk yourself, its risky trade, see how much your can risk yourself on this trade.
Use proper risk management
Looks like good trade.
Lets monitor.
Use proper risk management.
Disclaimer: only idea, not advice

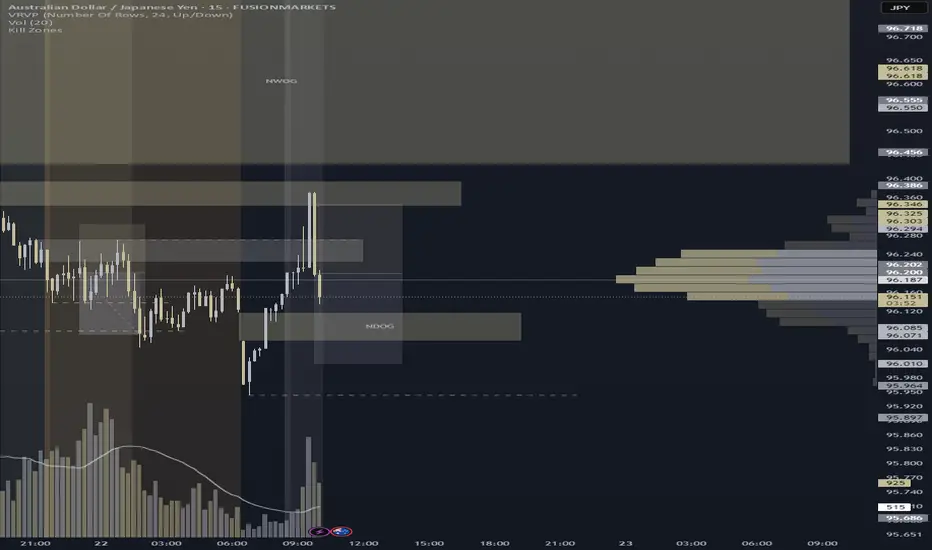
AUDJPY – Resistance Rejection Short Into Sellside Draw
Identified a key resistance zone at 96.224–96.273, with price showing rejection and wicking behavior after sweeping buyside liquidity at 96.271. Entered short following a decisive reaction candle. Trade is structured with stop loss above the swing at 96.303 and TP set at 96.010, targeting a clean overshoot of today’s NDOG (95.944).
🔹 Setup: Resistance rejection + liquidity sweep
🔹 Bias: Short into engineered sellside draw
🔹 SL: 96.303 | TP: 96.010
🔹 Narrative: Trap-to-draw execution with structure-backed confirmation
A disciplined short campaign rooted in polarity logic and session magnet flow. Let the market walk its choreography. 🩶