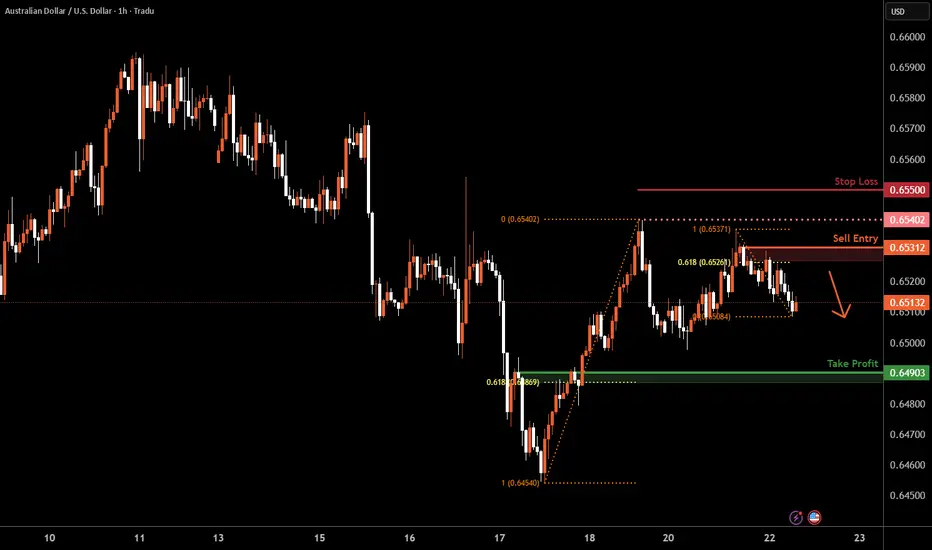
Aussie H1 | Swing-high resistance at a 61.8% Fibo retracementThe Aussie (AUD/USD) is rising towards a swing-high resistance and could potentially reverse off this level to drop lower.
Sell entry is at 0.6531 which is a swing-high resistance that aligns closely with the 61.8% Fibonacci retracement.
Stop loss is at 0.6550 which is a level that sits above a swing-high resistance.
Take profit is at 0.6490 which is a pullback support that aligns with the 61.8% Fibonacci retracement.
High Risk Investment Warning
Trading Forex/CFDs on margin carries a high level of risk and may not be suitable for all investors. Leverage can work against you.
Stratos Markets Limited (tradu.com ):
CFDs are complex instruments and come with a high risk of losing money rapidly due to leverage. 66% of retail investor accounts lose money when trading CFDs with this provider. You should consider whether you understand how CFDs work and whether you can afford to take the high risk of losing your money.
Stratos Europe Ltd (tradu.com ):
CFDs are complex instruments and come with a high risk of losing money rapidly due to leverage. 66% of retail investor accounts lose money when trading CFDs with this provider. You should consider whether you understand how CFDs work and whether you can afford to take the high risk of losing your money.
Stratos Global LLC (tradu.com ):
Losses can exceed deposits.
Please be advised that the information presented on TradingView is provided to Tradu (‘Company’, ‘we’) by a third-party provider (‘TFA Global Pte Ltd’). Please be reminded that you are solely responsible for the trading decisions on your account. There is a very high degree of risk involved in trading. Any information and/or content is intended entirely for research, educational and informational purposes only and does not constitute investment or consultation advice or investment strategy. The information is not tailored to the investment needs of any specific person and therefore does not involve a consideration of any of the investment objectives, financial situation or needs of any viewer that may receive it. Kindly also note that past performance is not a reliable indicator of future results. Actual results may differ materially from those anticipated in forward-looking or past performance statements. We assume no liability as to the accuracy or completeness of any of the information and/or content provided herein and the Company cannot be held responsible for any omission, mistake nor for any loss or damage including without limitation to any loss of profit which may arise from reliance on any information supplied by TFA Global Pte Ltd.
The speaker(s) is neither an employee, agent nor representative of Tradu and is therefore acting independently. The opinions given are their own, constitute general market commentary, and do not constitute the opinion or advice of Tradu or any form of personal or investment advice. Tradu neither endorses nor guarantees offerings of third-party speakers, nor is Tradu responsible for the content, veracity or opinions of third-party speakers, presenters or participants.
Forex market
Yen Holds Firm as Ishiba Stays in OfficeThe yen hovered around 147.5 per dollar on Tuesday, holding its 1% gain as markets digested Japan’s election outcome. Despite the ruling coalition losing its upper house majority, Prime Minister Shigeru Ishiba is likely to stay in office, easing political concerns. Ishiba confirmed his continued involvement in US trade negotiations. Meanwhile, opposition parties are expected to advocate for fiscal stimulus and tax cuts, which could pressure the yen and push bond yields higher. Trade discussions with the US remain on schedule for the August 1 deadline.
Resistance is at 147.75, with major support at 146.15.
AUDUSD holding, Might Trigger a Upside MoveAUDUSD is still in Solid Sideways Range in Daily Chart. More Probabilities looking towards buy side, looking for liquidity at 0.66880.
It's in Range since 18 April, 2025 and hunting liquidity for both the buyers and sellers. Possibly it could trap seller and go in Buy Side.
In other case, The Sell Momentum can come if it breaks and holds below the 0.64500 Level. Then we can expect a sell momentum till the support level of 0.63400.
Daily is in Range so we can Predict the Price more clearly but if any of level from support or resistance breaks we can see a long-term Opportunity.

EURUSD Consolidating now, but soon may reveal a new trend!!!EURUSD is consolidating between the red box shown. Previously, it can be seen that, this whole area between 1.17050 and 1.16630 is very choppy, and not the best area to place any trades.
Look at the market structure latest HH. If price pushes above 1.17050, we will continue in an uptrend, and then we will look for BUYS.
Now, look at the red trendline drawn. It is interacting with the consolidation zone. We have a very small pullback at the red arrow drawn. It exactly sits at 1.16630.
The point is, if price goes below that level, we will know that price is respecting the trendline and would most likely continue moving down. Therefore, we look for SELLS.
Obviously, we dont want to get caught in any fakeouts. So we will further look at how the candles are being formed later and what story they tell.
Now we wait and watch.

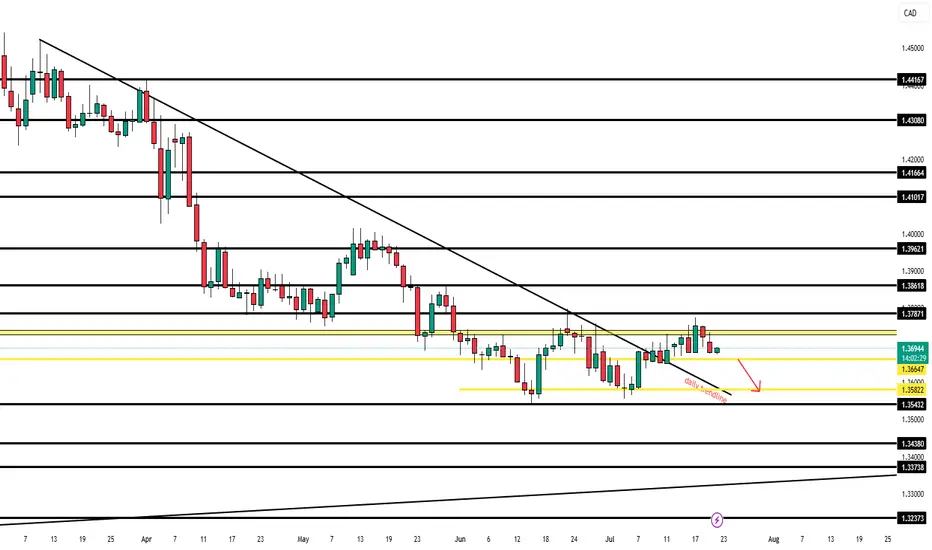
🇨🇦 USDCAD — July 22nd OutlookCurrent Price Behaviour:
USDCAD remains rangebound, sitting just above our key support level of 1.36647. The pair has failed to show any clean breakouts since Monday and remains stuck inside a tight intraday channel.
What We're Watching:
📍 Break of 1.36647 = trigger for continuation of bearish move
🎯 Target: 1.35822 (80 pip move)
⚠️ No active trade until this breaks — structure still unclear
HTF Bias: Bearish
Current Play: Stay out until 1.36647 breaks cleanly with strong momentum and volume. That level unlocks a smoother sell opportunity into our first target.
-CHFJPY (185,175 to 184,510CHFJPY will decline in today's market session. Price is providing entry opportunities as it reaches higher into the resistance.

Fundamental Market Analysis for July 22, 2025 EURUSDThe euro is trading near 1.1700, having retreated from an intraday high of 1.1720 after the release of the final June U.S. CPI figures, which confirmed a slowdown in inflation to 2.7% y/y and 0.1% m/m while keeping the core reading steady at 3.1%. The brief rise in risk appetite quickly gave way to stronger demand for the dollar as the probability of the Fed’s first rate cut in September fell from 65% to 55%.
Additional pressure on the euro comes from the yield differential: 10-year U.S. Treasuries hover around 4.45%, while German Bunds yield only 2.30%. The gap of more than 215 bp encourages capital to flow from the eurozone into dollar assets, supporting USD demand.
Fundamentally, risks for the euro remain tilted to the downside: after June’s rate cut the ECB said further moves depend on price dynamics, and the eurozone composite PMI dropped to 50.1 – the brink of stagnation. Against the backdrop of weak continental activity and moderate yet persistent U.S. inflation, the pair may test support at 1.1615 in the coming sessions, especially if U.S. durable-goods orders exceed forecasts.
Trading recommendation: SELL 1.1700, SL 1.1720, TP 1.1615

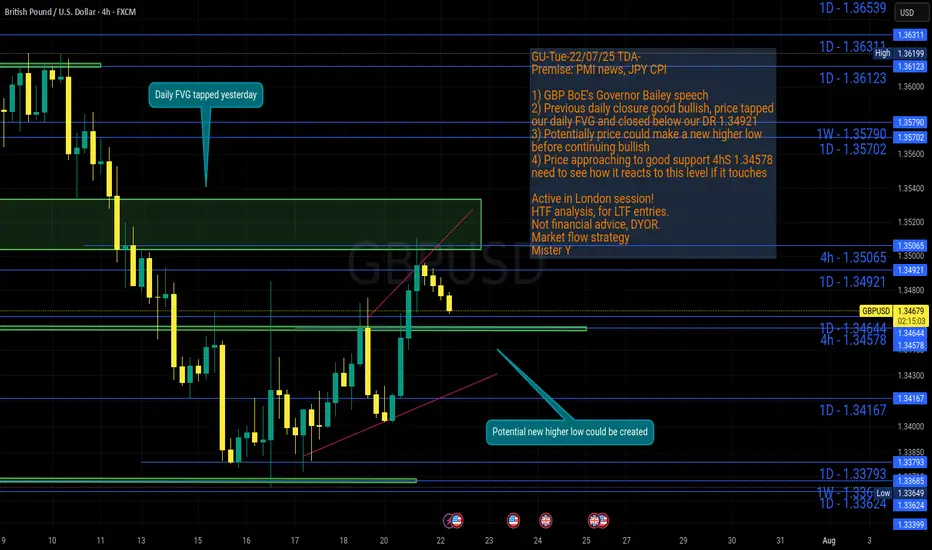
GU-Tue-22/07/25 TDA-Potential new higher low before continue?Analysis done directly on the chart!
Price gave a good bullish closure on daily candle yesterday,
if bullish trend continues, there's a good probability for price
to create a new higher low before continuing up.
Monitor and react to how price move from level to level.
Premise:
A simple idea plan (like Tradingview public posts) won't describe everything.
No one can predict how market will move, it's always good to react to how it moves.
It gives an idea of how price might move, but no one come from FUTURE.
So I always encourage people to openly and actively discuss in real time.
I don't give signals blindly, people should learn
and understand the skill.
Following blindly signals you won't know how to
manage the trade, where precisely put sl and tp,
lot size and replicate the move over time.
That's why you need active real time discussions.
Trading is not get rich quick scheme!
Active in London session!
Not financial advice, DYOR.
Market Flow Strategy
Mister Y
Bullish Setup Loading: Watching Structure & Confirmation ZonesHello Traders,
Price is currently in a counter-trend pullback phase, showing signs of temporary weakness within a larger bullish context. Patience is key as we wait for price to build structure and break the internal Lower High (LH), which would act as an early signal of bullish continuation.
The 4-hour internal structure remains strongly bullish, following a clean mitigation of the daily bullish continuation demand zone. A long setup from a 4H Point of Interest (POI), backed by Lower Timeframe (LTF) confirmation, offers a high-probability trade aligned with the higher timeframe trend. Confirmation through structural shifts will reduce risk and increase confidence in directional bias.

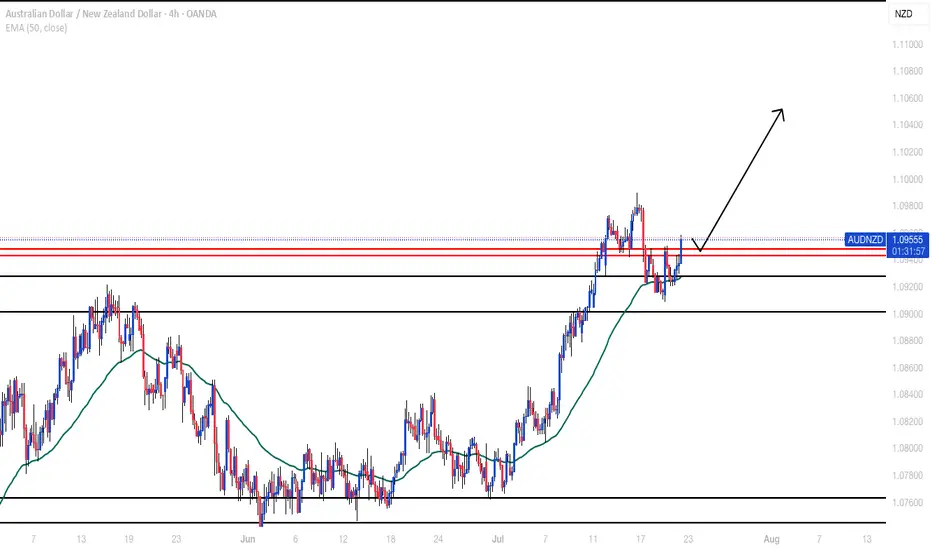
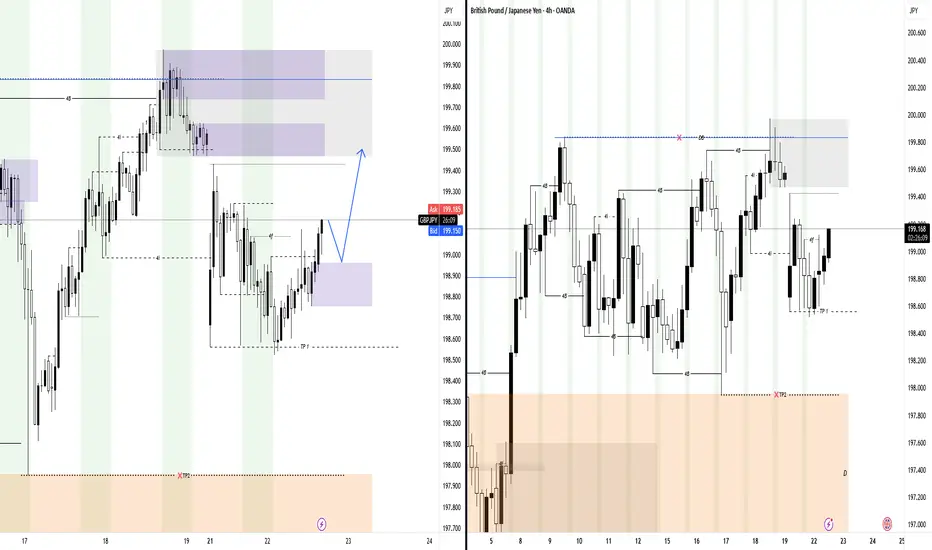
Bullish Shift After Liquidity Sweep – Eyes on BSL & Weekly GapHello Traders,
As per yesterday’s analysis, price successfully swept the weak internal lower low (LL), but failed to close below structure. Instead, price has shifted bullish, indicating that sellers were overpowered by buyers at that level.
Before considering any trading decisions, I would like to see price take out the Buy-Side Liquidity (BSL) to confirm the bullish intent. Additionally, note that the new weekly gap on the 4-hour timeframe remains unfilled, which could act as a magnet for price in the short term.
AUD USD short as it appears it seems there is a breakout don't rush to it it 90 percent of the time pull back to the original price yet i couldn't find better risk to reward ration on other prices lets see ...
Please note: This is for educational purposes only and not a trading signal. These ideas are shared purely for back testing and to exchange views. The goal is to inspire ideas and encourage discussion. If you notice anything wrong, feel free to share your thoughts. In the end, to learn is to share !

USDJPY InsightHello to all our subscribers!
Please feel free to share your personal opinions in the comments. Don’t forget to hit the boost and subscribe buttons!
Key Points
- There were speculations that the Liberal Democratic Party’s election defeat in Japan could lead to Prime Minister Ishiba’s resignation. However, Ishiba announced that he will remain in office, easing concerns and reducing political risk.
- U.S. Treasury Secretary Scott Bessent stated that negotiations are progressing swiftly but emphasized there is no rush to reach a deal. Meanwhile, U.S. Commerce Secretary Howard Lutnick commented that reciprocal tariffs will proceed as scheduled, although negotiations can still continue.
- With the FOMC meeting scheduled for July 31, attention is focused on Fed Chair Powell’s speech on July 22, which is expected to provide clues about the future path of monetary policy.
Key Economic Events This Week
+ July 22: Fed Chair Powell’s speech
+ July 24: ECB interest rate decision
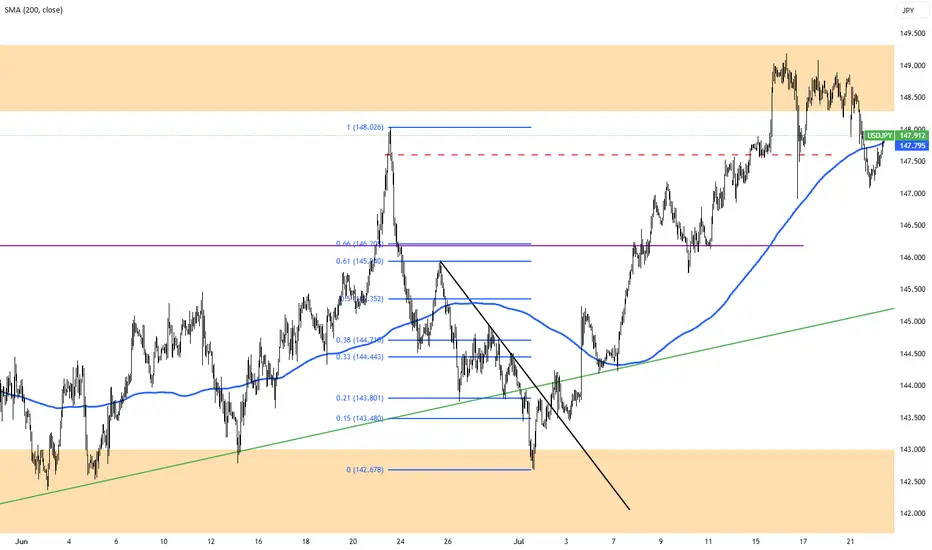
USDJPY Chart Analysis
After breaking above the 148 level and extending gains to the 149 level, the pair quickly reversed and pulled back to the 147 level. Currently, a further decline toward the 146 level appears likely, with strong support expected there. If confirmed, a rebound toward the 151 level is highly probable. However, if price action deviates from expectations, we will promptly revise our strategy.

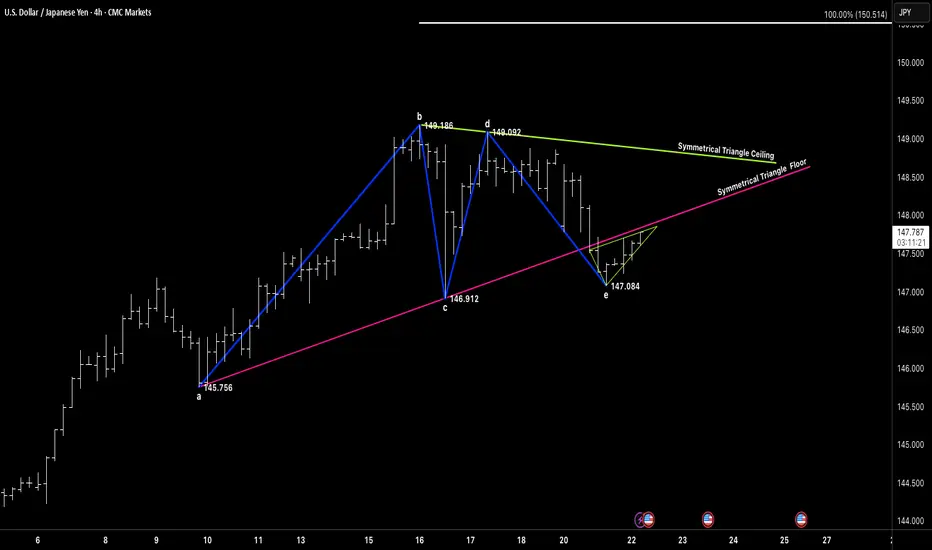
SYMMETRICAL TRIANGLEGood morning and good afternoon traders, wherever you're dialed in from.
Hope y’all are stacking those pips this week — whether you’re trend-riding, countering swings, or just sitting back letting setups come to you. 🔍
We’ve been hitting precise targets lately, and the tape’s been speaking loud and clear. Doesn’t matter what the sentiment says — we follow price, we follow structure.
Right now, we’ve got a clean symmetrical triangle unfolding on USDJPY (4H). Marked up from point a to e, with that little fakeout dip at E (147.084) acting like a trap for the impatient. Textbook spring behavior.
What catches my eye is the way price is coiling tight between the triangle’s ceiling and rising floor. We’re hovering just under 147.80, and a decisive push through that ceiling could unlock a sharp move toward the 150.50 zone (symmetrical projection).
If you missed the earlier leg, don’t chase — let price show you real intent. A confirmed breakout above 148.00 is the trigger. If we break back below 146.90, reassess.
No need to guess — we observe, we react. Let the market come to us.
“We don’t force trades. We trade when the market invites us.”
USD CHF longcan happen yet still its against the daily trend but as i said till you have good lines and risk to reward ration you don't have to worry ...
Please note: This is for educational purposes only and not a trading signal. These ideas are shared purely for back testing and to exchange views. The goal is to inspire ideas and encourage discussion. If you notice anything wrong, feel free to share your thoughts. In the end, to learn is to share !

Eurousd techinical analysis.Eurousd techinical analysis next move posibale at h1 time frame.not finchinal advice.

VolanX AUD/USD Tactical Short ThesisVolanX AUD/USD Tactical Short Thesis
The Aussie is showing signs of exhaustion near the 0.886 retracement and has swept major equal highs. Liquidity was engineered and harvested.
Now price is sliding into a vacuum—first target is the imbalance around 0.6440, with a deeper structural demand zone below at 0.6278.
We are positioned via /6AU5 put options, targeting this sweep as AUD re-aligns with declining China demand, copper softness, and USD firmness.
🎯 Trade Type: Long Put (0.6400P)
🎯 Target: 0.6278
🎯 Trigger: BOS below 0.6485
#VolanX #MacroTrading #SMC #AUDUSD #Options #Futures #TradingView #SmartMoney #InstitutionalLevels

GBP USD longpossible scenario for gbp usd
Please note: This is for educational purposes only and not a trading signal. These ideas are shared purely for back testing and to exchange views. The goal is to inspire ideas and encourage discussion. If you notice anything wrong, feel free to share your thoughts. In the end, to learn is to share !

USD CHF shortdont think that it can hit for today since the target is a bit far yet i think we can have better entery , but these days mondays tend to hold the trend when there is no major news lets see
Please note: This is for educational purposes only and not a trading signal. These ideas are shared purely for back testing and to exchange views. The goal is to inspire ideas and encourage discussion. If you notice anything wrong, feel free to share your thoughts. In the end, to learn is to share !

GBPJPY| - Bullish Opportunity DevelopingPair: GBPJPY (GJ)
Bias: Bullish
HTF Overview: 1H structure remains bullish with clear higher highs. Market currently pulling back toward a visible 1H Order Block.
LTF Confirmation: Waiting for price to mitigate the 1H OB, then will drop to 15M and 5M for bullish confirmation before entering.
Entry Zone: OB zone marked and active — ideal setup includes liquidity grab or inducement before confirming entry shift.
Targets: First target is recent 1H high — extended targets based on continuation structure above.
Mindset Note: No need to force the trade — the edge comes after the zone is respected and price confirms. Let the setup come to you.
Bless Trading!

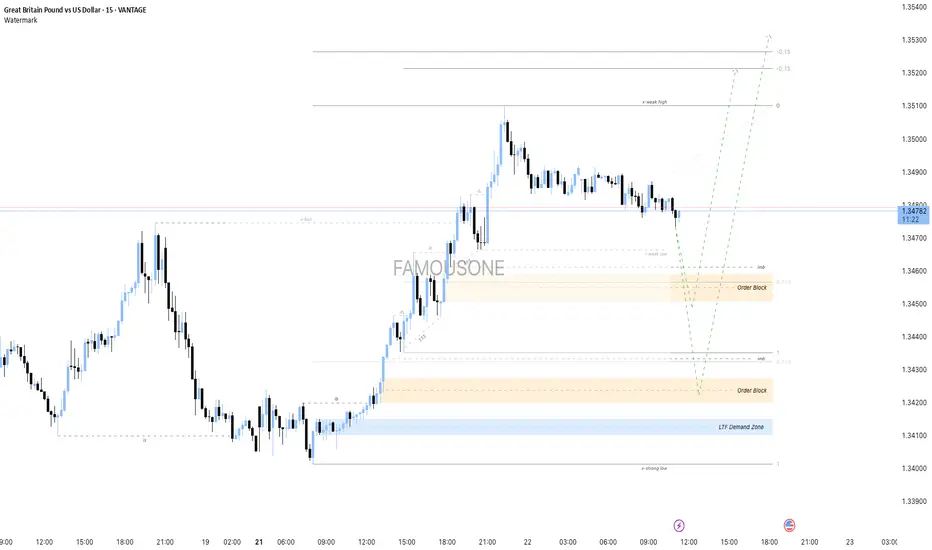
GBPUSD - Analysis with Order Blocks and Demand ZoneThe GBP/USD market currently shows an upward momentum with prices climbing from a Lower Time Frame (LTF) Demand Zone. Two significant Order Blocks are identified as potential areas for price reaction and entry points. The first Order Block near 1.34564 offers a risk-to-reward ratio of approximately 1.3, while the second, lower Order Block near 1.34350 provides a better risk-to-reward ratio of about 1.5.
Price action indicates a possible retracement to one of these Order Blocks before resuming the upward trend. The ultimate target levels for the bullish movement are marked around 1.35214 and 1.35297, which lie above a recent weak high.
This plan highlights a patient approach, suggesting waiting for price to reach these Order Blocks for optimal entry opportunities with clear risk management levels, aiming to capitalize on the continuation of the bullish trend from the strong LTF Demand Zone.
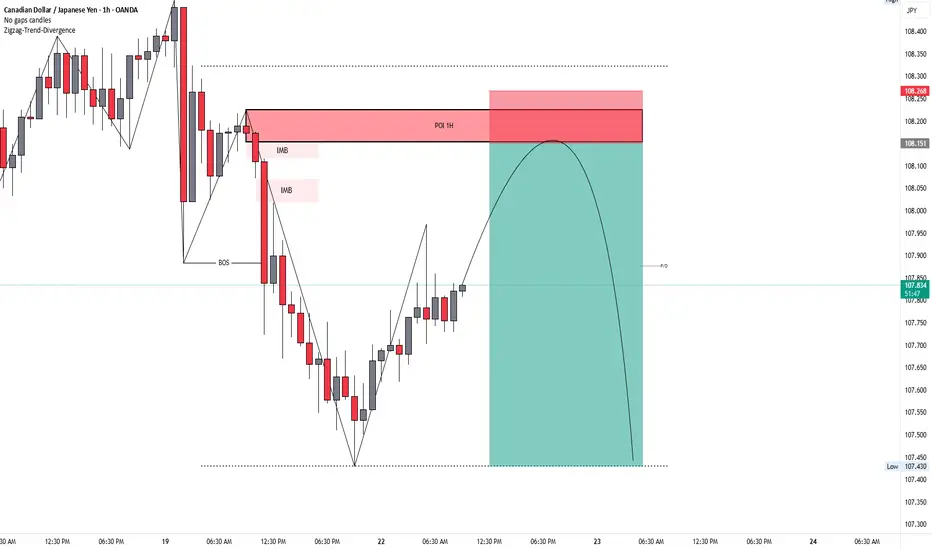
CADJPY (SMC SELL SETUP)TRADE SETUP DESCRIPTION (SMC SELL SETUP):
PAIR: CADJPY
TIMEFRAME: 1H Chart (Entry Confirmation on 15M or 5M)
SETUP LOGIC (SMC STRATEGY):
BOS (Break of Structure) confirm ho chuka hai — bearish trend active hai.
Price is retracing towards:
POI 1H (Supply Zone)
IMB (Imbalance)
Previous supply zone rejection area
Price ka expectation:
Price POI 1H zone tak jaayega.
Wahaan liquidity fill aur IMB fill ke baad bearish reaction expect karna hai.
ENTRY PLAN:
✅ After Price Enters POI 1H Supply Zone:
15 Min ya 5 Min Chart pe CHoCH (Change of Character) ka wait karo.
CHoCH milne ke baad SELL entry lena.
Stoploss POI zone ke upar lagana (above 108.268).
Target: Lower liquidity zone (marked around 107.430).
RISK-REWARD:
🎯 Risk:Reward ratio approximately 1:3 ka ban raha hai.
EUR/CAD make a fakeout and will soon decide its next trend.EURCAD recently made a faekout at the marked candle.
The candlestick pattern we can see is a Shooting Star. Yes, it does have a small wick at the bottom, but more or less looks like a Shooting Star.
After that, it fell right back into the channel. It's good to see that the channel is being respected.
Now, there's two possibilities that we're looking at for a trade.
Firstly, if we look at the Top Red trendline and the Green Trendline, we can see that there is a triangle formation. The price will decide if it wants to stay in the channel or not depending on how it reacts at the end of that triangle.
Next thing we look at is (assuming price respects the channel and continues down) that the price will start respect the big channel (Top Red trendline and Bottom Red Trendline) as it has been doing for a while now...
It's time to wait now and understand where price is going. In both possibilities, we have a trade which can be taken, but we must ensure that we have our rules and confluences in check before taking the trade.
