Forex market
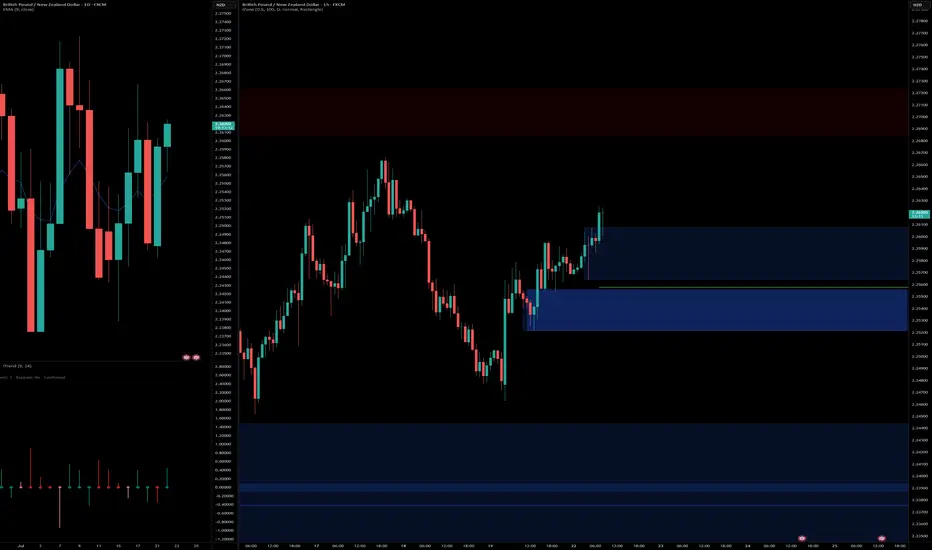
gbpnzd long idea Buying from fresh demand zone after bullish structure break.
Daily showing strong momentum, 1H confirms continuation with clean break and retest zone.
📍Entry: Demand zone
🎯 Target: 2R
🛑 SL: Below demand zone
Risk-Reward: Favorable setup aligning with higher timeframe bias.
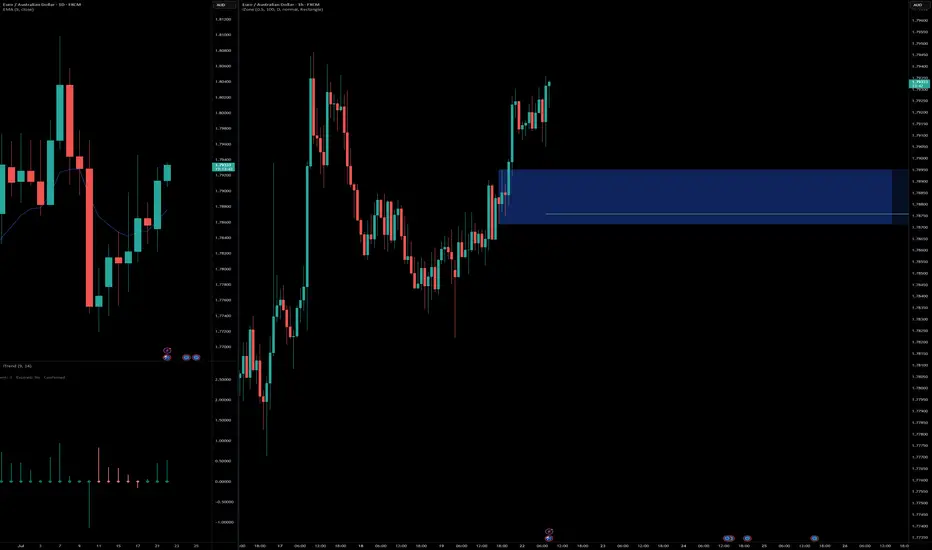
euraud long ideaBuying from fresh demand zone after bullish structure break.
Daily showing strong momentum, 1H confirms continuation with clean break and retest zone.
📍Entry: Demand zone
🎯 Target: 2R
🛑 SL: Below demand zone
Risk-Reward: Favorable setup aligning with higher timeframe bias.
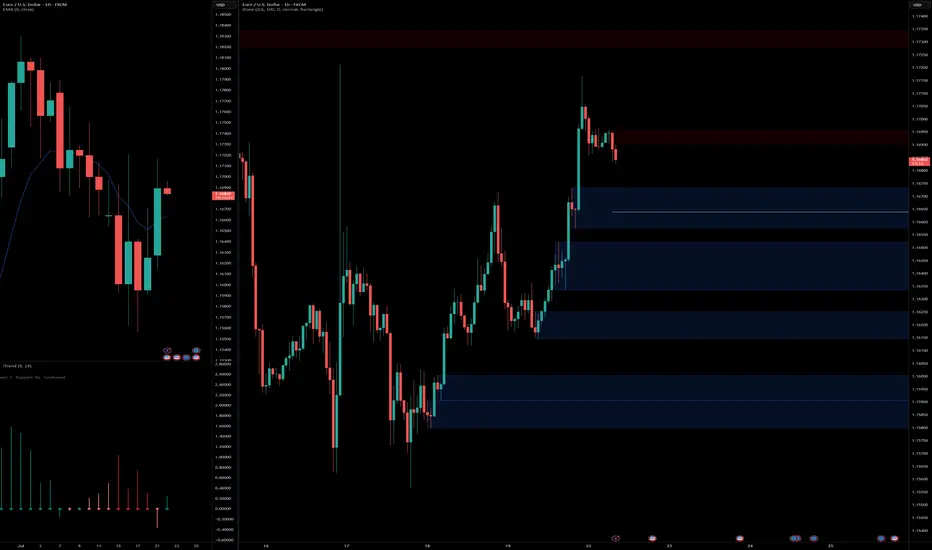
eurusd lopngBuying from fresh demand zone after bullish structure break.
Daily showing strong momentum, 1H confirms continuation with clean break and retest zone.
📍Entry: Demand zone
🎯 Target: 2R
🛑 SL: Below demand zone
Risk-Reward: Favorable setup aligning with higher timeframe bias.
gbpnzd potential short 1:5GBPNZD Short: Entered a short position on GBPNZD. My analysis suggests a widening divergence in central bank policies, with the RBNZ appearing more hawkish than the dovish signals from the BoE

GBPAUD - Bullish TrendGBPAUD is making Bullish Trend after RSI Divergence, will this trend continue?
Entry, Stop Loss & Take Profit are mentioned.

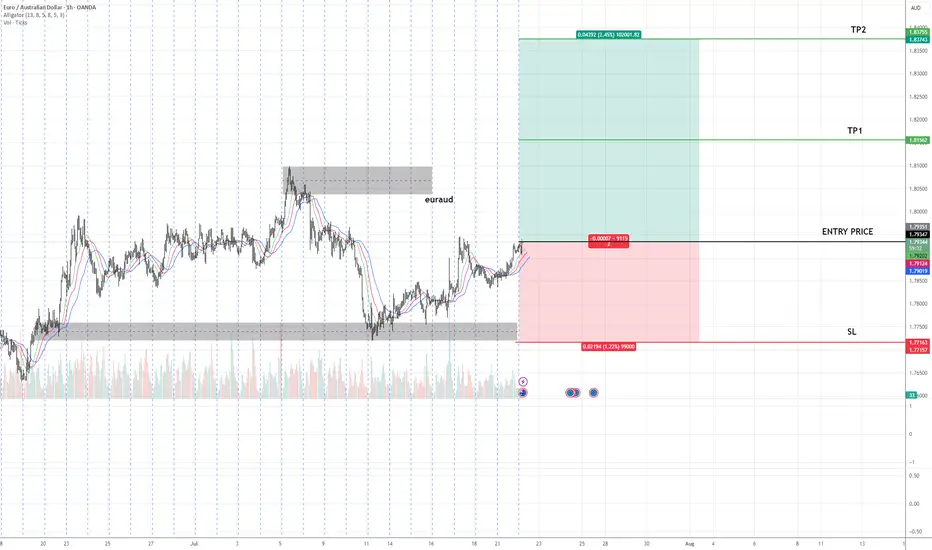
EURAUD Buy Setup – Advanced Analysis Entry: As marked on chart
🎯 TP1: As highlighted on chart
🎯 TP2: As highlighted on chart
🛑 SL: As defined on chart
📊 Technical Insight:
Price has completed a higher low formation, indicating the potential start of a new uptrend phase.
The market has shown an accumulation phase followed by a breakout above minor resistance, suggesting strong demand at current levels.
Volume analysis supports the breakout, with increased participation on bullish pushes and decreasing volume on retracements, confirming healthy trend dynamics.
📍 As long as price holds above the stop loss zone, we expect continuation towards TP1 and TP2 in line with the primary trend.
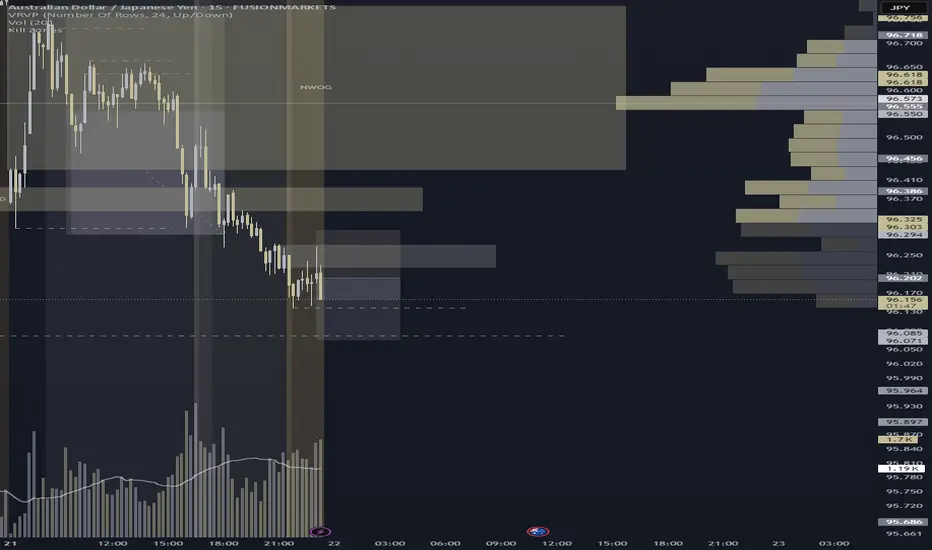
AUDJPY – Resistance Rejection at 96.224–96.273
Executed a disciplined short off the 96.224–96.273 resistance zone, which aligned with bearish structure and rejection candle confirmation. Entry followed lower high formation, with stops placed above the recent swing at 96.303 to allow for volatility breathing room. Target set at 96.079, aligning with a clean sellside draw. Price showed momentum alignment and polarity flip reaction off resistance.
🔹 Strategy: Trap-to-draw execution
🔹 Entry: Post-rejection confirmation
🔹 SL: Above 96.303 swing
🔹 TP: Into 96.079 liquidity magnet
A precise, structure-backed short targeting engineered liquidity
EUR/USD long: The Fed Chair debacle is getting spicyHello traders
My previous EUR/USD long did not pan out but I am swinging again. My entry order at 1.0563 was filled by the skinny skin of my teeth but so far so good. I'll use a trailing stop for this trade.
The pressure on Fed Chair Powell is being ramped up by Trump's attack dogs with allegations of mismanaging Federal funds(gasp :) ) during the FOMC headquarters.
We all saw the result of the rumor that Powell was fired/is considering resigning yesterday and as much as I am sure it pained DJT, he had to refute the rumor, no doubt on advice from Bessent.
In addition, FOMC board member Waller publicly dissented today and suggested a rate cut at the July meeting.
On the economic calendar we have the ECB rate decision, JOLTS, ADP and finally FOMC over the next two weeks.
This is purely a technical play but I am keeping a close eye on the bond markets, the
CME FedWatch tool and as for trade and tariffs, who cares...
I mentioned the Federal Court of Appeals case regarding the IEEPA court decision starting on 7/31/2025. For anyone interested in the court's decision,
www.cafc.uscourts.gov
More importantly, you can sign up for a notification at courtlistener.com which is a free service.
I have used it in the past and not only is it free but I also received the notification in a very timely manner.
www.courtlistener.com
Best of luck.

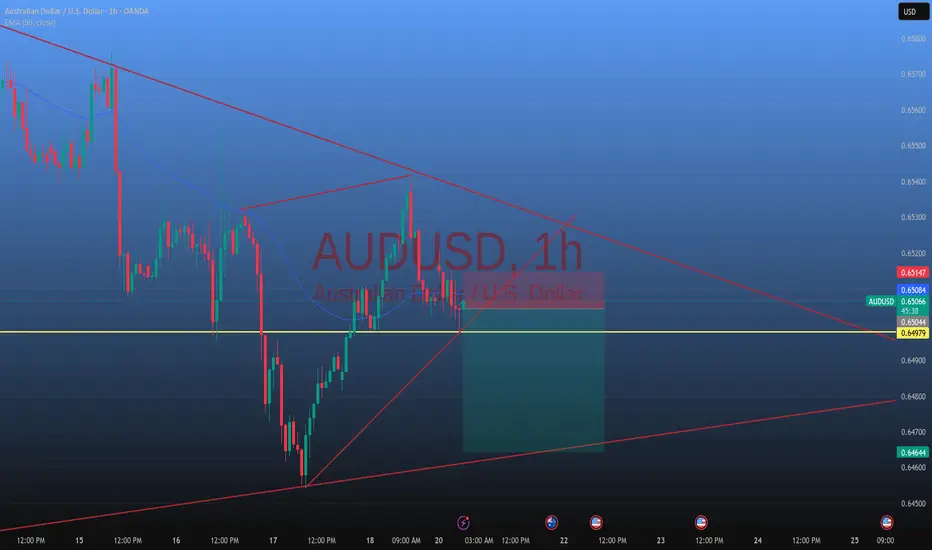
Buy AUDNZDAUDNZD price traveling within a falling channel. We can expect price to move up to the resistance before possibly reversing.

Audcad Audcad is on a down trend we hv price break and retest on the zone so we are expecting more bearish movements to de down side

Fundamental analysis: JPY strength and TV show recommendation The outcome of the Japanese election has created JPY strength. If you placed a short term JPY long based on the election, I would find it difficult to argue. But, personally, I think any JPY strength will be short lived. Essentially due to uncertainty creating a likelihood of a slower pace of BOJ rate hikes (If at all). Meaning, JPY short trades back on the table soon.
Whilst I await a 4hr swing with a 'push up' on JPY charts (for a JPY short). I'd like to recommend a very interesting TV programme I recently watched called FINDING THE MONEY.
Depending on your region you might be able to watch it for free., Living in the UK, I paid about £6 to watch it via Amazon prime.
It won't necessarily make you a better trader, it's just a very interesting watch, particularly if you're curious about the concept of M.M.T and the workings of the financial system.
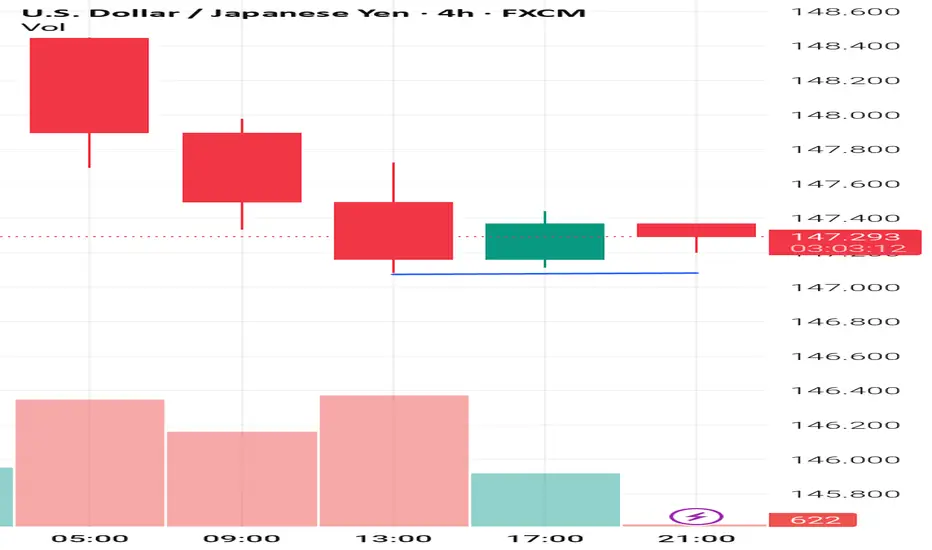
USD/JPY Bearish Reversal Setup with Key Targets and Stop LossThis 4-hour USD/JPY chart suggests a bearish setup. Price has rejected the order block near 149.220 and is heading downward. A support level is marked at 145.268, with the target around 142.637. A stop loss is set above the order block, indicating a short trade setup expecting a continued drop.

Trade idea for GBPAUD Sell-side liquidity at 2.04813 has been purged; now we target the buy-side liquidity at 2.10286. The entry will be at the sweep of the 2.05802 level.
Trade idea for EURCADThe sell-side liquidity at 1.58972 was purged, and now we target the buy-side liquidity at 1.60384. The potential entry zone is from CMP at 1.60016 with a stop loss at 1.59922. The 5-minute entry was taken based on the CISD strategy. Note the 1.59973 level; if this level is swept and not run through, then we can add more positions and maintain the same stop loss for larger rewards.

NzdjpyNzd dollar looks set for a return upwards after correction of uptrend downwards and a buy order placed now at 88.000 after hitting dynamic support level on the 3hr and 2 hr chart, also hit and bounce off my fibonacci 0.382 level says to me a rise up to 88.498 where I will be taking profits 📈

Selling USDCHFHello traders Hope you are having a wonderful week!!
Clear downtrend!!
We can say about 4 touch trendline but technically its 3.
You can see it!!

A bullish reversal , price broke structure to the upside Price is currently at premium price on a bigger TF and on H4 we see bearish trend violated and retraced back to premium price range

USDCHF Next moveUSDCHF is still in a downtrend , it even failed to break above 0.80700 zone which was the major resistance zone this are just a few potential signs that we might see it failing down

EUR/USD AccumulationOn the 5-minute timeframe, buying activity initiates, signaling the potential end of the downtrend. The first indication of upward momentum appears following the formation of a range and a subsequent liquidity sweep. Price then retests the prior low with diminished volume but fails to break below it, suggesting that selling pressure is being absorbed by buyers. This behavior reflects accumulation by informed participants positioning for a move higher. As demand begins to outweigh supply, clear signs of strength emerge
Entry: 1.15765
Take Profit: 1.16279
Stop Loss: 1.15621


GBPUSDGBPUSD is in strong bullish trend.
Potentially printing HH and HL.
NO sign of reversal here.
Alligator mouth is full open which shows that rend will continue .
we buy at CMPl.
