USD-CHF Bearish Wedge! Sell!
Hello,Traders!
USD-CHF is trading in a
Downtrend and has formed
A bearish wedge pattern
So IF we see a breakout
Then we a further bearish
Continuation will be expected
Sell!
Comment and subscribe to help us grow!
Check out other forecasts below too!
Disclosure: I am part of Trade Nation's Influencer program and receive a monthly fee for using their TradingView charts in my analysis.
Forex market

"EUR/CAD Price Pirate Mode: Long Entries Loading!"🔥🚨 "EUR/CAD BANK HEIST: The Ultimate Bullish Loot Grab! (Thief Trading Style) 🚨🔥
🌟 Greetings, Market Pirates & Profit Raiders! 🌟
(Hola! Oi! Bonjour! Hallo! Marhaba!)
The EUR/CAD "Euro vs Loonie" vault is WIDE OPEN—time to execute the Thief Trading Heist Plan! 🏦💰 Based on 🔥 high-probability technicals & stealthy fundamental analysis 🔥, here’s how we SWIPE THE LOOT before the bears catch on!
🎯 TRADE SETUP (Scalping/Day Heist)
📈 Entry (Bullish Raid):
"The vault door is cracked—enter anywhere!"
Pro Thief Move: Use buy limit orders near swing lows (15M/30M) for sneaky pullback entries.
Advanced Raid Tactics: Layer entries (DCA-style) for maximum loot efficiency.
🛑 Stop Loss (Escape Route):
Swing Low (4H) = 1.58800 (Adjust based on your risk tolerance & lot size!)
Thieves’ Golden Rule: "No heist is worth a jail sentence!" 🚔💨
🎯 Take Profit (Escape Before the Cops Arrive!):
Primary Target: 1.62300 (or exit early if resistance gets too hot!)
⚠️ Danger Zone: High-voltage resistance = Bear Trap Territory! ⚡🐻
💡 WHY THIS HEIST WILL WORK:
✅ Bullish Momentum Intact (Price structure favors buyers)
✅ Weak CAD Fundamentals (Loonie under pressure)
✅ Smart Money Algos Likely Pushing Higher (COT data hints at institutional bias)
📰 NEWS ALERT (Avoid the Market Police!)
🚨 Upcoming High-Impact Events?
Avoid new trades during news spikes!
Trailing stops = Your getaway car! 🚗💨
💥 BOOST THIS HEIST! (Let’s Get RICH Together!)
🔥 Hit the 👍 LIKE & 🚀 BOOST button to strengthen our robbery squad!
💬 Comment your entry & TP—let’s track the loot!
🔔 Follow for DAILY HEIST PLANS!
⚠️ DISCLAIMER (Stay Out of Jail!):
This is NOT financial advice—just a pirate’s treasure map! 🗺️
Manage risk like a pro thief—don’t blow your capital!
🚀 Ready to RAID? Let’s STEAL those pips! 🏴☠️💸

AUDUSD Long PullbackOANDA:AUDUSD taking a pullback towards up, catching this pullback.
Note: I am not adding levels etc on chart because I am tired and need to go for breakfast first, simply sharing the what I see.
I manage trade on daily basis.
Use proper risk management
Looks like good trade.
Lets monitor.
Use proper risk management.
Disclaimer: only idea, not advice

AUDUSD(20250721)Today's AnalysisMarket news:
Waller refused to comment on whether he would dissent at the July meeting, saying that the private sector was not performing as well as people thought, and said that if the president asked him to be the chairman of the Federal Reserve, he would agree.
Technical analysis:
Today's buying and selling boundaries:
0.6506
Support and resistance levels:
0.6572
0.6547
0.6531
0.6481
0.6466
0.6441
Trading strategy:
If the price breaks through 0.6531, consider buying, and the first target price is 0.6547
If the price breaks through 0.6506, consider selling, and the first target price is 0.6481

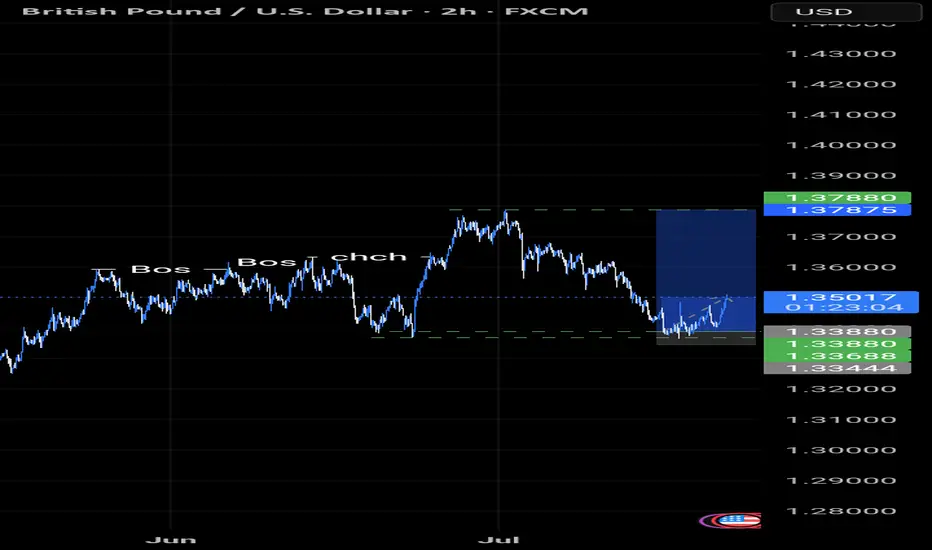
GBPUSD TRADE IDEA We also analyzed the GBPUSD chart and got a pullback to our Fibonacci level for a continuation trade to the upside....
The market seems to be going in our predicted direction...
USDJPY Support & Resistance Levels🚀 Here are some key zones I've identified on the 15m timeframe.
These zones are based on real-time data analysis performed by a custom software I personally developed.
The tool is designed to scan the market continuously and highlight potential areas of interest based on price action behavior and volume dynamics.
Your feedback is welcome!

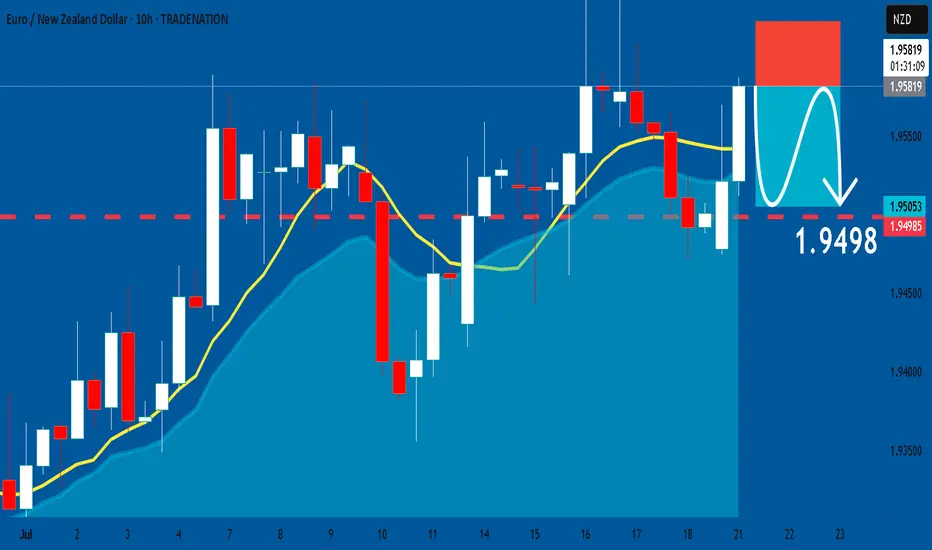
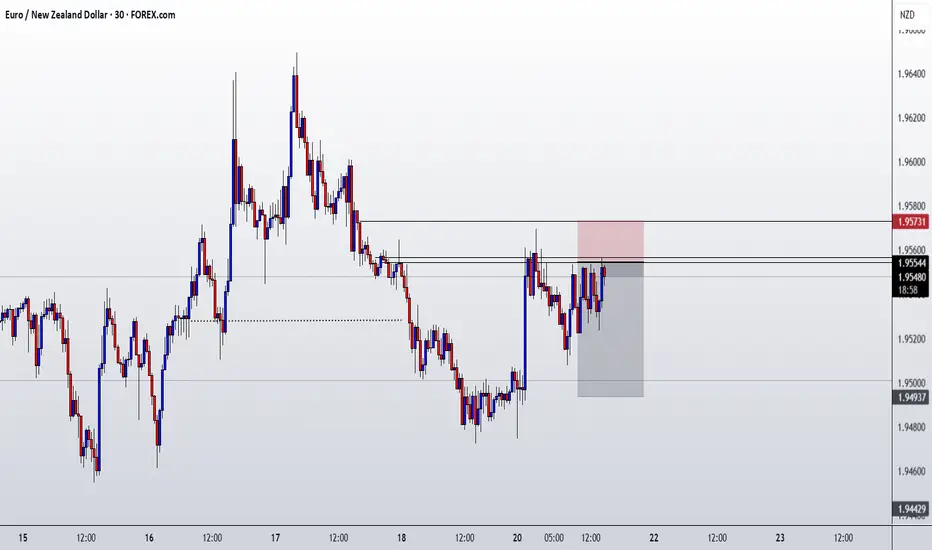
EURNZD: Short Signal with Entry/SL/TP
EURNZD
- Classic bearish formation
- Our team expects pullback
SUGGESTED TRADE:
Swing Trade
Short EURNZD
Entry - 1.9581
Sl - 1.9622
Tp - 1.9498
Our Risk - 1%
Start protection of your profits from lower levels
Disclosure: I am part of Trade Nation's Influencer program and receive a monthly fee for using their TradingView charts in my analysis.
❤️ Please, support our work with like & comment! ❤️

USDJPY BREAKOUT IN H1 Price just broke out of the trendline that was formerly serving as support. A sell opportunity is envisaged from the current market price. Target profit is at 146.207

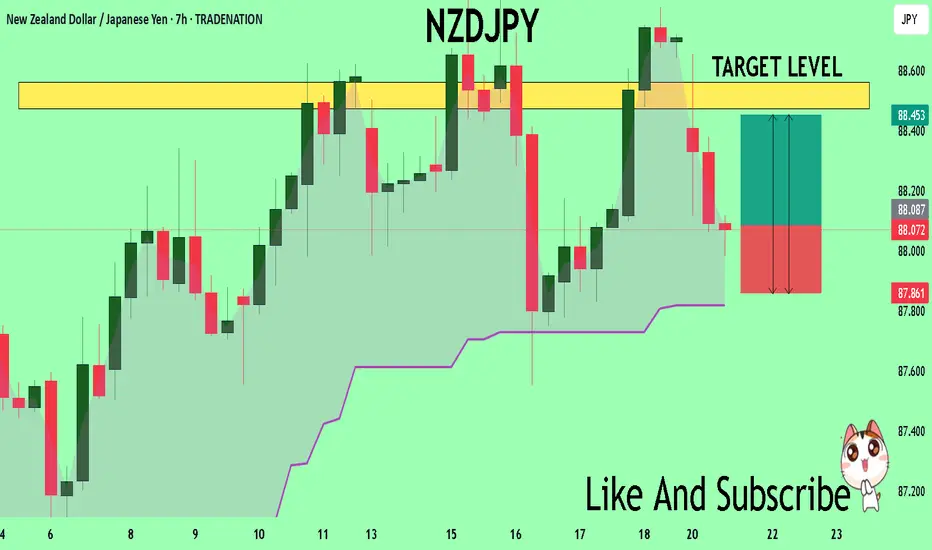
NZDJPY Set To Grow! BUY!
My dear friends,
My technical analysis for NZDJPY is below:
The market is trading on 88.079 pivot level.
Bias - Bullish
Technical Indicators: Both Super Trend & Pivot HL indicate a highly probable Bullish continuation.
Target - 88.472
Recommended Stop Loss - 87.861
About Used Indicators:
A pivot point is a technical analysis indicator, or calculations, used to determine the overall trend of the market over different time frames.
Disclosure: I am part of Trade Nation's Influencer program and receive a monthly fee for using their TradingView charts in my analysis.
———————————
WISH YOU ALL LUCK
AUD/JPY LIVE TRADE UPDATESwing Trade Update – Gap Down Open
We entered this trade last Thursday based on our VMS swing setup.
When the market opened Sunday, price gapped down against us.
Now we’re watching for:
*Price to find support at this level
*A potential bounce and continuation in trade direction
📌 The gap doesn’t break the setup—structure will tell the truth. Patience required.

EURUSD Long Swing FX:EURUSD price had stopped falling and I was waiting for bullish volume to kick inn, initial bullish volume started jumping inn, so taking long now.
With my back testing of this strategy, it hits multiple possible take profits, manage your position accordingly.
I manage trade on daily basis.
Use proper risk management
Looks like good trade.
Lets monitor.
Use proper risk management.
Disclaimer: only idea, not advice

EURGBP 1st Buy EntryEntry: 0.86651
Stop Loss (R): 0.86497
Take Profit (4R): 0.87267
*Disclaimer: I will not accept liability for any loss or damage, including without limitation to any loss of profit, which may arise directly or indirectly from use of or reliance on such information.

GBP/CHF POSSIBLE SETUPWatching for Pullback + V/M Alignment
We’re watching this market to see if price will break above current resistance then pull back into the key support/resistance zone.
What we want to see:
✅ Volume increasing in the direction of the trend
✅ Momentum aligning — ideally rising and then hooking back in trade direction
✅ A clean engulfing candle at or near the 50EMA
✅ Pullback must reach the recent broken high/low (structure matters)
This is classic VMS strategy setup behavior — no need to predict, just prepare.
📌 Discipline is waiting. The setup either shows up or it doesn’t.
We’ll keep watching.

GBP/CAD POSSIBLE SETUPWatching this market closely as price approaches the key S/R zone.
If we get a pullback into that area, we’ll be looking for:
*Volume to increase in the direction of the trade (downside),
*Momentum to first push up, then hook down (the deeper the rise before the hook, the better),
*A clean engulfing candle to the downside for the trigger.
*All of this must happen near the 50EMA and in full alignment with the VMS strategy rules.
📌 Stay patient. Let the setup come to us.
Keep watching.

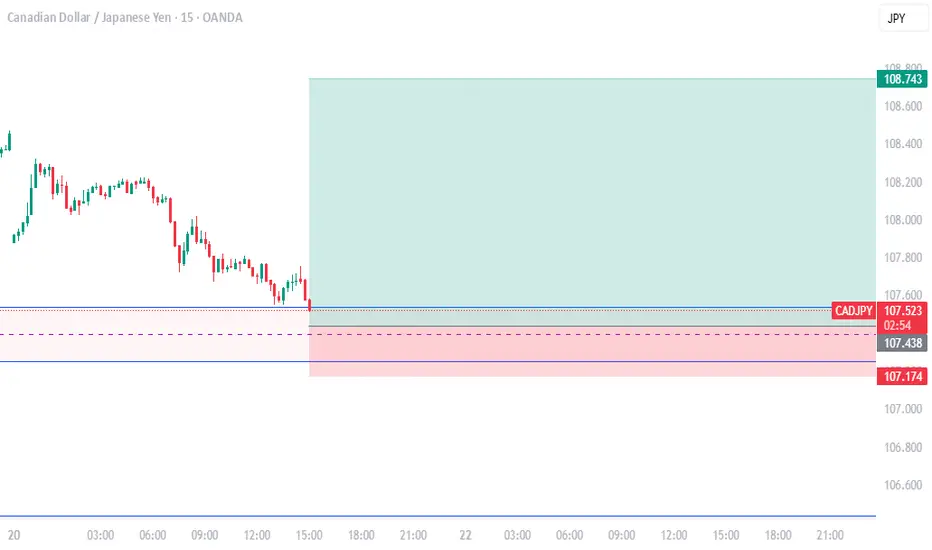
cadjpy for long *The content on this analysis is subject to change at any time without notice, and is provided for the sole purpose of assisting traders to make independent investment decisions.
USDJPY sell1. price created a double top near the premium zone
2. price moved down and broke the bullish trendline and closed below it
3. Created a new bearish trendline with multiple touches confirming that that the bullish move has ended
Entry idea:
will wait for price to pullback into the 50% zone fora limit order or alternatively wait for price to be overbought with a stochastic cross to enter at market order then exit/TP at the next available order block

EURNZD ENTRY CHARTOn this Pair, we are BEARISH, the Trend is still BEARISH, the NEW ZEALAND DOLLAR is beginning to gain STRENGTH, the DAILY open gave us a Confluence with the H4 tf giving us a SELL FORMATION, on the H1, we got our Structure area, with a LTF entry confirmation + Inducement, So if this matches with your Trade Idea, you can look to join US, and Apply a Good risk Management.We will give Update in the UPDATE SECTION THANK YOU.
euraud long tradein my opinion this is a good trade with a good r/r
hope hit the tp
consider this is my trade not your trade and i just like to share my trades with world

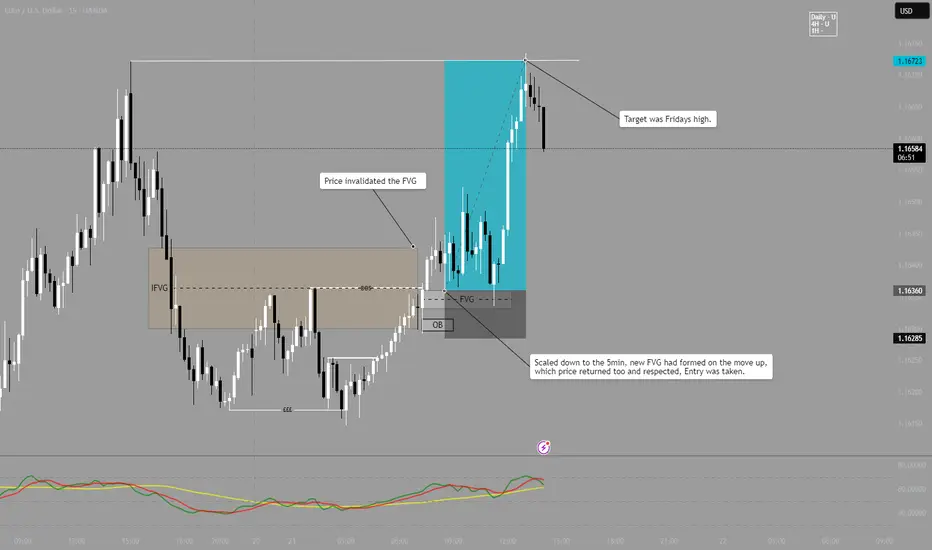
EUR/USD LONG - Follow upAs can be seen, Price invalidated the FVG, indicating a bullish momentum.
After price broke, I then look at the 5 minute for a precise entry.
On the 5m an FVG had been created on the initial move up, price then returned to this area and an entry long was taken.
Target was Fridays Highs.
Note - This is published on the 15m as it wont allow to post with 5m timeframe.
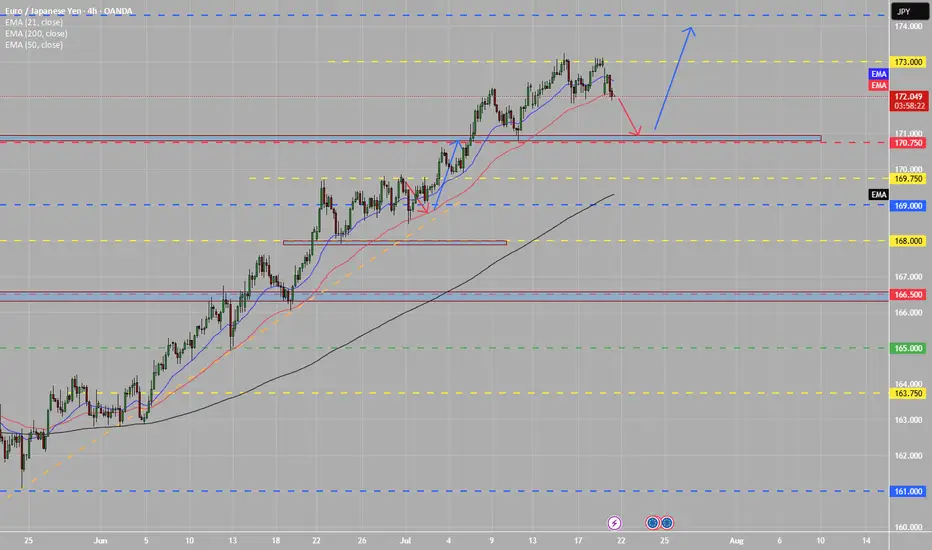
EJ BULLISH SETUP Looking for a nice retest at the daily support zone, if this holds true price will start to look for monthly resistance marked in blue.
buy ideahi all. price return at 11 from middle of the know where and will react to a special level. be happy(wink)

USD/JPY Faces Rejection at 148.6, Bearish Setup EmergesFenzoFx—USD/JPY began a bearish wave after the 148.6 resistance rejected the price. As of this writing, the currency pair flipped below the ascending trendline and formed a bearish FVG at 147.9.
A pullback toward the FVG can provide a premium price to go short on USD/JPY, targeting 146.9, followed by 145.7.
