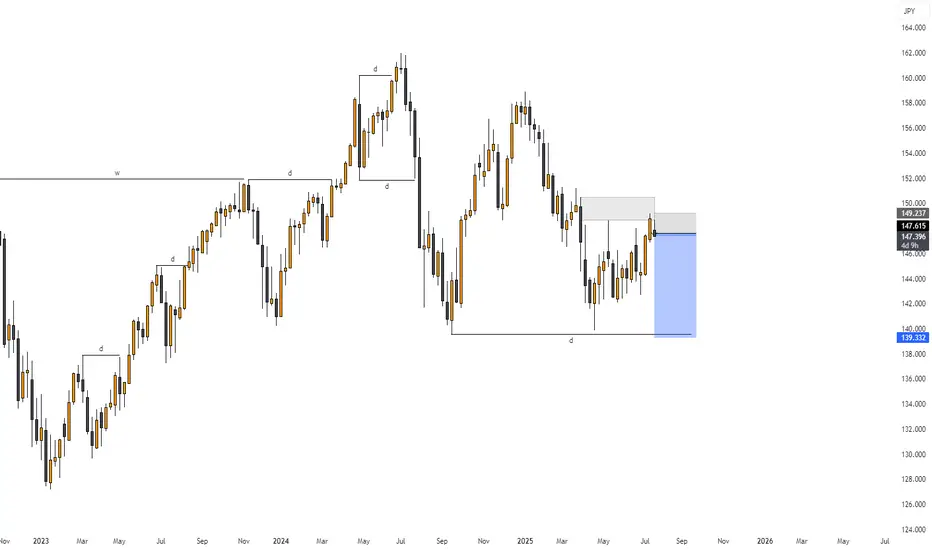
USDJPY - market structureUSDJPY - market structure, keep a clean chart and trake best decision , use risk managment
Forex market
Sell GBPCADOur long awaited setup has triggered. Sell GBPCAD to the low created at the beginning of todays trading sessions.

USDJPY short position 21/07/2025English : According to our analysis, we anticipate a bearish scenario.
Morocan Darija : kanchofo d'apres l'analyse dyalna antsanaw hboot
ATENTION : I only share my ideas, not signals

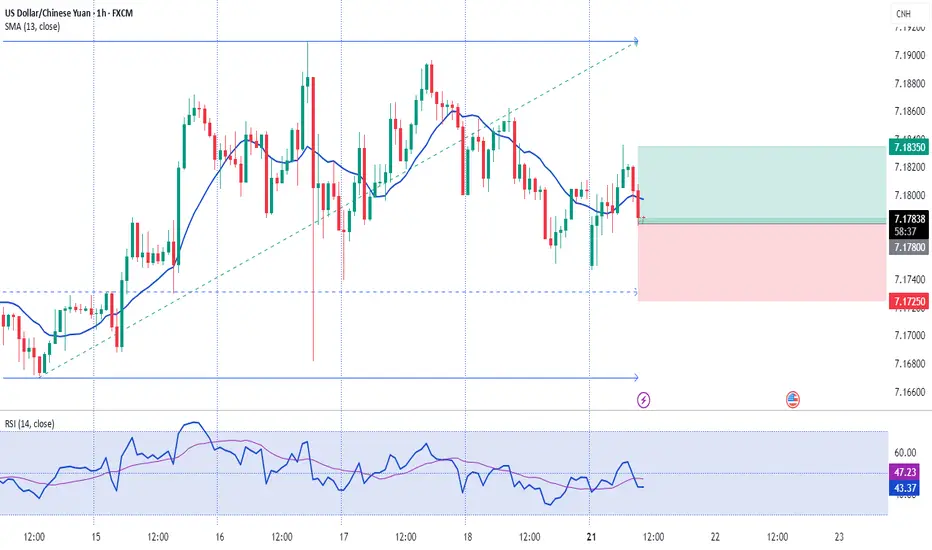
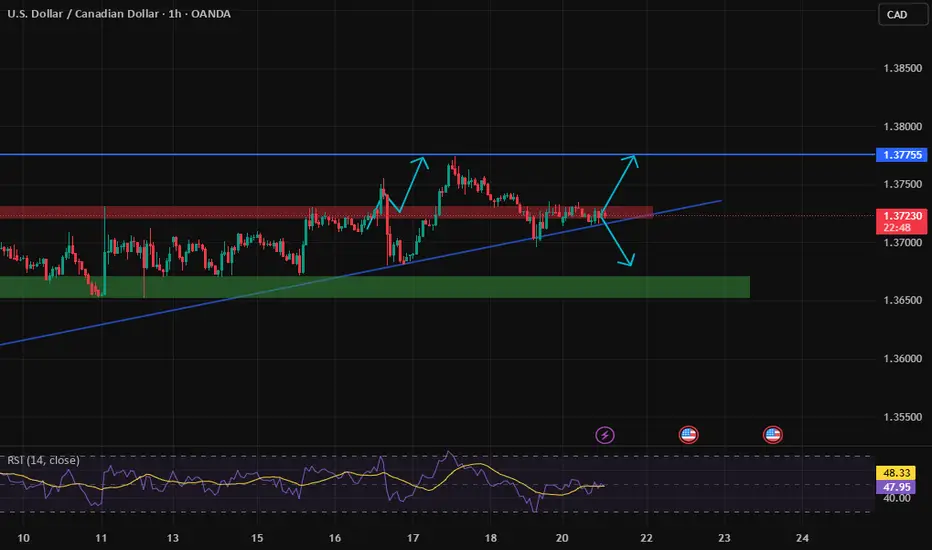
Possibility of correction A trend reversal is expected at the current resistance level and a downtrend is expected to begin. A break of the support line will confirm the downtrend. If the price breaks through the resistance level, a continuation of the uptrend is likely.

Possibility of uptrend It is expected that a trend change will take place within the current support area and we will witness the start of an uptrend. Then, the uptrend will continue to the identified resistance area.

GBPJPY Is Bearish! Short!
Take a look at our analysis for GBPJPY.
Time Frame: 1D
Current Trend: Bearish
Sentiment: Overbought (based on 7-period RSI)
Forecast: Bearish
The price is testing a key resistance 198.794.
Taking into consideration the current market trend & overbought RSI, chances will be high to see a bearish movement to the downside at least to 192.854 level.
P.S
The term oversold refers to a condition where an asset has traded lower in price and has the potential for a price bounce.
Overbought refers to market scenarios where the instrument is traded considerably higher than its fair value. Overvaluation is caused by market sentiments when there is positive news.
Disclosure: I am part of Trade Nation's Influencer program and receive a monthly fee for using their TradingView charts in my analysis.
Like and subscribe and comment my ideas if you enjoy them!

Possibility of uptrend As long as the price fluctuates above the support level, it is expected that the price will advance to the specified resistance level. Then, depending on the price behavior within this level, there is a possibility of a trend change.

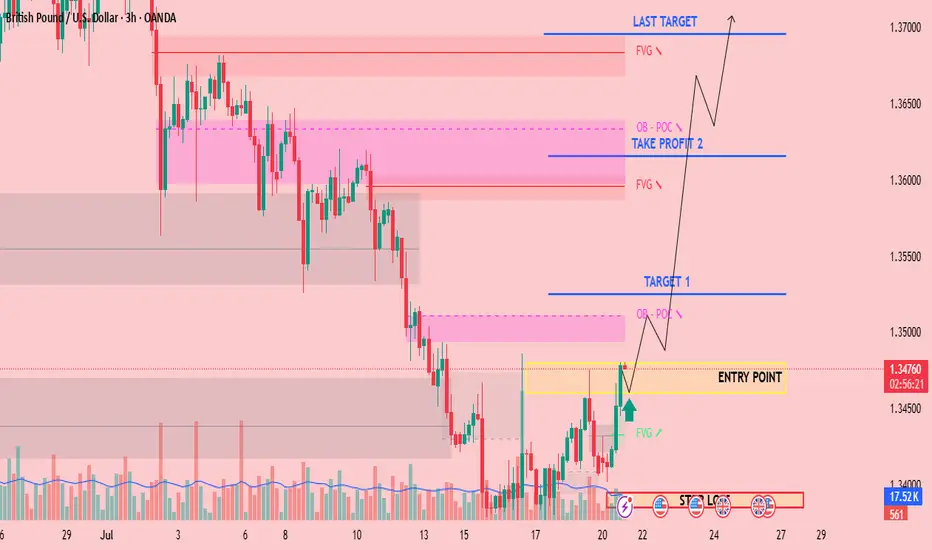
CHECK GBPUSD SIGNAL READ THE CAPTAINEntry Point: Around 1.34800 1.34600
Stop Loss: Around 1.33950
🎯 Target Levels
Take Profit 1:
1.35250
Take Profit 2:
1.36150
last target
1.36950
Pound Pressured by Rising UK Jobless RateGBP/USD started the week steady, trading just above 1.3400 during the Asian session and holding near last week’s two-month low. The US Dollar remains soft below Thursday’s monthly peak, as markets weigh the prospects of a Fed rate cut. Although Fed Governor Waller backed a July cut, most investors expect the Fed to keep rates higher for longer due to Trump’s tariffs impacting consumer prices.
The British Pound is under pressure as markets price in a potential Bank of England rate cut in August. UK labor data showed unemployment rising to 4.7%, a four-year high, and annual pay growth slowing to 5%, the weakest since Q2 2022. This limits GBP/USD upside despite persistent inflation.
For GBP/USD, resistance is seen at 1.3535, with the next levels at 1.3580 and 1.3630. Support stands at 1.3380, followed by 1.3270 and 1.3140.

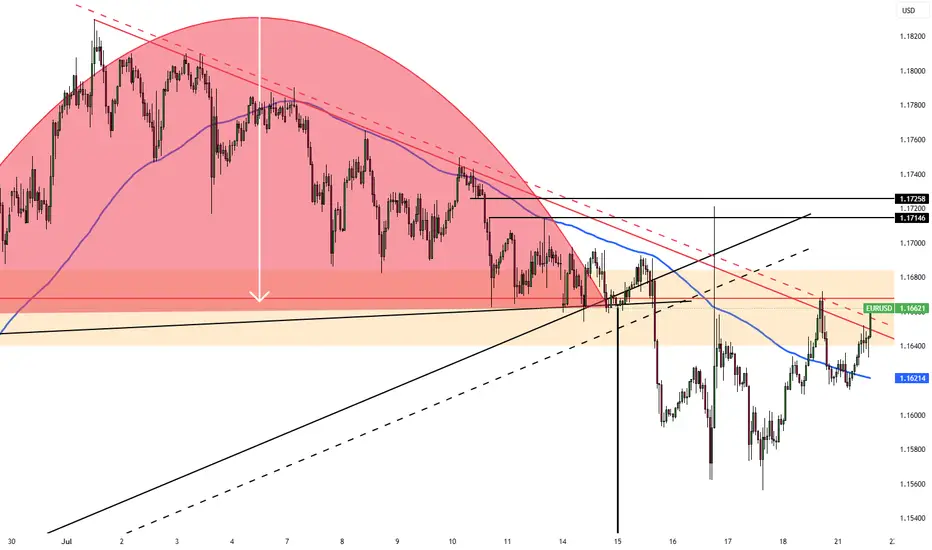
EUR/USD Analysis by zForex Research Team - 07.21.2025EUR/USD Pulls Back Amid Trade Deal Uncertainty
EUR/USD edged down to 1.1620 during Monday’s Asian session, after gains in the previous session, as the US Dollar stayed firm and traders remained cautious ahead of the August 1 tariff deadline.
US Commerce Secretary Howard Lutnick said the Trump administration expects to finalize trade deals with major partners in the coming weeks, calling the next two weeks “historic.” He expressed optimism about reaching an agreement with the EU but confirmed that August 1 remains a firm deadline for new tariffs.
Resistance levels for EUR/USD are set at 1.1670, followed by 1.1700, and extend up to 1.1750. On the downside, support is found at 1.1580, with additional levels at 1.1540 and 1.1500.
USD/JPY Analysis by zForex Research Team - 07.21.2025Yen Recovers After Japan’s Upper House Election
The Japanese yen rose to around 148.5 per dollar on Monday, recovering some of last week’s losses after the ruling coalition lost its upper house majority. Markets had mostly priced in the result, limiting the reaction. Prime Minister Ishiba is expected to remain in office, which could ease concerns over political instability.
The opposition is likely to push for more spending and tax cuts, which could pressure the yen and lift bond yields. The election outcome comes as Tokyo continues trade talks with Washington. US Commerce Secretary Lutnick confirmed the August 1 tariff deadline but said negotiations will continue.
For the yen, resistance stands at 149.30, followed by 151.50, with the next key level at 155.00. Support is located at 147.50, with further levels at 146.15 and 145.30.

EUR/USD 21.07.25EUR/USD: Uptrend Continues — Targeting 1.1859**
Market Overview:
EUR/USD has bounced off the 1.1570–1.1540 support zone, confirming the integrity of the uptrend. The pair remains inside a rising channel and is approaching key resistance on the D1 level.
Technical Signals & Formations:
— EMA(144) on 8H acts as dynamic support
— Key support at 1.1570–1.1540 held strong
— Bullish momentum targets the 1.1859 resistance (D1)
— Bullish candlestick pattern formed on rebound
Key Levels:
Support: 1.1570, 1.1540
Resistance: 1.1859 (D1)
Scenario:
Primary: continuation toward 1.1859
Alternative: if 1.1540 breaks, possible retracement to 1.1450

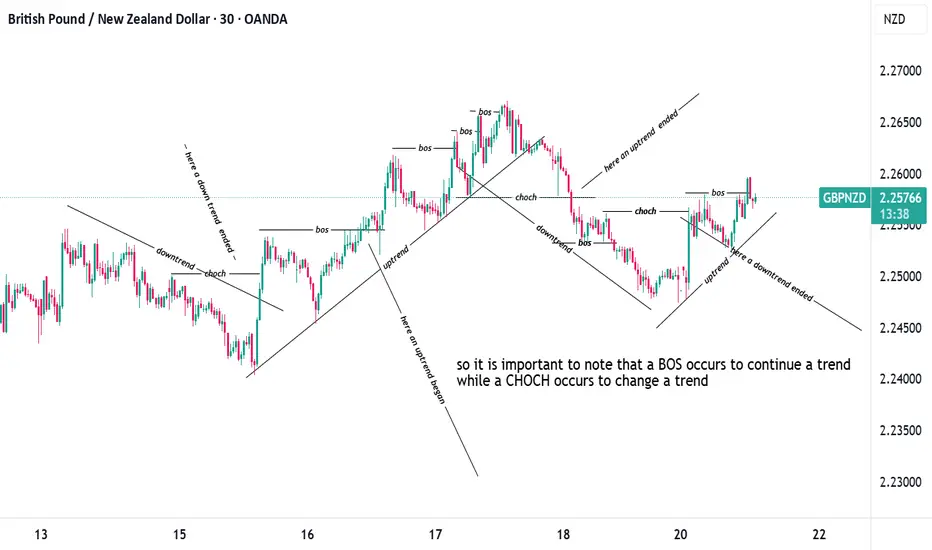
simplest explanation of BOS (break of structure) and CHOCHsimplest explanation of BOS (break of structure) and CHOCH (change of character)
i tried to simplify this as much as possible if you have any questions just reach out to me
gbpchf long tradein my opinion this is a good trade with a good r/r
hope hit the tp
consider this is my trade not your trade and i just like to share my trades with world

NZDCAD in bearish rallythe pair is making LHs and LLs just following DOW theory right now the price has marked its LH and now it is towards marking LL and with that a simple trade idea has been shown on the chart

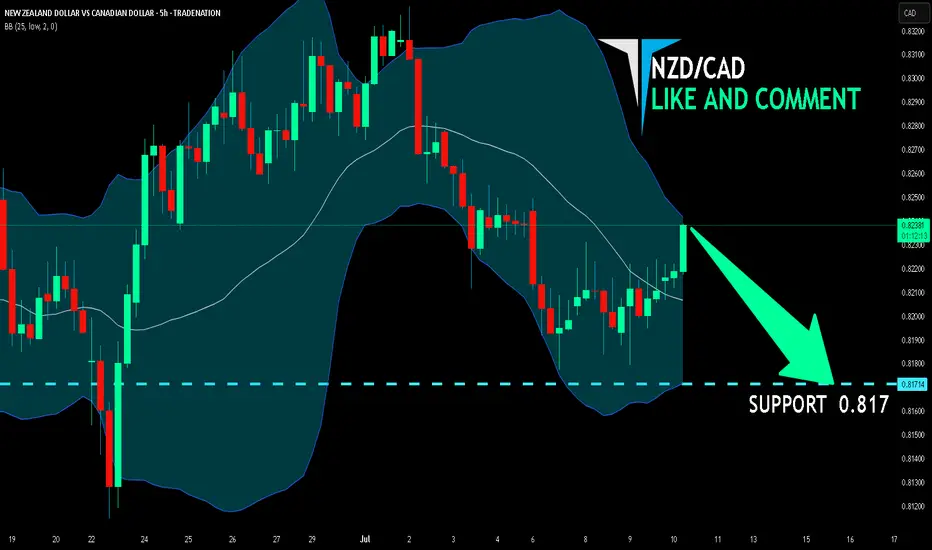
NZD/CAD SELLERS WILL DOMINATE THE MARKET|SHORT
Hello, Friends!
NZD/CAD pair is trading in a local uptrend which we know by looking at the previous 1W candle which is green. On the 5H timeframe the pair is going up too. The pair is overbought because the price is close to the upper band of the BB indicator. So we are looking to sell the pair with the upper BB line acting as resistance. The next target is 0.817 area.
Disclosure: I am part of Trade Nation's Influencer program and receive a monthly fee for using their TradingView charts in my analysis.
✅LIKE AND COMMENT MY IDEAS✅
EURGBP bullish flag developing The EURGBP remains in a bullish trend, with recent price action showing signs of a corrective pullback within the broader uptrend.
Support Zone: 0.8620 – a key level from previous consolidation. Price is currently testing or approaching this level.
A bullish rebound from 0.8620 would confirm ongoing upside momentum, with potential targets at:
0.8700 – initial resistance
0.8715 – psychological and structural level
0.8740 – extended resistance on the longer-term chart
Bearish Scenario:
A confirmed break and daily close below 0.8620 would weaken the bullish outlook and suggest deeper downside risk toward:
0.8600 – minor support
0.8590 – stronger support and potential demand zone
Outlook:
Bullish bias remains intact while the EURGBP holds above 0.8620. A sustained break below this level could shift momentum to the downside in the short term.
This communication is for informational purposes only and should not be viewed as any form of recommendation as to a particular course of action or as investment advice. It is not intended as an offer or solicitation for the purchase or sale of any financial instrument or as an official confirmation of any transaction. Opinions, estimates and assumptions expressed herein are made as of the date of this communication and are subject to change without notice. This communication has been prepared based upon information, including market prices, data and other information, believed to be reliable; however, Trade Nation does not warrant its completeness or accuracy. All market prices and market data contained in or attached to this communication are indicative and subject to change without notice.

British Pound / Japanese Yen - 4h (OANDA)4-hour candlestick chart from OANDA shows the GBP/JPY currency pair's price movement, currently at 199.038 with a decrease of 0.542 (-0.27%). The chart highlights a recent consolidation phase around the 199-200 range, with key levels marked at 201.000, 200.268, 199.038, 198.986, and 198.435. The data reflects trading activity as of 03:08:55.

I'm currently long on EUR/GBPPrice is currently reacting to a retest of an order block located within the discount zone, following a Shift in Market Structure (SMS).
Additionally, on the weekly timeframe, price is also positioned in the discount zone, aligning with a weekly order block at the same level.
Disclaimer: This is not financial advice—just my personal analysis.

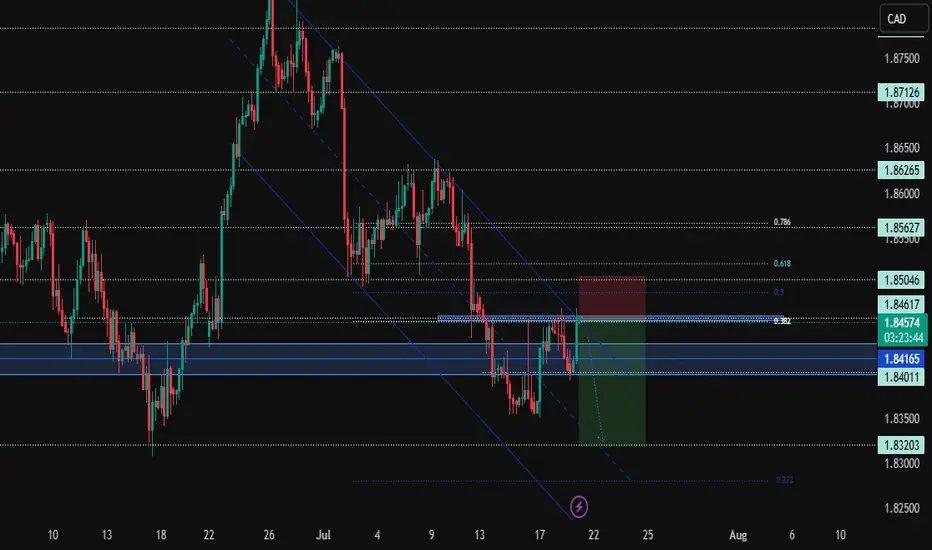
GBPCAD Rejects Key Fib Resistance – Bearish Continuation Ahead?Hey Traders,
OANDA:GBPCAD has tapped into the 1.84617–1.85046 resistance zone, aligning with the 0.382–0.5 Fibonacci retracement and channel resistance. Price is showing signs of rejection with wicks and a bearish setup brewing- suggesting a potential continuation to the downside within the descending channel.
Current Market Conditions:
Price is respecting a well-defined descending channel, consistently printing lower highs and lower lows.
Recent rejection from the 1.84617–1.85046 resistance zone (Fibonacci 0.382–0.5 zone).
Structure still bearish; price remains below channel midline.
Support region stands around 1.84165, with further room toward 1.83203.
Fundamental Analysis/Outlook:
The Canadian Dollar is underpinned by stable oil prices and cautious BoC policy tightening bias, while the British Pound remains pressured due to soft economic data and BoE’s mixed tone on rate trajectory. With risk sentiment fragile and commodity demand still steady, CAD strength could persist, adding downward pressure to GBPCAD.
Targets:
TP1: 1.84165
TP2: 1.83203
TP3: 1.83000 (channel extension / -0.272 Fib)
Risk Management:
Stop-loss: Above 1.85046 (Fibonacci 0.5 + structural high)
R:R of approximately 1:2.5 on current setup.
Watch for volatility during CAD and GBP news—tighten stops if needed.
Technical Outlook:
As long as price holds below 1.84617 and fails to break above the descending channel, the bearish outlook remains intact. Look for confirmation via bearish engulfing candle or lower time frame break of 1.84165. A decisive break below this level could accelerate a fall toward 1.8320 support.
Conclusion:
GBPCAD remains in bearish territory, rejecting a significant supply zone. With sellers defending the structure and no bullish breakout in sight, we anticipate further downside unless buyers reclaim 1.8500+. Let the chart lead—trade what you see, not what you feel.
Sign-off:
"In markets, clarity often lies just beyond the fear. Trade the levels, not the noise."
💬 I’d love to hear your thoughts- drop a comment, boost the post, and follow for more sharp setups. Stay focused and trade wisely!