EUR/NZD SELLERS WILL DOMINATE THE MARKET|SHORT
Hello, Friends!
EUR/NZD pair is trading in a local uptrend which we know by looking at the previous 1W candle which is green. On the 17H timeframe the pair is going up too. The pair is overbought because the price is close to the upper band of the BB indicator. So we are looking to sell the pair with the upper BB line acting as resistance. The next target is 1.915 area.
Disclosure: I am part of Trade Nation's Influencer program and receive a monthly fee for using their TradingView charts in my analysis.
✅LIKE AND COMMENT MY IDEAS✅
Forex market

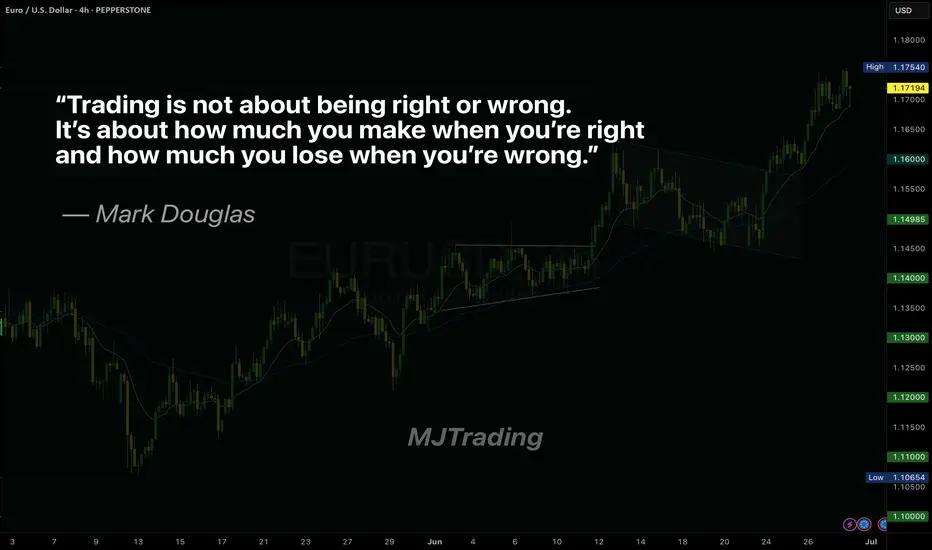
Master Your Edge: It’s Not About Just Being Right
Most traders obsess over being right on every trade. But the truth is, consistent profitability doesn’t come from perfect predictions—it comes from disciplined risk management.
Mark Douglas reminds us:
“Trading is not about being right or wrong. It’s about how much you make when you’re right and how much you lose when you’re wrong.”
Focus less on proving yourself right, and more on protecting your capital when you’re wrong. That’s how professionals thrive in uncertain markets.
#MJTrading
#TradingPsychology #MarkDouglas #ForexMindset #TraderMindset #EURUSD #TradingQuotes #ForexLife #RiskManagement #TradingDiscipline #ForexEducation #ChartOfTheDay #PriceAction #MindOverMarkets
AUD/CAD IS VERY BULLISHI see a possible continuous upward movement to complete the 3rd leg / 3rd phase or whatever you wanna call. So i will see how it goes.
Happy Trading

Eurusd Short-term bearish EUR/USD is showing bearish momentum, breaking below key support with lower highs forming. Selling pressure is increasing amid a stronger USD outlook, favoring a short position.

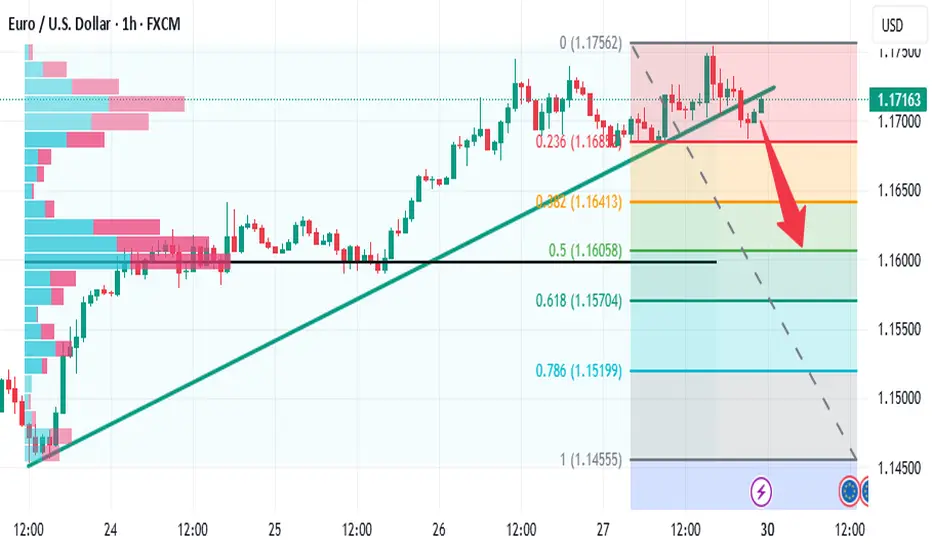
EUR/USD – Smart Money Trap at 1.18? Massive Rejection Ahead 1. Technical Context
The pair has been moving inside a well-defined bullish channel since May, forming higher highs and higher lows. Price is currently hovering around 1.1718, approaching the upper boundary of the channel and a key weekly supply zone (1.1750–1.1850).
➡️ Potential scenario:
A short bullish extension toward 1.1780–1.1820 to trigger stop hunts, followed by a bearish rejection toward 1.1500, and potentially 1.1380.
The daily RSI is overbought (>70), suggesting a likely short-term correction.
2. Retail Sentiment
80% of retail traders are short, with an average entry around 1.1318.
This signals a liquidity cluster above current highs, increasing the likelihood of a fake bullish breakout followed by a sell-off.
➡️ Contrarian insight: Retail heavily short → market may push higher first to wipe them out before reversing lower.
3. COT Report – USD Index (DXY)
Non-commercials (speculators) increased their short exposure on USD (+3,134).
Commercials cut their short positions (-1,994), indicating a potential bottoming on the dollar.
➡️ Conclusion: USD strength could return soon → bearish pressure for EUR/USD.
4. COT Report – EUR FX
Non-commercials increased longs on EUR (+2,980) and sharply reduced shorts (-6,602) → market is now heavily net long.
Commercials remain net short (581,664 vs 417,363 longs).
➡️ Over-leveraged spec longs → vulnerable to downside squeeze if macro sentiment shifts.
5. Seasonality
June tends to be mildly bullish for EUR/USD.
July historically shows even stronger upward performance over the last 5–10 years.
➡️ Shorts are high risk in the very short term, but a bearish setup is likely in the second half of July, especially if price action confirms.
6. Trading Outlook
📍 Short-Term Bias: Neutral to bullish toward 1.1780–1.1820
📍 Mid-Term Bias: Bearish on rejection from supply area and break of channel
🎯 Key Levels:
1.1780–1.1850: critical decision zone (liquidity + weekly supply)
1.1500: first key support
1.1380: next downside target (demand zone + previous POC)
📌 Final Conclusion
The most likely play is a short setup from 1.1780–1.1850 on strong rejection, supported by:
Extreme retail positioning (80% short),
COT pointing to USD recovery,
Extended technical structure,
Overbought RSI on the daily chart.

EURUSD next week bearishNext week local bearish correction to area 1.16.
If bears broke that area then next target 1.154 and 1.15
But if bulls push price above 1.175 bullish trend continue to 1.18+
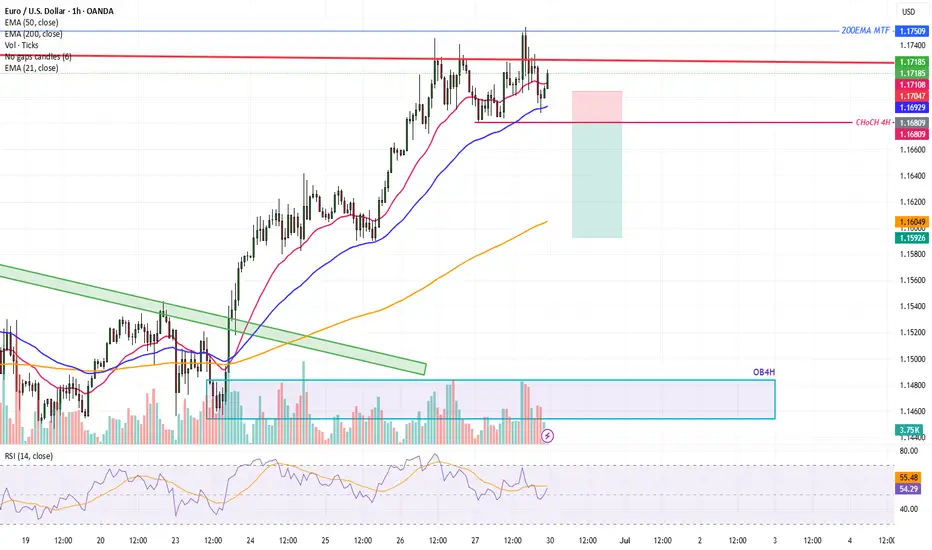
EURUSD Trade IdeaEURUSD is Bullish, on the weekly and daily time frame.
With RSI near the overbought region on the daily timeframe, there is a great probability that the trend perform a pull back to the support level @1.1590 zone.
If the trend break the CHocH at the 4Hr timeframe (body candle not wick), then will go short till 1.1600 level. If the news this coming week are in favor of the USD, we might see more drawdown till the Order block OB4H.
Let's be patient and watch the market carefully
Good Luck!
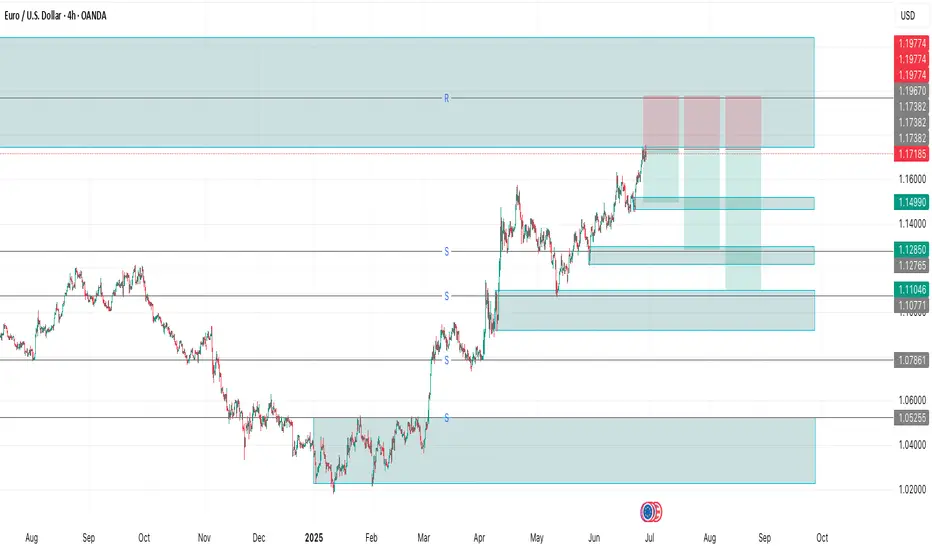
EUR/USD 4H – Approaching Major Supply Zone | Potential Mid-Term EUR/USD 4H – Approaching Major Supply Zone | Potential Mid-Term Reversal
Euro has extended its bullish rally into a historically strong supply/resistance zone around 1.17185 – 1.19774, which aligns with the previous rejection zone from mid-2024. Price is showing signs of slowing down near this upper boundary.
🔍 Key Technical Highlights:
Strong Supply Zone (1.1718 – 1.1977): A major resistance area that previously triggered sharp sell-offs. This zone is now retested after months of bullish recovery.
Momentum Divergence Potential: Price has climbed aggressively, but with signs of exhaustion visible on the lower timeframe candles.
Demand Zones Below:
First support at 1.15998
Followed by deeper demand areas at 1.14990, 1.12850, and 1.11046 – all marking clean reaction zones.
📊 Trade Setup:
Bias: Short (swing position)
Sell Entry Zone: 1.17185 – 1.19774
Stop Loss: Above 1.19800 (above key supply zone)
Take Profit Targets:
TP1: 1.15998
TP2: 1.12850
TP3: 1.11000
🧠 Tactical Note:
Watch for bearish confirmation (engulfing candle / structure break) before executing entries. A clean rejection from the supply zone could provide an attractive swing setup with a favorable risk-reward profile.
USDCAD Trade Plan 26/06/2025Dear Traders,
🧠 USD/CAD Technical Analysis – June 26, 2025
On the 4H chart, we observe a confirmed breakout from the descending trendline, followed by a correction. Price is now retracing toward the demand zone between 1.3635 – 1.3610, which is expected to act as support.
✅ Support Zone: 1.3635 – 1.3610
📌 Resistance Zone: 1.3885 – 1.3925
🎯 Final Target: 1.4020
🛡 Stop Loss: Below 1.3515
⚖ Risk-to-Reward Ratio: 1 : 3.17
The structure of higher lows along with the broken trendline confirms a bullish bias. A confirmation candle in the demand zone may offer a solid long entry opportunity.
Regards,
Alireza!

USDCAD possible Long ideaUSDCAD seems to have turned bullish and doing a retracement in H4.
Based on existing confirmation, there is a chance that it reach to liquidity level 1.37392
This is for educational purpose only. Not an investment or financial advise.

Possible SHORT idea for NZDSGD in H4 timeframe NZDSGD in H4 Timeframe seems to be in downtrend and broke previous swing low.
Possible SELL opportunity in NZDSGD in H4 timeframe. It is a late entry, be mindful on risk management.
This is for educational purpose only. Not an investment or financial advise.

USDJPY Potential UpsidesHey Traders, in tomorrow's trading we are monitoring USDJPY for a buying opportunity around 144.400 zone, USDJPY is trading in an uptrend and currently is in a correction phase in which it is approaching the trend at 144.400 support and resistance area.
Trade safe, Joe.

EURUSD: Support & Resistance Analysis for Next Week 🇪🇺🇺🇸
Here is my latest structure analysis
and important supports & resistances for EURUSD for next week.
Consider these structures for pullback/breakout trading.
❤️Please, support my work with like, thank you!❤️
I am part of Trade Nation's Influencer program and receive a monthly fee for using their TradingView charts in my analysis.

GBPNZD Short Idea
GBPNZD is showing signs of a potential bearish reversal after a strong rally. Price has reached a key resistance level, and momentum is weakening. I’m looking for confirmation with a lower high or bearish candlestick pattern before entering short.

GBPJPY Major Resistance Breakout Ahead📈 GBP/JPY Technical Analysis – 4H Time Frame 🔍
GBPJPY has maintained its ascending structure and recently broke above the previous supply zone at 196.900, signaling bullish strength.
🎯 Entry Idea:
Watch for a retracement to the 196.900 zone — now turned potential demand — for a possible long entry.
📌 Technical Targets:
1st Target: 198.600 (key resistance)
2nd Target: 200.000 (psychological resistance level)
The breakout confirms bullish momentum — a clean retest could offer a solid risk-to-reward setup.
💬 Like, follow, and drop your thoughts in the comments!
📢 Join us for more real-time updates and smart trade setups.
— With love,
Livia 😜✨

EURGBP possible SELL idea in Daily TimeframeEURGBP possible SELL idea in Daily Timeframe.
EURGBP seems to be confirmed in downtrend. Second wave seems to have confirmed targeting the bottom of first wave 0.83730.
This is for educational purpose only. Not an investment or financial advise.

GBPUSD Selling From Bearish Order Block At 1.36200GBPUSD Technical Breakdown
Timeframe: 1H
Price has officially broken out of the descending channel and is now reacting from the bearish Order Block around 1.36200. We're looking for short opportunities as momentum shifts.
🎯 Bearish Targets:
🔻 1st Target: 1.35500 – Key Demand Zone
🔻 2nd Target: 1.34700 – Deeper Demand Zone
🔻 3rd Target: 1.34000 – Bullish Order Block
📉 Setup looks clean – watching PA confirmation on each level.
👇 Like, follow, comment, and join us for more updates & smart trade setups.
Trade smart. Trade safe. 💼✨
— Livia 😜

EURUSD Selling From bearish ob at 1.16100 strong sell📉 EURUSD Analysis – 4H Timeframe 📉
The pair is currently respecting an ascending channel, but we’re eyeing a potential reversal from the bearish Order Block (OB) around 1.16100 – a prime sell zone.
🎯 Technical Targets:
1st Target: 1.14500 – Demand Zone
2nd Target: 1.13000 – Demand Zone
3rd Target: 1.11000 – Key Support Level
This setup offers clean risk-reward with price action confirming supply pressure at the top.
🚨 Watch for confirmations before entering – smart entries win the game.
💬 Like, follow, comment your thoughts, and join the team for more real-time updates and insights!
With love,
Livia 😜💹

USDCHF Bullish Strong From Key Demand Zone 0.80400📉 USD/CHF Technical Outlook (4H Chart) 📈
The pair has been respecting a descending channel, recently tapping into a key demand zone around 0.80400. Bullish momentum is now building, signaling a potential reversal.
🎯 Upside Technical Targets:
1️⃣ 0.82000 – Initial Supply Zone
2️⃣ 0.83200 – Secondary Supply Zone
3️⃣ 0.84500 – Major Resistance Level
💡 Watch for bullish confirmation signals in the zone before entering. As always, manage your risk.
✨ Like, Follow, Comment, and Join us for more timely updates!
— Livia 😜 | #ForexWithLivia

USDJPY Ascending channel breakdown ahead selling strong📉 USDJPY Breaks Down!
Strong sell-off from the key supply zone at 145.500 – the ascending channel has been broken on the 1H timeframe, signaling momentum shift.
🎯 Technical Targets:
🔹 1st Target: 144.000 – key demand zone
🔹 2nd Target: 143.000 – strong support level
Bearish pressure is building — price action confirms the shift. Eyes on lower zones as sellers take control. 📊
🔔 Like, Follow, and Comment your thoughts!
💬 Join us for more timely market updates and clean setups!
#USDJPY #ForexAnalysis #TechnicalTrading #PriceAction #FXSetup #LiviaTrades 😜

AUD/USD 4H – Bearish Supply Zone Rejection & Mid-Term Short BiasAUD/USD 4H – Bearish Supply Zone Rejection & Mid-Term Short Bias
The Aussie has climbed into a major supply zone near the 0.67380 – 0.67540 area, which overlaps with a historical resistance range from late 2024. Price is currently testing the upper edge of this zone, showing signs of exhaustion.
🔍 Key Observations:
Supply Zone Reaction: The confluence of past resistance (clearly marked as 'R') and current bearish candle formations suggests a potential reversal setup.
Liquidity Grab & Rejection: The current push may be a liquidity sweep above recent highs, potentially trapping breakout buyers before a reversal.
Downside Targets:
First support area around 0.65311 – 0.65000, previously respected demand zone.
If momentum continues, extended targets lie at 0.62729, 0.60874, and 0.59206 – all aligned with previous price reactions and liquidity pockets.
📊 Trading Plan:
Bias: Short (mid-term swing)
Entry Zone: 0.67350 – 0.67540 (sell limit / wait for confirmation)
Stop Loss: Above 0.67650 (above last swing high)
Targets:
TP1: 0.65300
TP2: 0.62730
TP3: 0.60870
🧠 Risk Note:
Price has entered a high-probability reversal zone, but confirmation via bearish engulfing or lower-timeframe structure break is ideal before entering aggressively.

Last week of June EU outlookWeekly forecast for EU. We have seen a very bullish June so far. We approached a weekly POI before starting to consolidate.
We are now entering the last week of the month where the monthly candle's upper wick needs to be formed.
In this video I have identified a potential area where we could see the pullback take place.

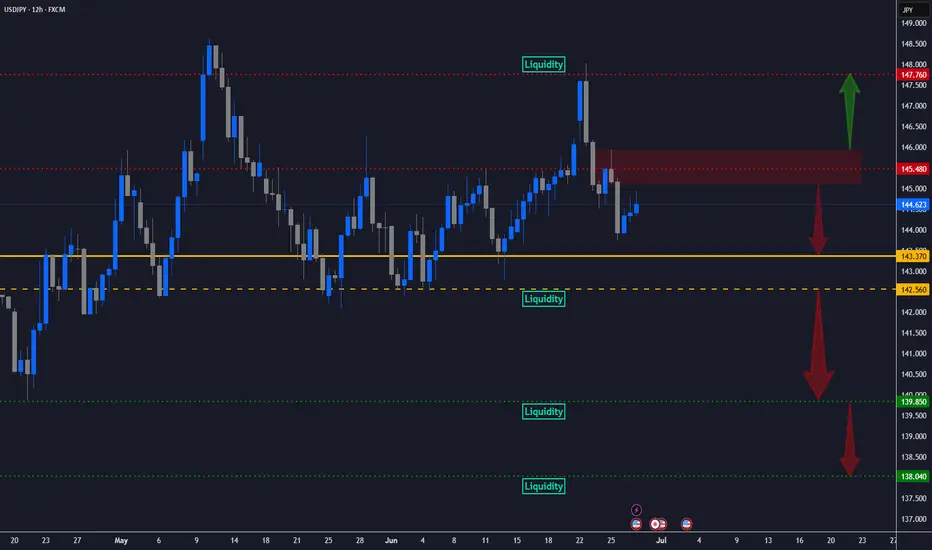
USD/JPY - Potential TargetsDear Friends in Trading,
How I see it,
FMV - PIVOT AREA @ 143.370 - 142.560
If price holds-rejects below 145.500
"SHORT" Targets:
1] 143.370
"Strong breach below 142.560 - PIVOT area":
2] 139.850
3] 138.040
A Strong breach above 146.000 psychological area-
"LONG" Target":
1] 147.760
I sincerely hope my point of view offers a valued insight.
Thank you for taking the time to study my analysis.