NZD/JPY: A Data-Driven Short SignalBefore I post a trade, I put it through a rigorous, multi-step analysis. Here’s exactly what I did for this NZD/JPY setup to build a data-driven case.
I Started with the 'Why': The Fundamental Story 📰
First, I identified the powerful divergence between the dovish RBNZ and the hawkish BoJ. This gave me my core bearish thesis for the pair.
I Challenged My Idea with Data: The Stress Test 🧠
A good story isn't enough. So, I ran this bearish idea through my mathematical models . My goal was to find any hidden risks and see if the hard data supported my fundamental view.
What My Analysis Revealed: A Warning and a Confirmation ⚠️
The data came back with two critical insights:
Confirmation: The models strongly validated the bearish direction with a high degree of mathematical probability.
Warning: They exposed a hidden danger—a standard entry had a very high probability of getting stopped out in the current market.
I Engineered the Solution: The Optimized Plan 🛠️
This is the most important step. I used these data insights to build a new trade plan from the ground up. The entry, stop loss, and take profit below are not guesses; they are the output of my analysis, specifically designed to navigate the risk the data uncovered.
The result is a trade with a huge 5.15-to-1 Risk-to-Reward ratio , where my fundamental view is now backed by a data-driven execution strategy. Let's get into it. 👇
The Complete Trade Plan
Strategy & Trade Parameters ✅
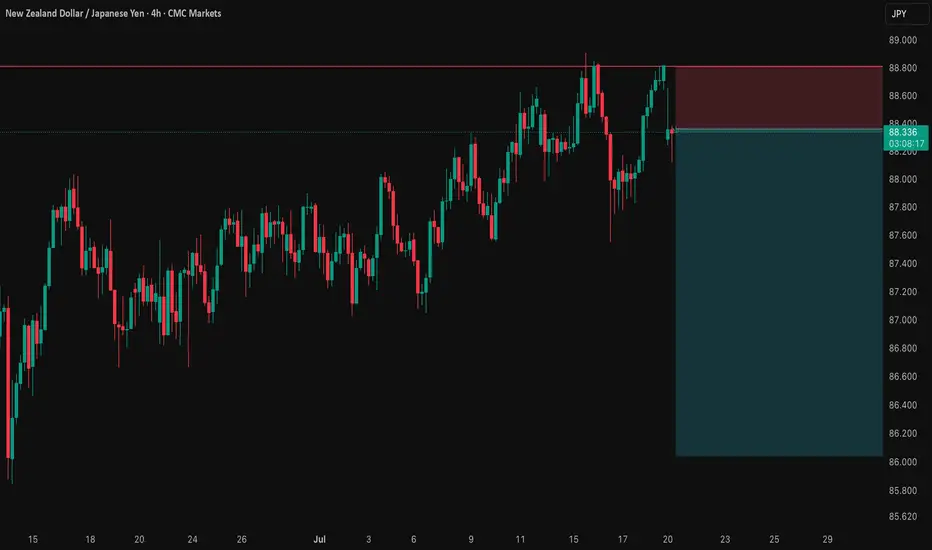
📉 Pair: NZD/JPY
👉 Direction: Short
⛔️ Entry: 88.35800
🎯 Take Profit: 86.04347
🛡️ Stop Loss: 88.80723
⚖️ Risk-Reward: 5.15
This setup represents my ideal trading approach: forming a strong fundamental thesis and then using disciplined, mathematical analysis to define the execution. The result is a plan where the direction is clear and the risk is precisely managed. Trade safe.
Forex market
Fundamental Market Analysis for July 21, 2025 USDJPYThe pair opened the week near 148.500, clawing back ground after Sunday’s upper‑house election saw Japan’s ruling LDP‑Komeito coalition lose its majority. The outcome clouds the fiscal outlook and raises the probability of additional stimulus, a combination that tends to undermine the yen as investors anticipate higher public borrowing and a looser policy mix.
At the same time, subdued inflation and stagnant real wages have pushed expectations of Bank of Japan tightening into late‑2025 at the earliest. With the 10‑year US‑Japan yield gap hovering near yearly highs, capital continues to flow from low‑yielding JGBs into higher‑yielding US assets, reinforcing dollar demand against the yen.
Dollar strength is also underpinned by persistent tariff worries and a Federal Reserve that maintains a cautious stance rather than rushing to cut rates. Given these fundamentals, USDJPY could retest the psychological 150.000 barrier, while dips below 147.500 are likely to be viewed by the market as opportunities to re‑establish long positions rather than the start of a deeper correction.
Trading recommendation: BUY 148.500, SL 147.500, TP 149.500

AUDCHF Bullish BiasPrice continued to make lower lows and lower highs, clearly showing a downtrend. After price made an accumulation schematic 2 set-up, it entered in a mark-up phase. Now, price is forming another accumulation again before heading bullish.

EURUSD - M15 Supply Zone RetestThe current price action shows that the market is expected to first fill the Fair Value Gap (FVG) area, which acts as a price inefficiency zone demanding liquidity clearance. After the FVG is filled, the price is anticipated to retest the Higher Time Frame (HTF) Supply Zone, which serves as a strong resistance area.
Following the retest of the supply zone, the prevailing downtrend is likely to resume, pushing the price downwards towards the HTF Demand Zone. This demand zone is identified as a key support level where buying interest is expected to emerge, potentially halting the decline temporarily or initiating a reversal.
This trading plan emphasizes waiting patiently for the FVG fill as a prerequisite step before looking for a supply zone retest confirmation to enter short positions targeting the demand zone below, aligning with the overall bearish trend continuation.

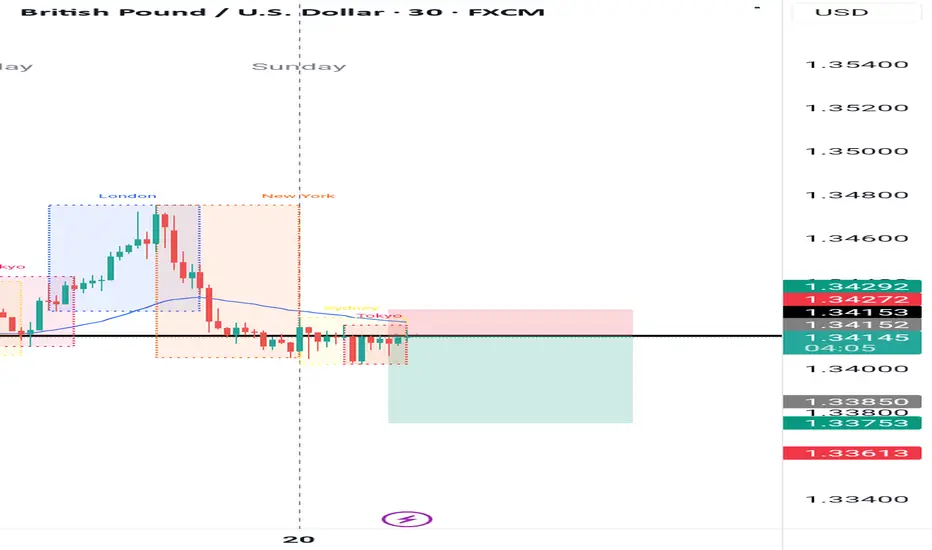
Sell gbpusd Downtrend trend
Bearish trend
Lower lows
Retracement entry
Start of the week
Use proper risk management
Trump era
GBPJPY 15-Minute Analysis with Supply and Demand Zones1. Market Context
The price recently experienced a strong upward move followed by a rejection at the Higher Time Frame (HTF) Supply Zone near the 200.051 level.
Key levels have been identified including an HTF Supply Zone (resistance area) and HTF Demand Zone (support area).
2. Price Structure and Key Levels
The chart marks a weak high (x-weak high) near the supply zone which indicates possible exhaustion of upward momentum.
A break of structure (x-bos) was followed by a retracement to the supply zone.
The HTF Demand Zone around 198.070 marks a strong support area from which price might potentially rebound.
3. Trading Plan and Execution
Entry: Consider a short (sell) position near the HTF Supply Zone (around 199.8 to 200.05) after confirmation of bearish rejection or reversal patterns.
Target: Set the take profit near the HTF Demand Zone (around 198.07), which represents a strong support level.
Stop Loss: Place a stop loss just above the HTF Supply Zone to protect against unexpected breakouts.
Trade Management: Expect a possible retest or small pullback after the initial move from the supply zone before continuing the downward trend.
4. Outlook and Strategy
The primary expectation is a downward movement from the supply zone to the demand zone.
Watch for price action cues such as bearish engulfing candles or strong rejection wicks at the supply zone to confirm entry.
If price breaks above the HTF Supply Zone strongly, reconsider the bearish bias for possible trend shifts.

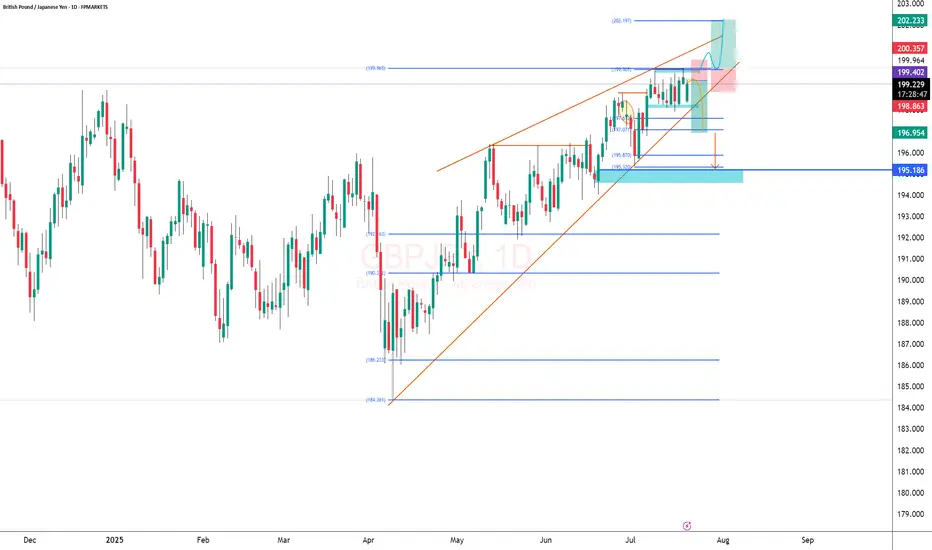
GBPJPY DECLINE SOONER OR LATEROn the Daily we see a clear uiptrend. However, Price is converging creating a rising wedge pattern. Conservatively we wait for price to break the last low that was formed before entering a sell but aggressively we want to enter our sell trade where Market open leaves a gp to filll @199.74 wit ha 95 pips stop loss and a 240 pips TP. should our bullish trendline be broken then we wait for retest to sell price down to 195.186
On the buy side we want to see a breakout and close above our last high for trend continuation.
A retest of that breakout is an ideal entry point for our buy trade @ 199.402 with 110 pips stop loss and 2RR
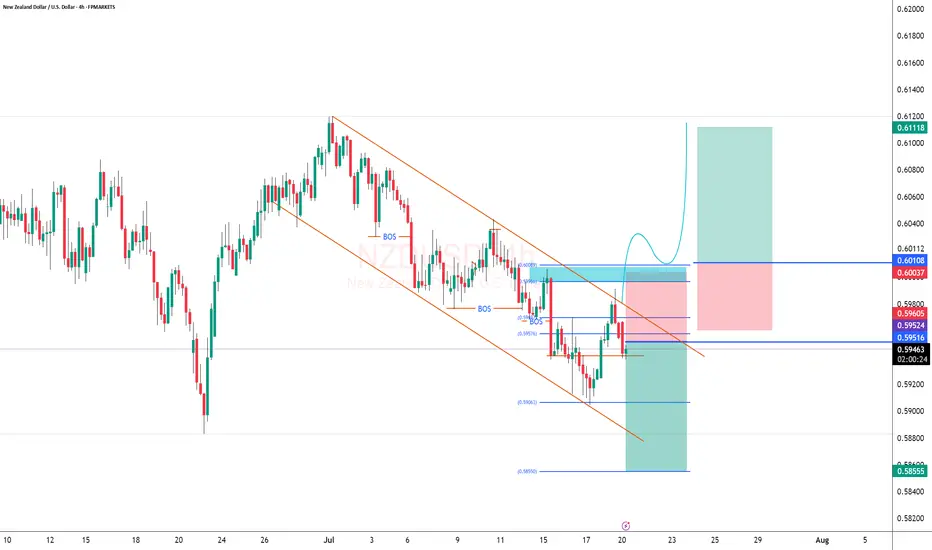
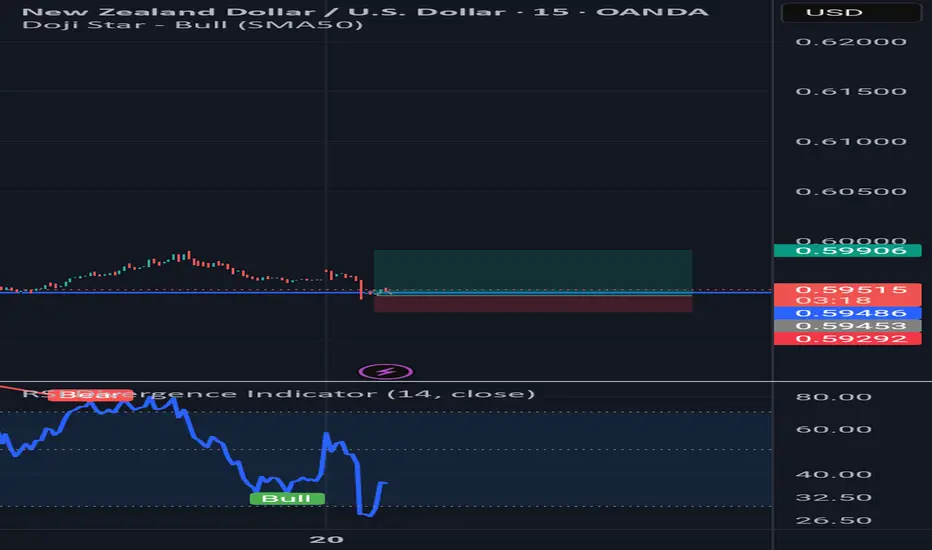
NZD/USD to GO DOWN AMOTHER 86 PIPS?Wit hprice still firmly in our down channel creating new highs and lows, we would want to see price continue on its downward projection with entry @ 0.59515 giving us a drop down to at least 0.58555 with stop loss @0.60037

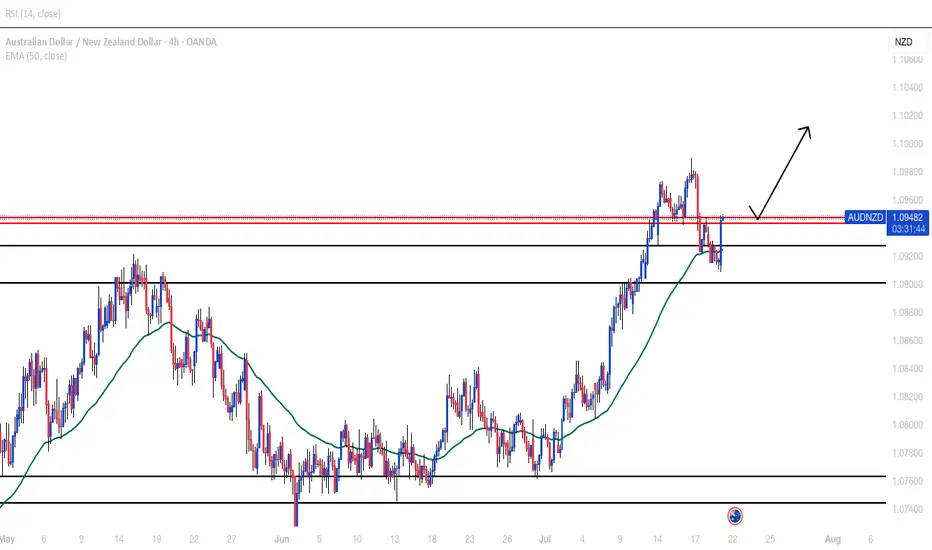
AUDNZD BULLISH CONTINUATIONBroke out of daily resistance, made the retracement now waiting for the H4/H1 resistance to be broken then look for buys. 1st target at next H4 resistance around 1.10100
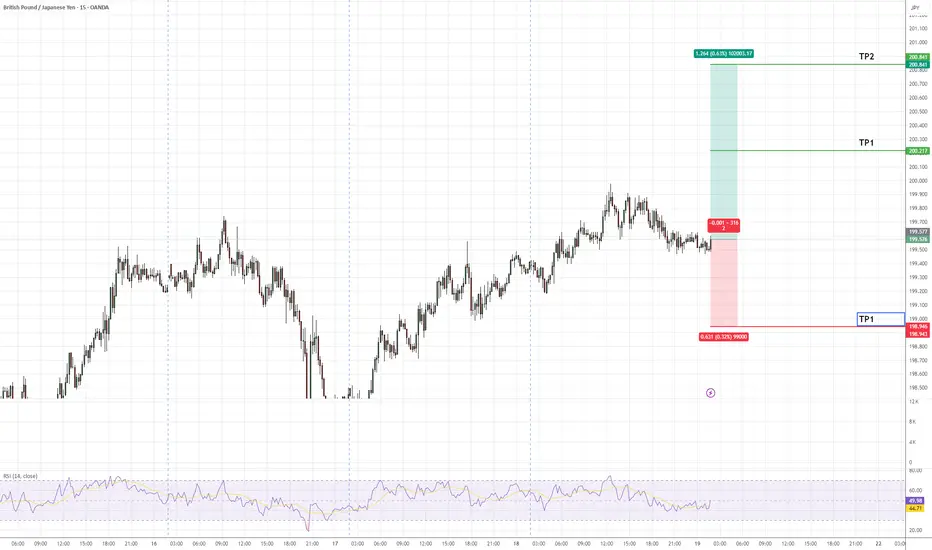
Potential Bullish Trade in GBPJPYGBPJPY continues to exhibit strong bullish momentum, with price action aligning with the prevailing uptrend. The pair is projected to advance towards the identified target zones (TP1 and TP2) as marked on the chart. A stop-loss level (SL) has been defined to manage downside risk effectively.
Traders are advised to monitor key support and resistance levels for potential confirmations as the setup develops.
Let's Go from here It's another good time to find a buy position.
Please follow for more updates and encourage my efforts

GBP/USD Bullish Setup: Targeting 1.35633 and 1.36667This 5-hour chart for GBP/USD shows a bullish trend within an ascending channel. The chart highlights two target zones: the first at 1.35633 and the second at 1.36667. A buy signal is indicated near the 1.34080 support zone, suggesting potential upward movement toward the marked resistance targets.

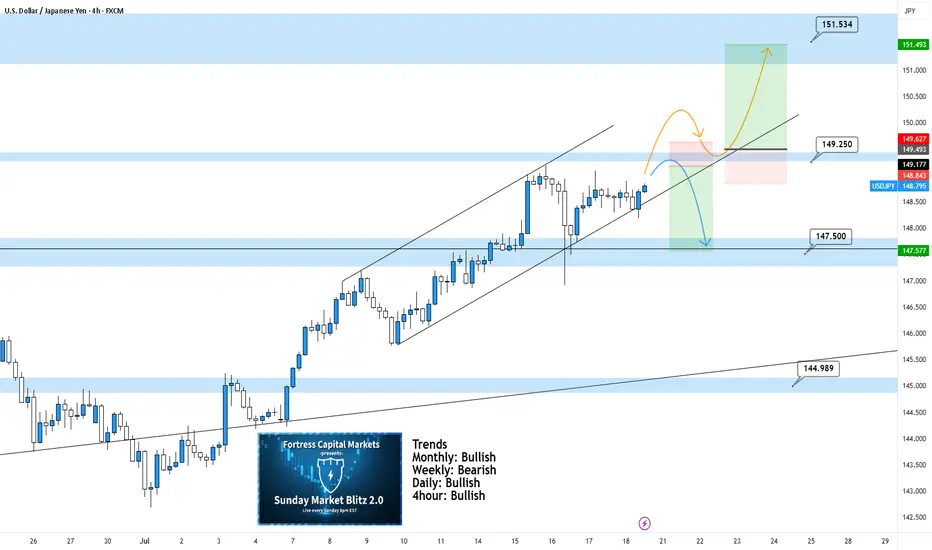
USDJPY 4Hour TF - July 20th,2025USDJPY 7/20/2025
USDJPY 4Hour Neutral Idea
Monthly - Bullish
Weekly - Bearish
Daily - Bullish
4Hour - Bullish
UJ is looking better than a couple weeks ago and at least we can spot some decent setups for the week ahead. These are NOT perfect setups but we have two scenarios that we are ready for if price action shows it is ready too. Here are the two scenarios we’re looking at for the week:
Bullish Continuation - We can see UJ in a nice 4hour channel but we are currently seeing a bit of flat price action. For us to consider UJ long setups again we would need to be convinced. Look for a break above our 149.250 zone with a confirmed higher low above. This would be enough to consider longs and target higher toward key levels of resistance.
Bearish Reversal - If price action continues to stall, this bearish setup will become more and more likely. Ideally, we want to see some strong rejection from our 149.250. If this happens look to target lower toward 147.500.
GBPUSD is in the Selling DirectionHello Traders
In This Chart GBPUSD HOURLY Forex Forecast By FOREX PLANET
today GBPUSD analysis 👆
🟢This Chart includes_ (GBPUSD market update)
🟢What is The Next Opportunity on GBPUSD Market
🟢how to Enter to the Valid Entry With Assurance Profit
This CHART is For Trader's that Want to Improve Their Technical Analysis Skills and Their Trading By Understanding How To Analyze The Market Using Multiple Timeframes and Understanding The Bigger Picture on the Charts

GBP/JPY: Possible short position in the coming daysGBP/JPY has reached a key psychological level at 200, where we often see institutional manipulation—false breakouts or stop hunts are common at such milestones. With major UK events and the BoJ rate decision set for July 30, a deep correction could be engineered here before the next bullish leg resumes.

GBPJPY in Trend ReversalSell Limit
Entry Price 200.690
Stop Loss 201.260
Risk 1%
Lot Size 0.65
TP (1RR) 200.120
TP (5RR) 197.840

EURUSD - Bullish Bias with Tactical Short Setup• Pair: EURUSD
• Bias: Bullish overall | Tactical short into demand
• HTF Overview (4H):
• Bullish structure confirmed.
• Price took out SSL liquidity — likely draw is internal structure OB below.
• Expecting deeper pullback before continuation.
• MTF Refinement (30M):
• Looking for price to sell off into 4H OB.
• Price already mitigated 30M OB and rejected — watching for follow-through.
• LTF Confirmation (5M):
• Still in analysis mode — waiting on a CHoCH from 5M OB.
• Green lines on chart reflect 5M internal structure.
• Entry Zone:
• Enter short only after 5M shift confirms.
• Ride short into 4H OB demand zone.
• Targets:
• Short-term: 30M lows.
• Major: 4H OB for bullish reaction.
• Mindset Note:
• No rush to enter — analysis leads, execution follows.
• Let price deliver confirmation before switching to trader mode.
Bless Trading!

Pay attention this week!My scenario for this pair for the coming week.
The marked area is highly valid.
Enter the trade if the marked area is reached with confirmation.
.
.
Follow the page for more analysis.

Week of 7/20/25: AUDUSD AnalysisLast week's price action was bearish and this week I will follow bearish order flow unless internal 1h structure continues to be bullish. I'm going to look for shorts after 1h internal structure is broken as confirmation, then take trades down to the daily demand zone and then look for bullish signals.

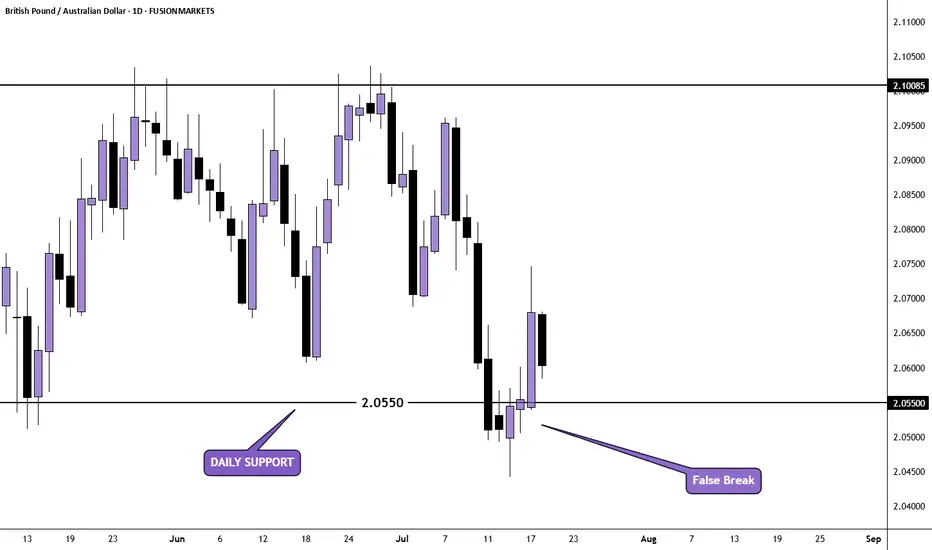
GBP/AUD Daily AnalysisPrice was ranging between resistance at 2.10085 and support at 2.05500
After breaking below support last week, price retested but then closed back above (false break). We may now see buyers step in again.
If you agree with this analysis, look for a trade that meets your strategy rules.
GBPUSD - Bullish Bias with Tactical Short Setup• Pair: GBPUSD (GU)
• Bias: Bullish overall | Tactical short for OB mitigation
• HTF Overview (4H):
• Price broke major highs — clear bullish intent.
• Pullback last week suggests price is targeting 4H SSL for liquidity + OB mitigation before further upside.
• MTF Refinement (30M):
• Price structure currently presents a temporary sell bias.
• BSL has been taken — confirming liquidity sweep.
• Eyeing price to run lower into 4H OB zone.
• LTF Confirmation (5M/1M):
• Waiting on LTF confirmation to ride the move down into the 4H OB.
•Only entering after analysis is complete and CHoCH shows cleanly.
• Entry Zone:
• Tactical short after LTF confirms.
• Final long setup expected from 4H OB after mitigation.
• Targets:
• 30M lows as short-term target.
• 4H OB as the major zone for potential bullish reversal.
• Mindset Note:
• It’s analysis before execution.
• Staying in sync with HTF logic while sniping intraday plays for precision entries.
Bless Trading!
