CHF-JPY Resistance Ahead! Sell!
Hello,Traders!
CHF-JPY keeps growing in
An uptrend and the pair is
Locally oversold so after the
Retest of the horizontal
Resistance of 186.000
From where we will be
Expecting a local bearish
Pullback on Monday
Sell!
Comment and subscribe to help us grow!
Check out other forecasts below too!
Disclosure: I am part of Trade Nation's Influencer program and receive a monthly fee for using their TradingView charts in my analysis.
Forex market

Buy usdjpyStrong buy continues
Still not complete its bullish correction
It can retrace a few pips from market levels but long term buy expected

Sell Gbpjpy Strong selling
Weekly strong resistance arrived
Respected it many times
Now we expecting to respect it one more time
Weekly and daily overbought pair

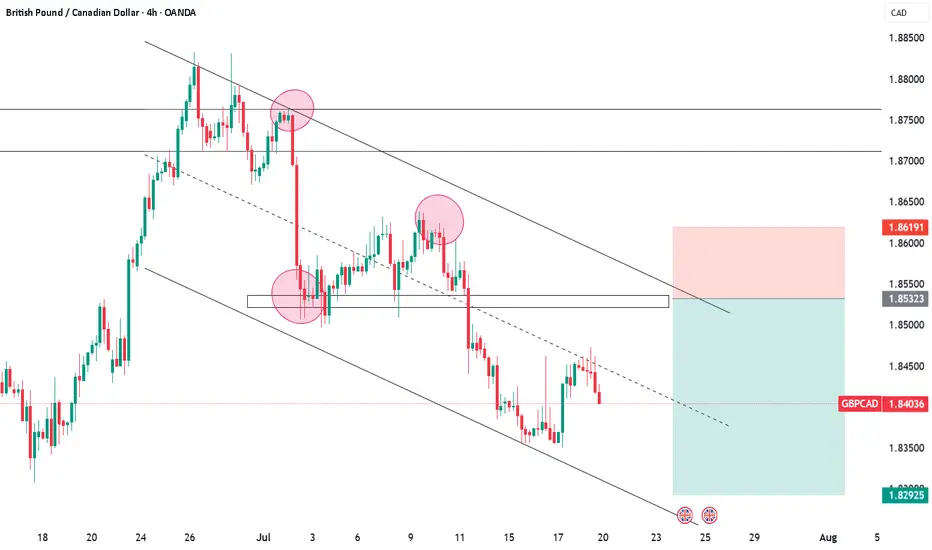
Sell eurcadStrong sell expected in next few weeks
Already too overbought in monthly and weekly time frame
Buy trend Already breaks and retested again
Strong selling area

Selling eurjpyStrong sell coming in next weeks
Already 8 consecutive weekly buy candels
Now strong bearish correction expected
Weekly too overbought pair
Strong selling area reached

Buy usdchfStrong buy expected from marked level
Already oversold in months chart
Here strong bullish correction needed

USD/JPY: The 150.00 Rejection SignalThe chart for USD/JPY looks like a simple one-way street going up. But underneath the surface, my quantitative models are in a state of conflict, and that's a high-clarity signal that something is about to change.
This isn't a signal to short right now. This is a signal to be patient and watch for a very specific setup that the "smart money" models are anticipating.
The Quant Conflict 🤖
My analysis involves several different mathematical models. Here's the situation:
One model, which is great at tracking trends, is still signaling BUY , following the obvious upward momentum.
However, two other, more complex models that analyze the relationships between economic data are now flashing a SELL signal. They are detecting underlying weakness that the price chart isn't showing yet.
When the simple trend model and the complex structural models disagree, it often means a major turning point is near. We are siding with the smarter models, but we need price action to confirm their warning.
The Game Plan 📊
We will use the 150.00 level as our "line in the sand." We are waiting for the market to fail at this level and then break down, which would confirm the bearish quant signal. This is our high-probability entry trigger.
Here is the exact setup we are waiting for:
📉 THE SETUP: A patient short position, waiting for confirmation of a breakdown.
👉 ENTRY: We enter only on a confirmed daily close below 148.00.
⛔️ STOP LOSS: Place the stop just above the psychological wall at 150.25.
🎯 TAKE PROFIT: Our primary target is the major support level at 145.00.
This is a setup where patience pays. We are letting the market do the hard work and show its hand before we commit. Let's watch this one closely.

What to expect next on CHFJPYTrend remains strongly bullish from the higher timeframe. Monthly, & weekly. Daily timeframe is slightly bullish but currently loosing some momentum. Therefore, from the H4 timeframe, we’re likely to see either a break above the current resistance to form a new high or were to see a decline below the key level.

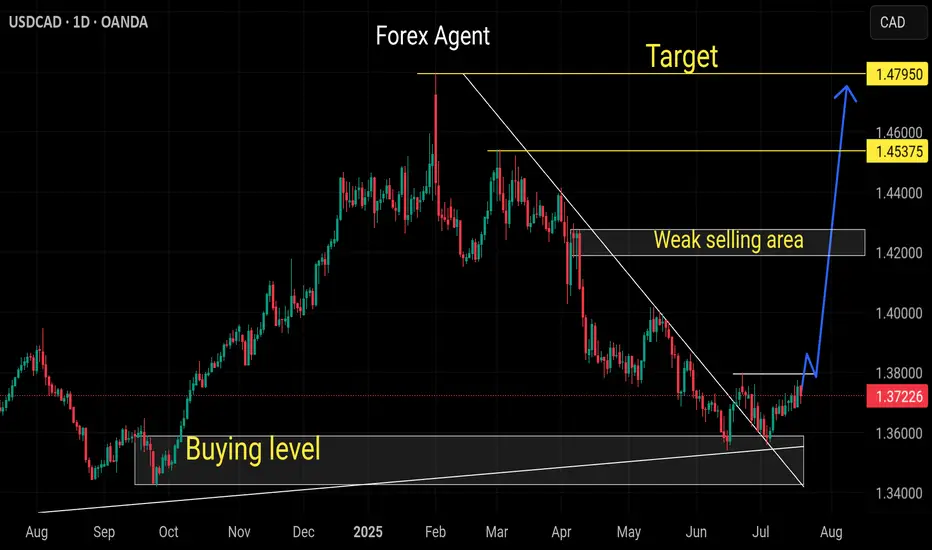
Buying usdcadUsdcad completed its bearish wave now ready for the bullish correction
Daily sell trend already breaks and Candel close above the sell trend
AUDCAD in Downtrend ContinuationSell Limit
Entry Price 0.8945
Stop Loss 0.8975
Risk 1%
Lot Size 1.14
TP (1RR) 0.8915
TP (2.5RR) 0.8866

Eurusd sellStrong sell expected
Monthly and weekly overbought pair
Daily time frame buy trend break confirmation
Ready for the bearish correction

Weekly selling gbpusdStrong bearish pressure comes
On day time frame buy trend breaks and candel close below the trend
Monthly still overbought
Trend shift now and bearish correction expected till our target

Strong sell gbpusdStrong bearish expected from this level
Monthly still overbought pair
Daily buy trend broken and candel closes below the buy trend indicates the selling pressure

AUDJPY in Uptrend ContinuationBuy Limit
Entry Price 96.684
Stop Loss 96.446
Risk 1%
Lot Size 1.56
TP (1RR) 96.922
TP (3.2RR) 97.440

NZDUSD - BUY Idea on H1A Long opportunity on NZD/USD after a divergence was formed, potentially changing the trend as it breaks the trendline and marks new Higher highs after a series of Lower lows and lower highs.
- Entry to be taken around the 0.5 to 0.61 fib levels
- Stop Loss below the previous Low

GBPUSDGBPUSD has correction due before any more downside.
Disclosure: We are part of Trade Nation's Influencer program and receive a monthly fee for using their TradingView charts in our analysis.

EURUSDEURUSD needs one more push up as correction before a drop.
Disclosure: We are part of Trade Nation's Influencer program and receive a monthly fee for using their TradingView charts in our analysis.

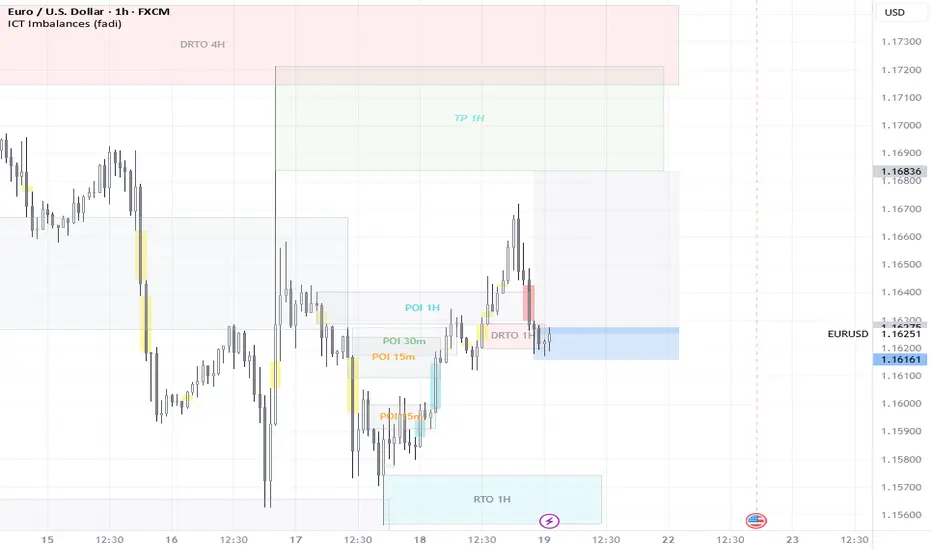
EUR/USD - Pattern & SMA PerspectiveDear Friends in Trading,
How I see it,
Keynotes:
A] Under Pressure
B] Previous Swing Support Area
C] Contraction/Accumulation
Rangebound pattern:
1) Short term correction trend holding firm
2) Decisive breakout expansion required above or below range
3) Pair suggests that greenback bulls are in charge at this time
I sincerely hope my point of view offers a valued insight.
Thank you for taking the time study my)) analysis.

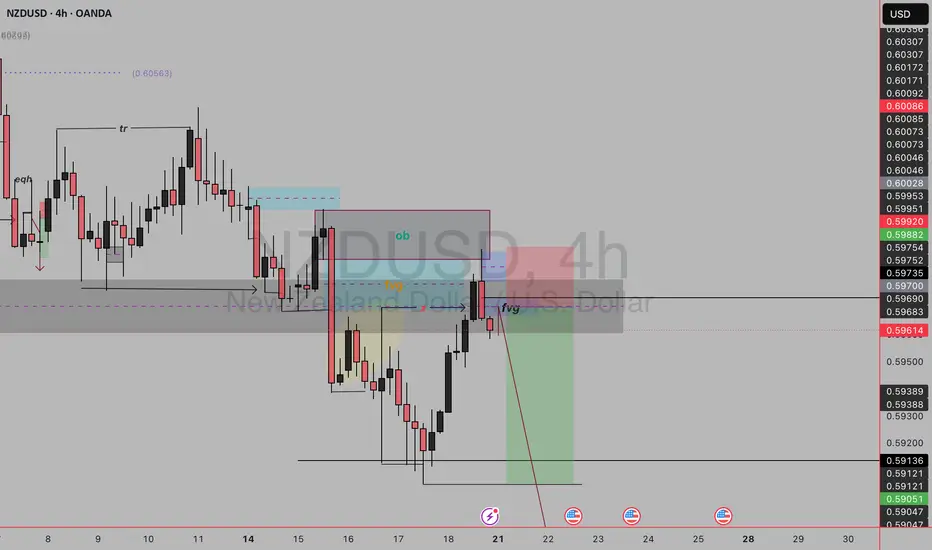
NZDUSD SELL SETUP✅Market Structure: Bearish.
Clear lower highs and lower lows.
Price retraced into a premium zone after the last strong sell-off.
✅Key Elements in the Setup
1.OB (Order Block) – Blue zone:
This is the last bullish candle before a strong bearish move.
Acts as a supply zone.
Price tapped into it before reacting.
2.FVG (Fair Value Gap) – Highlighted (yellow & blue):
Imbalance in price action (inefficient movement).
You marked this as confluence — price filled the FVG and rejected.
3.Liquidity Grab (EQH):
Equal highs were taken out — classic liquidity sweep.
This hints at a manipulation before the real move.
✅Entry Trigger:
Price pushed into the OB + FVG zone.
Rejection candle + break of structure on the lower timeframe.
You entered after that shift.
✅Trade Components
Entry: After price rejects OB + FVG area.
Stop Loss: Above OB and liquidity sweep (~0.60086).
Take Profit: Into previous low (~0.59047) or a bit lower for extended target.
Risk:Reward: Very healthy, above 1:4.
✅ Confluences Supporting the Sell
Premium pricing (above 50% of swing range).
Price filled FVG + tapped OB.
Liquidity above EQH taken.
Sharp rejection from that zone.
FVG left behind on the way down = price likely to seek lower inefficiencies.
EURUSD - BUY - Doesn't need any more confirmations..EURUSD - Bumping short term. Get your entries. Doesn't need any more confirmations..

NZDUSD keep bullish The main direction is bullish
-Price has rebounded from the 4H Order Block (OB), showing strong bullish intent and forming a Change of Character (CHOCH).
- Currently, the price is pulling back and is expected to retest the 1H Fair Value Gap (FVG) around 0.5940–0.5947, which aligns with a liquidity zone.
- A successful rejection from the FVG followed by a break and close above the descending trendline will strengthen the bullish structure and confirm continuation.
We have to enter points:
1- 0.5947 Where have a liquidity
2- 0.5940 Where FVG
Targets:
1- Resistance 1 (around 0.6040) – First take-profit area. Watch for candle behavior here (e.g.,
long upper wick or rejection); a close below could signal a short-term pullback.
2- Resistance 2 (around 0.6118) – Final bullish target if momentum continues.
