EURUSD SELL IdeaBe ready to sell, this is the pullback in order to push higher
Take Profit around 61.8%-70% Fib
Goodluck and trade wisely
Forex market

NZDUSD M15 I Bullish Bounce Off Based on the M15 chart analysis, the price is approaching our buy entry level at 0.6014, a pullback support.
Our take profit is set at 0.6053, a pullback resistance that aligns with the 100% Fib projection.
The stop loss is placed at 0.5975, a swing low support.
High Risk Investment Warning
Trading Forex/CFDs on margin carries a high level of risk and may not be suitable for all investors. Leverage can work against you.
Stratos Markets Limited (tradu.com ):
CFDs are complex instruments and come with a high risk of losing money rapidly due to leverage. 63% of retail investor accounts lose money when trading CFDs with this provider. You should consider whether you understand how CFDs work and whether you can afford to take the high risk of losing your money.
Stratos Europe Ltd (tradu.com ):
CFDs are complex instruments and come with a high risk of losing money rapidly due to leverage. 63% of retail investor accounts lose money when trading CFDs with this provider. You should consider whether you understand how CFDs work and whether you can afford to take the high risk of losing your money.
Stratos Global LLC (tradu.com ):
Losses can exceed deposits.
Please be advised that the information presented on TradingView is provided to Tradu (‘Company’, ‘we’) by a third-party provider (‘TFA Global Pte Ltd’). Please be reminded that you are solely responsible for the trading decisions on your account. There is a very high degree of risk involved in trading. Any information and/or content is intended entirely for research, educational and informational purposes only and does not constitute investment or consultation advice or investment strategy. The information is not tailored to the investment needs of any specific person and therefore does not involve a consideration of any of the investment objectives, financial situation or needs of any viewer that may receive it. Kindly also note that past performance is not a reliable indicator of future results. Actual results may differ materially from those anticipated in forward-looking or past performance statements. We assume no liability as to the accuracy or completeness of any of the information and/or content provided herein and the Company cannot be held responsible for any omission, mistake nor for any loss or damage including without limitation to any loss of profit which may arise from reliance on any information supplied by TFA Global Pte Ltd.
The speaker(s) is neither an employee, agent nor representative of Tradu and is therefore acting independently. The opinions given are their own, constitute general market commentary, and do not constitute the opinion or advice of Tradu or any form of personal or investment advice. Tradu neither endorses nor guarantees offerings of third-party speakers, nor is Tradu responsible for the content, veracity or opinions of third-party speakers, presenters or participants.

AUDUSD H4 I Bullish Bounce Off Based on the H4 chart, the price could fall toward our buy entry level at 0.6554, a pullback resistance.
Our take profit is set at 0.6617, aligning with the 127.2% Fib extension.
The stop loss is set at 0.6508, an overlap support.
High Risk Investment Warning
Trading Forex/CFDs on margin carries a high level of risk and may not be suitable for all investors. Leverage can work against you.
Stratos Markets Limited (tradu.com ):
CFDs are complex instruments and come with a high risk of losing money rapidly due to leverage. 63% of retail investor accounts lose money when trading CFDs with this provider. You should consider whether you understand how CFDs work and whether you can afford to take the high risk of losing your money.
Stratos Europe Ltd (tradu.com ):
CFDs are complex instruments and come with a high risk of losing money rapidly due to leverage. 63% of retail investor accounts lose money when trading CFDs with this provider. You should consider whether you understand how CFDs work and whether you can afford to take the high risk of losing your money.
Stratos Global LLC (tradu.com ):
Losses can exceed deposits.
Please be advised that the information presented on TradingView is provided to Tradu (‘Company’, ‘we’) by a third-party provider (‘TFA Global Pte Ltd’). Please be reminded that you are solely responsible for the trading decisions on your account. There is a very high degree of risk involved in trading. Any information and/or content is intended entirely for research, educational and informational purposes only and does not constitute investment or consultation advice or investment strategy. The information is not tailored to the investment needs of any specific person and therefore does not involve a consideration of any of the investment objectives, financial situation or needs of any viewer that may receive it. Kindly also note that past performance is not a reliable indicator of future results. Actual results may differ materially from those anticipated in forward-looking or past performance statements. We assume no liability as to the accuracy or completeness of any of the information and/or content provided herein and the Company cannot be held responsible for any omission, mistake nor for any loss or damage including without limitation to any loss of profit which may arise from reliance on any information supplied by TFA Global Pte Ltd.
The speaker(s) is neither an employee, agent nor representative of Tradu and is therefore acting independently. The opinions given are their own, constitute general market commentary, and do not constitute the opinion or advice of Tradu or any form of personal or investment advice. Tradu neither endorses nor guarantees offerings of third-party speakers, nor is Tradu responsible for the content, veracity or opinions of third-party speakers, presenters or participants.

EURUSD H4 I Bearish Reversal Based on the H4 chart, the price is trading near our sell entry level at 1.1692, a pullback resistance.
Our take profit is set at 1.1610, a pullback support.
The stop loss is set at 1.1765, a swing high resistance.
High Risk Investment Warning
Trading Forex/CFDs on margin carries a high level of risk and may not be suitable for all investors. Leverage can work against you.
Stratos Markets Limited (tradu.com ):
CFDs are complex instruments and come with a high risk of losing money rapidly due to leverage. 63% of retail investor accounts lose money when trading CFDs with this provider. You should consider whether you understand how CFDs work and whether you can afford to take the high risk of losing your money.
Stratos Europe Ltd (tradu.com ):
CFDs are complex instruments and come with a high risk of losing money rapidly due to leverage. 63% of retail investor accounts lose money when trading CFDs with this provider. You should consider whether you understand how CFDs work and whether you can afford to take the high risk of losing your money.
Stratos Global LLC (tradu.com ):
Losses can exceed deposits.
Please be advised that the information presented on TradingView is provided to Tradu (‘Company’, ‘we’) by a third-party provider (‘TFA Global Pte Ltd’). Please be reminded that you are solely responsible for the trading decisions on your account. There is a very high degree of risk involved in trading. Any information and/or content is intended entirely for research, educational and informational purposes only and does not constitute investment or consultation advice or investment strategy. The information is not tailored to the investment needs of any specific person and therefore does not involve a consideration of any of the investment objectives, financial situation or needs of any viewer that may receive it. Kindly also note that past performance is not a reliable indicator of future results. Actual results may differ materially from those anticipated in forward-looking or past performance statements. We assume no liability as to the accuracy or completeness of any of the information and/or content provided herein and the Company cannot be held responsible for any omission, mistake nor for any loss or damage including without limitation to any loss of profit which may arise from reliance on any information supplied by TFA Global Pte Ltd.
The speaker(s) is neither an employee, agent nor representative of Tradu and is therefore acting independently. The opinions given are their own, constitute general market commentary, and do not constitute the opinion or advice of Tradu or any form of personal or investment advice. Tradu neither endorses nor guarantees offerings of third-party speakers, nor is Tradu responsible for the content, veracity or opinions of third-party speakers, presenters or participants.

EUR/USD Holding the Line: Bullish Channel Setup!Hi traders! Analyzing EUR/USD on the 30-min timeframe, price is currently reacting near the bottom of a well-defined ascending channel, signaling a potential bullish continuation within the trend:
🔹 Entry: 1.17071
🔹 Take Profit: 1.17423
🔹 Stop Loss: 1.16825
After a corrective move downwards, price tapped into a key trendline support, aligning with prior structure and psychological level near 1.1700. The RSI is showing a bullish divergence near oversold levels, adding confluence to a possible reversal.
As long as price holds above the lower boundary of the channel, bulls may look to target the mid-to-upper region of the range, aligning with previous highs and dynamic resistance.
🟢 The trend remains intact as long as higher lows are respected.
⚠️ DISCLAIMER: This is not financial advice. Every trader is responsible for managing their own risk and strategy.


EURUSD 1D IDEAThis is the reason why we are so blindly short this pair while not looking at the HTF
For the 1W timeframe, it completed 61.8% pullback of the closed above 50% Fib heading to 38.1% or might be higher to 26%
But so far for the 1D TF, we can see will retest the fvg at 68.1% Pullback or even higher at 78%
We keep looking at 1H to 4H target but don't see the high time frame Fib. This cause a lot of people losing the money. So trade wisely, this is my 1D target, CHOCH is also confirmed in the Daily chart, it will heading back to 1.80 right now or even higher at 1.10.
However, if the price keep surpase 1.13, Week Fib will come into play
Goodluck


Long Eurcad Long Eurcad but close it before weekly candle closes today. You don't necessarily have to wait till take profit. You can start taking profits after 30pips

AUD/USD Long Setup – 1H Demand to 4H Supply 🧠 Trade Breakdown:
Price tapped into a clear 1H demand zone and showed bullish reaction. The setup is targeting a 4H supply zone above. This is a classic demand-to-supply flow with room for clean upside.
⸻
📍 Key Confluences:
• Strong 1H demand (reaction zone clearly respected)
• Clear bullish structure: Higher highs + higher lows
• 4H supply zone above as natural target zone
• Momentum supported by clean bullish candles on the way up
• Entry aligns with a pullback to demand zone wick rejection
⸻
📈 Trade Setup:
• Pair: AUD/USD
• Entry: 0.65881
• Stop Loss: 0.65570 (below demand wick)
• Take Profit: 0.66583 (4H supply zone)
• Risk-to-Reward (RR): ~1:6
⸻
🧠 Mindset:
Let this setup breathe — it’s demand into higher timeframe supply. No need to panic on minor retracements. Trust your bias. Let the setup develop. Protect your capital, but don’t micromanage the trade.
“Trade Simple. Live Lavish.”

GBP/USD Outlook: Can Buyers Step Back In?Hi everyone,
GBP/USD continues to consolidate below the 1.36200 level, with multiple failed attempts to break higher confirming this area as firm resistance for now. Following the rejection, price moved lower into the 1.35300–1.34600 demand zone, where we’re watching closely for signs of renewed buying interest.
This area has previously acted as a support base, and a reaction here could set the stage for another push higher. However, if buyers fail to step in, there is scope for a deeper retracement before the next attempt to reclaim resistance. We’ll be monitoring the price action closely to see which scenario plays out.
A drop into this area was highlighted as the more probable short‑term path, and we’re now looking for GBP/USD to find support in this region; and more importantly, to hold above the 1.33800 level to form the base for another push higher.
As previously noted, a decisive break above 1.37500 would renew our expectation for further upside, with the next key target around 1.38400. We'll be monitoring price action closely to see how it unfolds.
We’ll continue to provide updates on the projected path for GBP/USD as price approaches this target.
The longer-term outlook remains bullish, and we expect the rally to continue extending further from the 1.20991 January low towards 1.40000 and 1.417000.
We’ll be keeping you updated throughout the week with how we’re managing our active ideas. Thanks again for all the likes/boosts, comments and follows — we appreciate the support!
All the best for the week ahead. Trade safe.
BluetonaFX

Buy Cadjpy if new high is made above current current You can wait for retracement or put buy stop above current handle. Readjust stop loss when you see 30pips profits

EUR/USD Testing Support — Will Buyers Step In Again?Hi Everyone,
Since our last update, EUR/USD is currently testing the 1.16680 support level. We’re watching for buying interest to emerge above the key 1.16450 zone; if price can stabilise here, we could see a retest of the highlighted resistance area around 1.17450.
Our broader outlook remains unchanged: as long as price holds above 1.16450, we continue to look for the pair to build momentum for another move higher in the coming sessions. A decisive break above last week’s high could attract fresh buying interest, paving the way for a push towards the 1.19290 area and ultimately 1.20000.
We'll be watching closely to see if this recovery gains traction and whether buyers can sustain the move above resistance. The longer-term view remains bullish, provided price continues to respect the key support zone.
We’ll keep updating you through the week as the structure unfolds and share how we’re managing our active positions.
Thanks again for all the likes/boosts, comments and follows — we really appreciate the support!
All the best for the rest of the week. Trade safe.
BluetonaFX

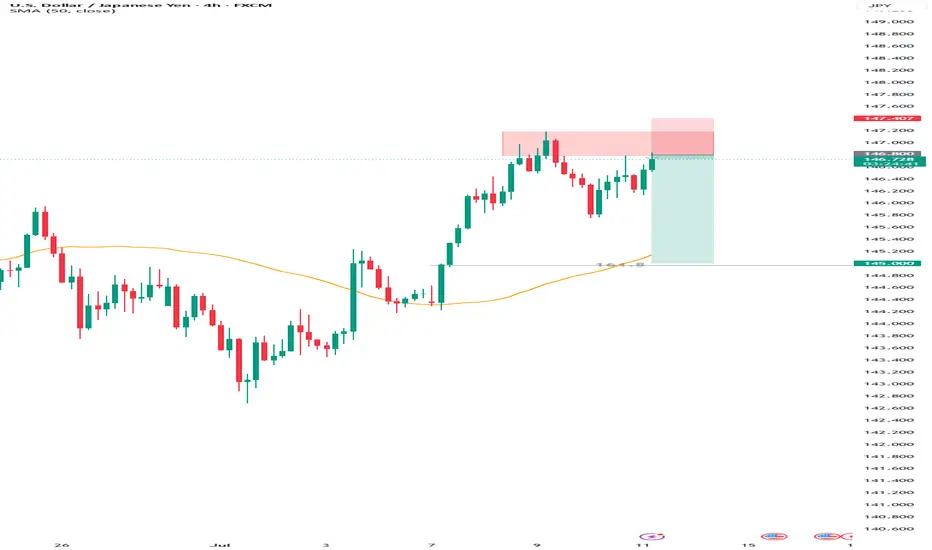
USDJPY Sell Idea Looking to sell between 146.800–147.180, targeting a move down to 145.000 with a stop loss at 147.400 to manage risk. This setup aims to catch a pullback from resistance after the recent rally, expecting the price to drop toward lower support.
As always, watch for bearish confirmation around the entry zone and trade with discipline.
Entry: 146.800 - 147.180
SL: 147.400
TP: 145.000
AUDUSD 60/5 Pullback Short1-hr chart showing bear and now the price is at sell zone. Wait for pull up and short.
RRR could be higher than +2R is the pull up is greater.

GBPJPY is still in pullbackGJ possibilities has been drawn on chart. GJ is in pullback still. It had developed liquidity around S&R Level and has taken. GJ may touch PD high today because it has already taken PD low. It may go towards the demand zone residing below PD low.

4 HOUR CONFIRMATION- USDCAD ENTRY UPDATEPrice tapped in our Weekly Demand ideal 👌 for long buys.
Previously i anticipated a trend shift H4 as guide , cmp price just break our int previous high meaning change a in trend as we anticipated
Now waiting for price to drop to our int demand then we rise or the breaker block can hold - major reactions

NZDCAD– Potential Bulish SetupPerfect! Since you're planning a **swing buy** on NZDCAD, here’s an updated **heading** and **description** tailored for your bullish outlook:
---
📈 NZDCAD Swing Buy Setup – Bullish
NZDCAD is showing signs of a potential bullish reversal from a strong support zone, presenting a promising swing buy opportunity.
This setup is ideal for patient traders looking to catch the next leg higher. Always follow your trading plan and apply proper risk management.

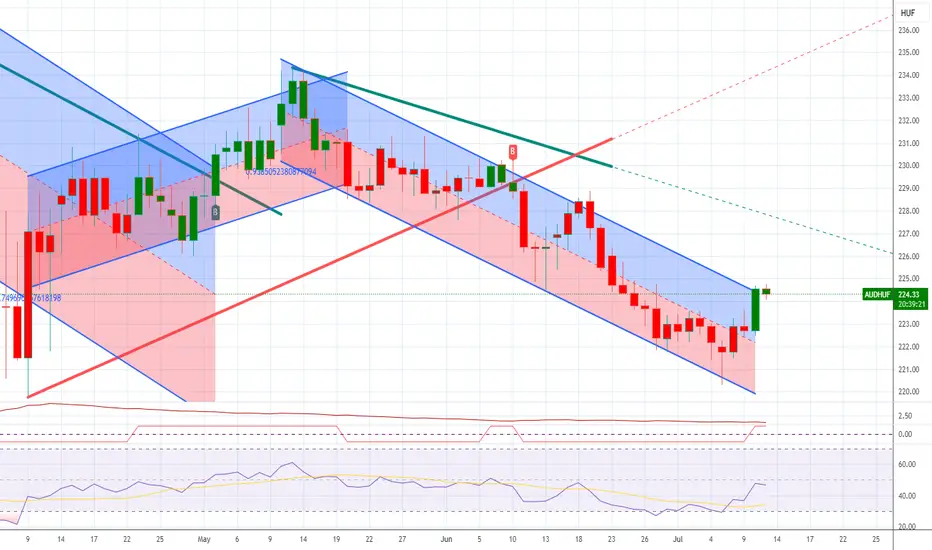
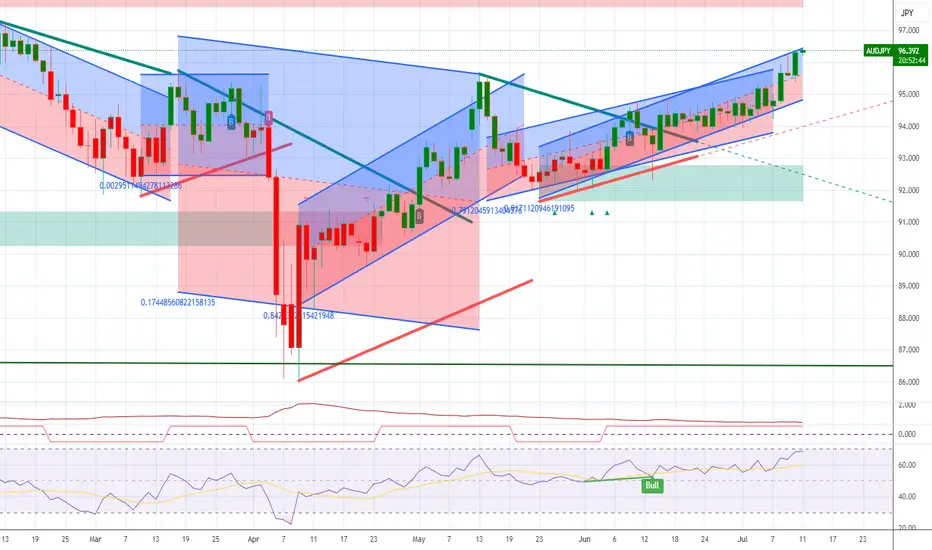
AUDHUF LongAUDHUF is now net long on the on the regression break.
All AUD pairs are on run and worth considering with the correct pair.
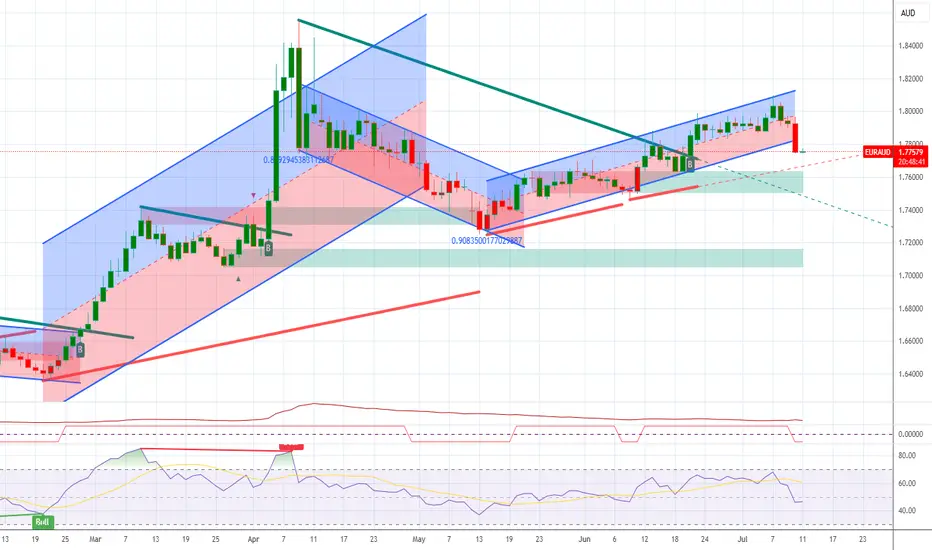
EURAUD ShortEURAUD is now net short on the regression break. It may be worth considering a trade here.
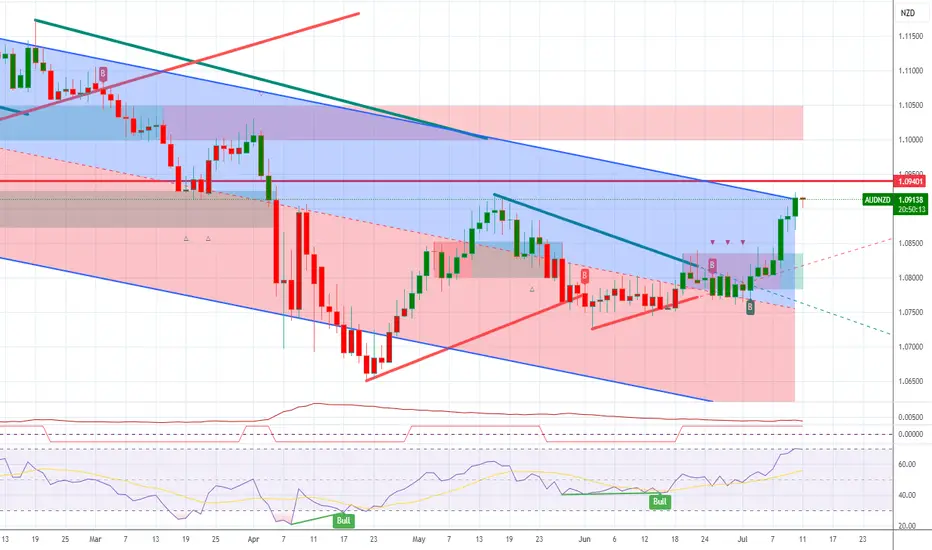
AUDNZD LongAUDNZD is now net long, and this is it's first break in months.
I am reviewing all AUD pairs.
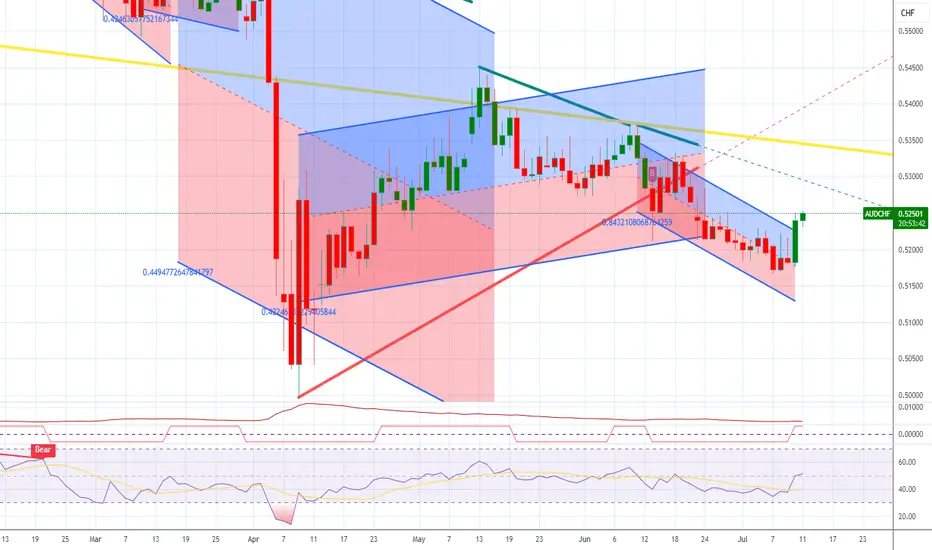
AUDCHF LongAUDCHF is not net long on the regression break.
I am consider all CHF pairs this morning.