Forex market


EURUSD: Support & Resistance Analysis For Next Week 🇪🇺🇺🇸
Here is my latest structure analysis and important supports/resistances
for EURUSD for next week.
Consider these structures for pullback/breakout trading.
❤️Please, support my work with like, thank you!❤️
I am part of Trade Nation's Influencer program and receive a monthly fee for using their TradingView charts in my analysis.

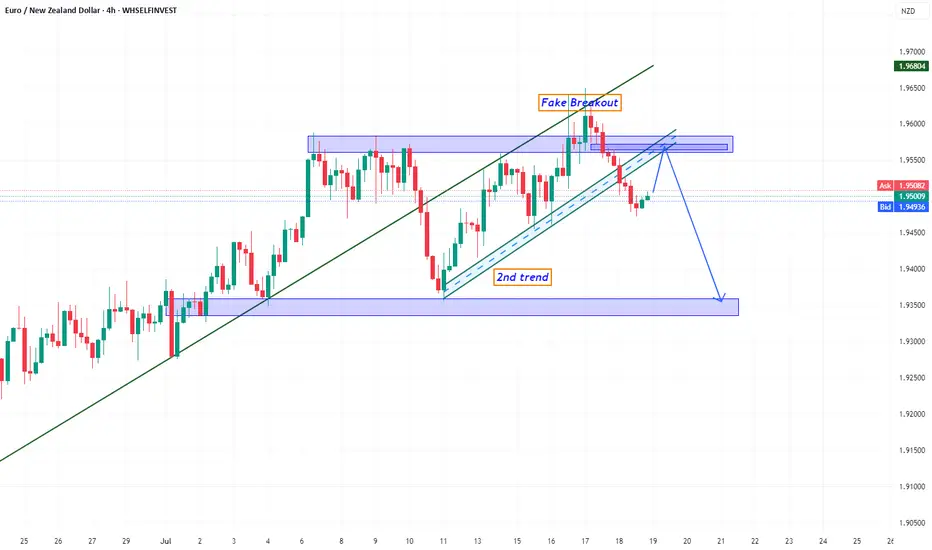
EURNZD BearishInitially, the price rejected the resistance zone and broke below the 4H ascending trendline, signaling a potential shift in momentum. It then retraced back to the resistance area, executing a false breakout, followed by a retest of the broken trendline — a classic liquidity grab setup to fuel further downside movement. This retest generated strong bearish momentum, leading to a breakdown of the second ascending trendline, similar to the previous price behavior.
At this stage, we anticipate a potential retest of the second trendline from below, which could act as new resistance before the bearish continuation resumes."
Polish zloty in trouble: Swiss franc is sharpening its teethTechnically, CHFPLN has completed a consolidation phase within a narrowing triangle and broke to the upside. The pair is now testing the 4.60 level (the 0.618 Fibonacci retracement) from below — a decisive zone. A breakout and confirmation above this area opens the path toward 4.705, which coincides with the 0.5 Fibo level and a local resistance. A pullback from that zone back to 4.60 is possible, but this time as a support retest. If the level holds, the targets remain: 4.91 and 5.13 - both marked by Fibonacci extensions and major long-term horizontal resistance. The EMAs are aligned in support of further upside, with price consistently trading above them.
Fundamentally, the Swiss franc remains a safe-haven currency, especially amidst increasing instability in the Eurozone. Weak growth in Germany, looming ECB policy easing, and rising inflationary pressures are all tilting investor interest toward CHF. Meanwhile, Poland faces political uncertainty, budgetary debates, and volatility in the agricultural and energy sectors. All of this strengthens the case for the franc in this pair.
Tactically, the game plan is straightforward: a confirmed breakout above 4.60 signals the start of a bullish impulse. The 4.60–4.705 zone is the key area of interest for buyers. If this zone is reclaimed and held, the next targets - 4.91 and 5.13 - remain valid, where large players may look to take profits.
If this scenario plays out, the zloty may soon be tuning into Polish radio to sing nostalgic songs about the golden days of its strength.

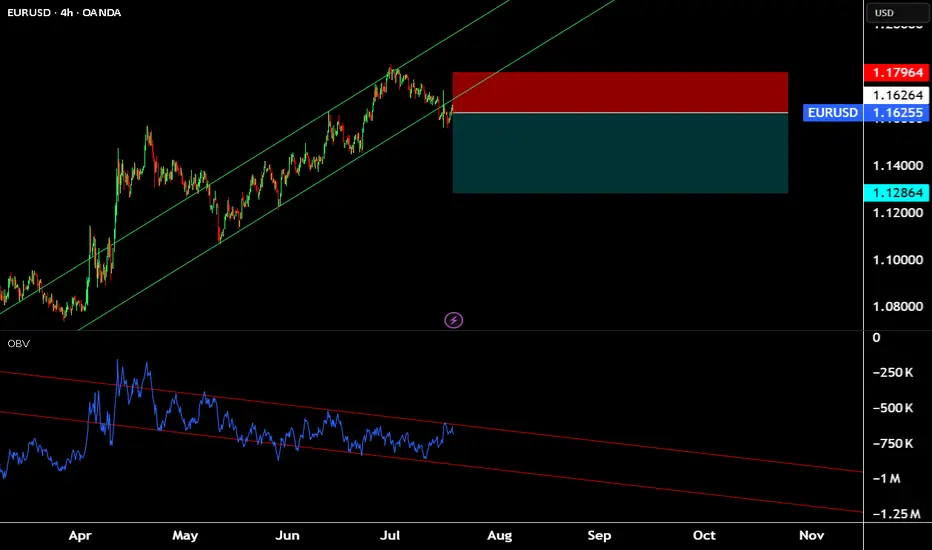
EURUSD potential being range recently story background:
1. a strong bullish momentum appear 23Jun - 1Jul
2. potential range of price level between 1.17176 and 1.15625
position enter criteria
1. if the price reach the key support lv 1.15451 and rebound with strong bullish momentum >>> the first entry point would be around 1.15693
2. if the price breakout the key resistance lv of 1.17183, i will wait for the price retest to around 1.16350 to long again

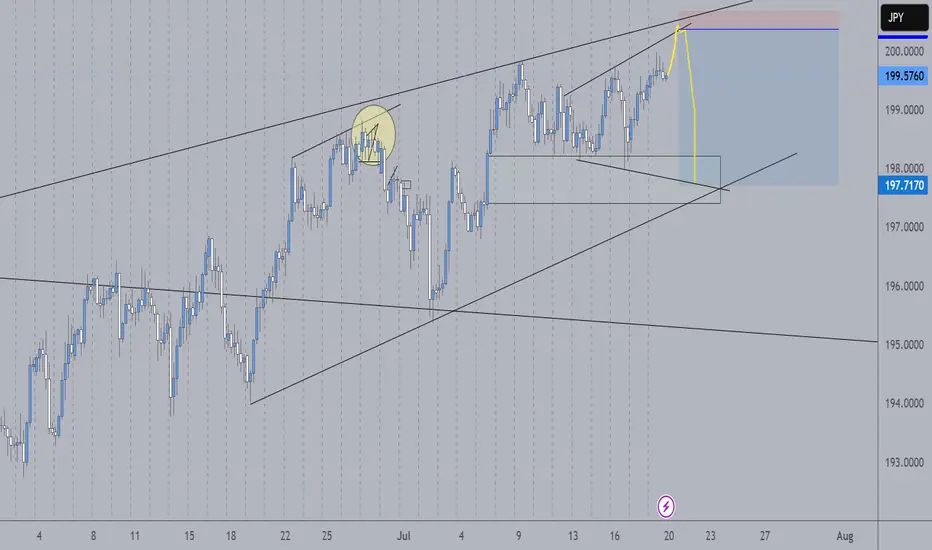
Sell gbpjpyIn the current chart, we are observing a range-bound trading pattern, with the price nearing the upper boundary, which is also a significant psychological level (200) . In the other hand a double top formation has emerged in this area, indicating strong resistance, as the price has previously touched this level multiple times.
As we approach this critical juncture, it is anticipated that the price may decrease and move toward the lower boundary of the range. Notably, there is a purple trend line representing an upward trend, which plays a crucial role in this analysis. As the price descends, it is expected to intersect with this purple line, making it an important area to set the first take-profit (TP) target.
If the price manages to break below the purple trend line, this could indicate a more pronounced bearish trend, providing opportunities to establish additional take-profit levels based on subsequent support or resistance zones. Traders should remain vigilant and adaptable, monitoring price action closely to optimize their trading strategies.

EURUSD Analysis week 30🌐Fundamental Analysis
The USD rose after June retail sales beat expectations and initial jobless claims fell to 221,000. However, the USD's gains were limited as US stocks rebounded late in the session.
On Friday morning, US stock index futures rose 0.2%, indicating that risk sentiment remains dominant. If this trend continues, EUR/USD could hold support.
The next focus is on the Consumer Sentiment and Inflation Expectations Index data from the University of Michigan. If the data is positive, the USD could regain support and put pressure on EUR/USD.
🕯Technical Analysis
EURUSD is in a corrective downtrend towards the 1.145 support. If this support zone is broken, the EURUSD trend will turn to a Downtrend. Currently, the main trading strategy will be to look for SELL points. After price reacted at EMA and trendline and headed to temporary bottom 1.156 and hit important support soon.
📈📉Trading Signals
SELL EURUSD 1.17500-1.17700 Stoploss 1.18000
BUY EURUSD 1.14500-1.14300 Stoploss 1.14000

EURCHF Is Going Up! Buy!
Here is our detailed technical review for EURCHF.
Time Frame: 9h
Current Trend: Bullish
Sentiment: Oversold (based on 7-period RSI)
Forecast: Bullish
The market is testing a major horizontal structure 0.931.
Taking into consideration the structure & trend analysis, I believe that the market will reach 0.936 level soon.
P.S
Overbought describes a period of time where there has been a significant and consistent upward move in price over a period of time without much pullback.
Disclosure: I am part of Trade Nation's Influencer program and receive a monthly fee for using their TradingView charts in my analysis.
Like and subscribe and comment my ideas if you enjoy them!

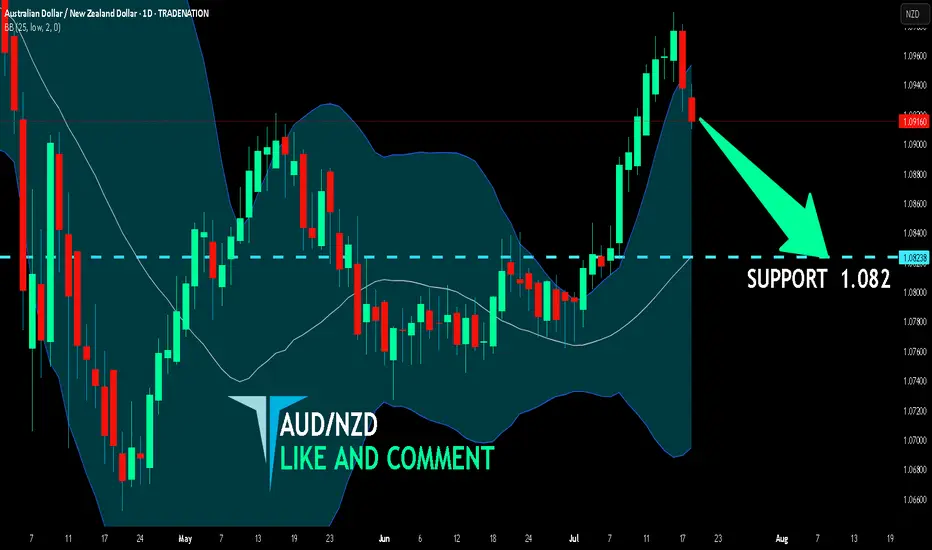
AUD/NZD SHORT FROM RESISTANCE
Hello, Friends!
The BB upper band is nearby so AUD/NZD is in the overbought territory. Thus, despite the uptrend on the 1W timeframe I think that we will see a bearish reaction from the resistance line above and a move down towards the target at around 1.082.
Disclosure: I am part of Trade Nation's Influencer program and receive a monthly fee for using their TradingView charts in my analysis.
✅LIKE AND COMMENT MY IDEAS✅

Audchf Am looking to take this trade I had de first entry last week but price didn't respect the zone I got in so early so am expecting a pull back to the zone den a reversal candle stick then i take the trade

AudcadAfter a bad loosing week looking to enter this audcad seeing it as a high probability setup expecting price to retrace back to de zone to create a left shoulder on the head and shoulder pattern that is forming on the 1h so when I see de retracment will take de trade

Time to play the Euro It's hard for me to remember the last time the Euro burned me. its been a long trend since liberation day. Time to play the Euro this week, Volume Divergence. Eurozone PMIs
GBPJPY POTENTIAL SHORT OPPORTUNITY ???Yes the gbpjpy is in a very strong uptrend. However it might meet some resistance soonwhich will slow down the bulls. Lets see how this plays out
GBPJPYStrong daily resistance breakout, consolidated for almost 2 weeks and formed a bullish flag on the H4. Lets see what price does this week.

GBPAUD🔍 Pair: GBPAUD
🕒 Timeframe: 15 Min
🔄 Strategy: Break of Structure (BoS) + Retest
🔹 Price has broken structure, showing bullish intent.
🔹 We’ve now entered the “Area of Interest” for a potential long entry.
🔹 Stop Loss is placed just below the last swing low, managing risk efficiently.
🔹 Waiting for bullish confirmation (strong candle or engulfing) inside the zone before entry.
📌 RSI is recovering, showing early momentum shift.
🎯 Targeting next supply zone above — watch for continuation.
🧠 Discipline is key — wait for the setup to complete. No confirmation = No trade.

GBPUSD POSSIBLE TREND CHANGE?Reached a strong weekly resistance and pushed down. Broke daily/H4 support. Retesting zone with 50EMA rejection. Looking at 1.32500 as 1st target
USDJPY BUY CONTINUATIONBroke out of daily resistance zone, made retest of both zone and 50EMA. H1 has a minor resistance that needs a clear breakout before looking for buying signals.

AUD_NZD GROWTH AHEAD|LONG|
✅AUD_NZD fell down sharply
But a strong support level was hit at 1.0910
Thus I am expecting a rebound
And a move up towards the target of 1.0930
LONG🚀
✅Like and subscribe to never miss a new idea!✅
Disclosure: I am part of Trade Nation's Influencer program and receive a monthly fee for using their TradingView charts in my analysis.

EUR-NZD Will Grow! Buy!
Hello,Traders!
EUR-NZD is making a local
Bearish correction while trading
In an uptrend along he rising
Support so after the pair hits
The support line a local bullish
Rebound is to be expected
Buy!
Comment and subscribe to help us grow!
Check out other forecasts below too!
Disclosure: I am part of Trade Nation's Influencer program and receive a monthly fee for using their TradingView charts in my analysis.

AUDUSD: Sell The Rip!Welcome back to the Weekly Forex Forecast for the week of July 21-25th.
In this video, we will analyze the following FX market:
AUDUSD
AUDUSD has been difficult to trade, as it chops its slow grind upwards. Last week it gave a bearish close. With the USD expected to continue to gain strength, look for sells directed to the liquidity lows in AUDUSD.
Enjoy!
May profits be upon you.
Leave any questions or comments in the comment section.
I appreciate any feedback from my viewers!
Like and/or subscribe if you want more accurate analysis.
Thank you so much!
Disclaimer:
I do not provide personal investment advice and I am not a qualified licensed investment advisor.
All information found here, including any ideas, opinions, views, predictions, forecasts, commentaries, suggestions, expressed or implied herein, are for informational, entertainment or educational purposes only and should not be construed as personal investment advice. While the information provided is believed to be accurate, it may include errors or inaccuracies.
I will not and cannot be held liable for any actions you take as a result of anything you read here.
Conduct your own due diligence, or consult a licensed financial advisor or broker before making any and all investment decisions. Any investments, trades, speculations, or decisions made on the basis of any information found on this channel, expressed or implied herein, are committed at your own risk, financial or otherwise.

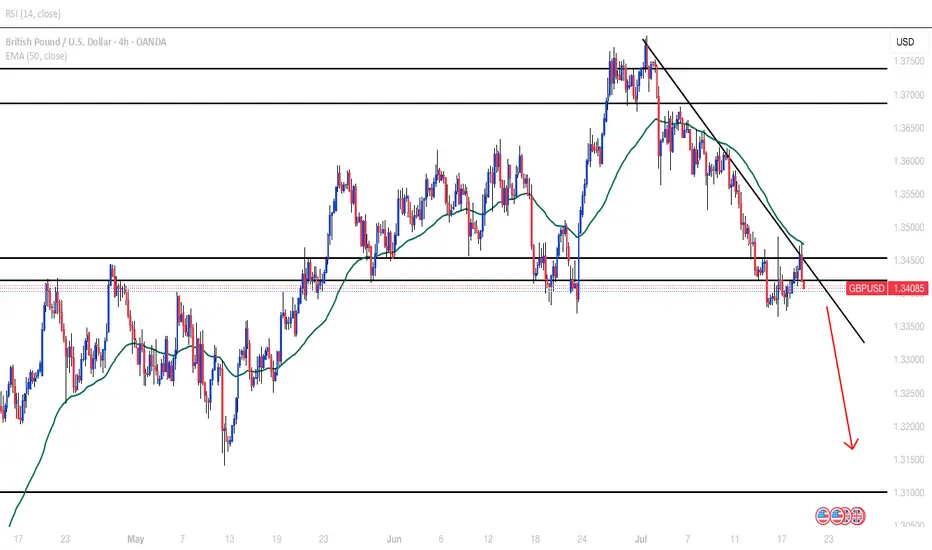
Gbpusd set upGBP/USD 4H Chart Analysis – Bearish Setup in Play
Current Price: 1.34080
Trend Bias: Bearish (short-term)
Indicators:
EMA (9, close) – Price is consistently trading below the 9 EMA, reinforcing bearish momentum.
Volume: No significant uptick in buying activity; selling pressure remains dominant.
Technical Overview:
The GBP/USD pair is currently exhibiting a descending triangle pattern on the 4-hour timeframe. This structure is typically a bearish continuation pattern, especially after the steep downtrend from early July.
Resistance Trendline: A series of lower highs is compressing price action towards support, creating a descending ceiling.
Key Support Zone: 1.3370–1.3380 region is acting as horizontal support. This level has been tested multiple times, increasing the chances of an eventual breakdown.
Price Action Outlook:
The chart suggests a potential breakdown scenario:
A clean break below the 1.3370 support could trigger further downside, potentially targeting the 1.3200 psychological level next.
If price manages to break above the descending trendline, this bearish setup would be invalidated and a short-term relief rally could occur.
Key Levels to Watch:
Support: 1.3370 (critical zone), 1.3200 (next downside target)
Resistance: 1.3450 (trendline resistance), 1.3600 (recent swing high)
Potential Trade Idea (Not Financial Advice):
Short Bias: Watch for a 4H candle close below 1.3370 for possible short entries.
Stop-Loss: Above the descending trendline (~1.3460).
Take-Profit Targets: 1.3300 and 1.3200.
Summary:
GBP/USD is under pressure, trading in a descending triangle. Price action suggests a bearish continuation is likely if support fails. Traders should monitor for a breakout or breakdown confirmation before taking action.
