GBPUSD July Playbook: Bearish Setup at Channel High GBPUSD just printed a CC SELL signal right at the top of its rising channel — setting the stage for a potential July pullback.
📌 Breakdown using Vinnie’s Trading Cheat Code System:
✅ RSI Overbought zone triggered
✅ CC Sell + Confirm Sell combo at channel resistance (~1.38)
✅ Price stretched far above the mean with no higher timeframe support nearby
✅ MACD histogram rolling over — momentum shift in play
🎯 Targets:
1.3500 (channel median / recent base)
1.3280 (deeper support / previous Confirm Buy area)
This looks like a textbook trap-the-buyers setup. Patience on the entry — I’ll be stalking rallies to sell into.
🧠 Tools Used:
Vinnie’s Confirm Alerts
CC Trend Indicator
RSI OB/OS Scanner
MACD HPS Screener
Following this closely — could be one of the cleanest short opportunities of the month.
Forex market

GBPCAD Plans for the New Week.Firstly, wow. You do not have to be an artist to recognize great art.
Price will soon rally towards the buy side liquidity but in order to catch an entry, a few scenarios need to happen. At market open, price should quickly recover Friday losses into the highs created on Friday but quickly reverse from there to collect orders below the low that would have been created before the hunt for the highs. Thereafter, buy GBPCAD.

AUDCAD SHORTMarket structure bearish on HTFs DW
Entry at both Weekly and Daily AOi
Weekly Rejection at AOi
Weekly Previous Structure Point
Weekly Rejection at AOi
Daily Rejection at AOi
Daily Previous Structure Point
Around Psychological Level 0.89500
H4 EMA retest
H4 Candlestick rejection
Levels 4.17
Entry 100%
REMEMBER : Trading is a Game Of Probability
: Manage Your Risk
: Be Patient
: Every Moment Is Unique
: Rinse, Wash, Repeat!
: Christ is King.

GBPUSD is Bearish! Look for Sells!Welcome back to the Weekly Forex Forecast for the week of July 21-25th.
In this video, we will analyze the following FX market:
GBPUSD
Expecting the USD to continue to push higher, which would further drag the EURO down. Look to take advantage of this dynamic and wait for sell setups!
Enjoy!
May profits be upon you.
Leave any questions or comments in the comment section.
I appreciate any feedback from my viewers!
Like and/or subscribe if you want more accurate analysis.
Thank you so much!
Disclaimer:
I do not provide personal investment advice and I am not a qualified licensed investment advisor.
All information found here, including any ideas, opinions, views, predictions, forecasts, commentaries, suggestions, expressed or implied herein, are for informational, entertainment or educational purposes only and should not be construed as personal investment advice. While the information provided is believed to be accurate, it may include errors or inaccuracies.
I will not and cannot be held liable for any actions you take as a result of anything you read here.
Conduct your own due diligence, or consult a licensed financial advisor or broker before making any and all investment decisions. Any investments, trades, speculations, or decisions made on the basis of any information found on this channel, expressed or implied herein, are committed at your own risk, financial or otherwise.

Tricky USDCAD . let the market decide - we follow Hello traders , here is the full multi time frame analysis for this pair, let me know in the comment section below if you have any questions , the entry will be taken only if all rules of the strategies will be satisfied. wait for more price action to develop before taking any position. I suggest you keep this pair on your watchlist and see if the rules of your strategy are satisfied.
🧠💡 Share your unique analysis, thoughts, and ideas in the comments section below. I'm excited to hear your perspective on this pair .
💭🔍 Don't hesitate to comment if you have any questions or queries regarding this analysis.

NZD-JPY Local Short! Sell!
Hello,Traders!
NZD-JPY has hit a horizontal
Resistance level of 88.851
And we are already seeing
A bearish reaction so we will
Be expecting a local
Bearish move down
On Monday!
Sell!
Comment and subscribe to help us grow!
Check out other forecasts below too!
Disclosure: I am part of Trade Nation's Influencer program and receive a monthly fee for using their TradingView charts in my analysis.

USD_JPY STRONG UPTREND|LONG|
✅USD_JPY is in a strong
Long-term uptrend now
And the pair is accumulating
For the next leg up so we will
Be expecting a bullish continuation
On Monday!
LONG🚀
✅Like and subscribe to never miss a new idea!✅
Disclosure: I am part of Trade Nation's Influencer program and receive a monthly fee for using their TradingView charts in my analysis.

EURGBP Sell IdeaA very common bearish pattern is displayed on EURGBP H1 chart. This trade idea is based on the bearish flag structure outlined. Final target would be at 0,86390.

GBPUSD Daily Setup In the daily timeframe, given that the daily internal structure change has formed, the price tries to reach the desired order block and the price of 1.36300 to 1.36840, then falls to the price of 1.31750.
#XAUUSD #ICT #OrderBlock #FundedTrader #TradingStrategy

EURUSD Is Weaker vs USD. Look For Sells!Welcome back to the Weekly Forex Forecast for the week of July 21-25th.
In this video, we will analyze the following FX market:
EURUSD
Expecting the USD to continue to push higher, which would further drag the EURO down. Look to take advantage of this dynamic and wait for sell setups!
Enjoy!
May profits be upon you.
Leave any questions or comments in the comment section.
I appreciate any feedback from my viewers!
Like and/or subscribe if you want more accurate analysis.
Thank you so much!
Disclaimer:
I do not provide personal investment advice and I am not a qualified licensed investment advisor.
All information found here, including any ideas, opinions, views, predictions, forecasts, commentaries, suggestions, expressed or implied herein, are for informational, entertainment or educational purposes only and should not be construed as personal investment advice. While the information provided is believed to be accurate, it may include errors or inaccuracies.
I will not and cannot be held liable for any actions you take as a result of anything you read here.
Conduct your own due diligence, or consult a licensed financial advisor or broker before making any and all investment decisions. Any investments, trades, speculations, or decisions made on the basis of any information found on this channel, expressed or implied herein, are committed at your own risk, financial or otherwise.


EUR_AUD WILL GROW|LONG|
✅EUR_AUD is trading in an uptrend
With the pair set to retest
The rising support line
From where I think the growth will continue
LONG🚀
✅Like and subscribe to never miss a new idea!✅
Disclosure: I am part of Trade Nation's Influencer program and receive a monthly fee for using their TradingView charts in my analysis.

NZD/CADNZD/CAD Has Retraced Into My 2h/4h Orderblock And Made A Market Structure Shift To The Upside For A Possible Move Higher Towards The Higher Timeframe Fair Value Gap. I Will Look For Longs Form This Zone And Then Wait For A Market Structure Shift To The Downside To Look For Short Entries To My Daily OrderBlock Which Sits Between 0.79705 - 0.78667. Once There I Will Look For Long Positions.
Trade Carefully HK

CAD-JPY Will Keep Growing! Buy!
Hello,Traders!
CAD-JPY keeps trading in
An uptrend and there is a
Rising support below so
We are bullish biased
And we will be expecting
A further bullish move up
Buy!
Comment and subscribe to help us grow!
Check out other forecasts below too!
Disclosure: I am part of Trade Nation's Influencer program and receive a monthly fee for using their TradingView charts in my analysis.

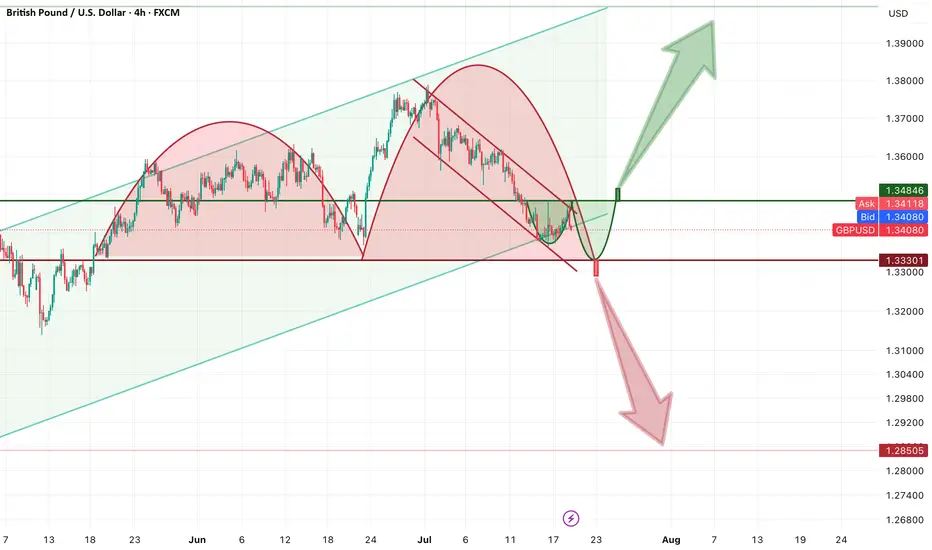
GBPUSD — We Stand at the Rubicon. Major Breakout Is Brewing. FRLThe GBPUSD chart is presenting a rare moment of confluence and clarity — the perfect environment for a high-probability reversal. The market is pressed against a crucial decision point, and the coming breakout will define the next major trend.
Let’s get into the structure:
Key Structure: Double Bottom or Continuation?
We are currently inside a local corrective downtrend, nested within a much larger bullish channel. According to Fractal Reversal Law (FRL), this correction is showing signs of exhaustion and is likely to terminate with a reversal pattern — a double bottom is forming right now.
The neckline of this potential pattern lies at 1.3485, which also marks the origin of the last impulse wave. This is the Rubicon — a horizontal barrier that separates indecision from trend reversal.
✅ Why I Lean Long (Strong Bias for Reversal)
The local downtrend is weaker than the larger trend it counteracts — it’s corrective by nature.
FRL structure (Double Bottom) is clean and supported by price behavior near dynamic support.
100MA on the Daily sits just beneath, providing key confluence as price reacts.
MACD bullish divergence on H4 is developing right as the second bottom takes shape — classic timing.
Fundamentally, the USD still lacks momentum for a sustained rally — macro pressure leans against the bearish case.
🔴 Bearish Alternative?
Yes, we must acknowledge the possibility of a broader double top forming on the Daily timeframe. But for now, it’s only potential — not confirmed — and lacks structural symmetry and conviction. This is not the scenario I prioritize.
Execution Plan — No Emotion in the Uncertainty Zone
We won’t act emotionally inside the chop zone between 1.3300 and 1.3480.
We trade confirmation only:
A clean H1 close above 1.3485 activates the long setup — reversal confirmed by neckline break.
Alternatively, a Daily close below 1.3300 may validate the bearish breakdown.
Until then, we observe. But structurally, I believe the path of least resistance is up.
🔺 Target Zones:
If confirmed, this breakout has legs toward 1.3700–1.3900, based on the measured move from the base to neckline.
Stop-loss logic aligns naturally under 1.3300 — outside the pattern and below 100MA support.
Final Words
Markets rarely give such structured signals — and when they do, it pays to be patient.
Everything points to the potential completion of a local bearish phase.
All that’s left is the trigger — and then, the phase shift begins.
$GU (GBPUSD) 4HGBPUSD is forming a potential reversal structure with liquidity resting above and below the current range.
We expect a move to grab short-term liquidity above 1.3475 followed by a sweep of lows near 1.3369.
This would complete a rounded bottom structure, setting the stage for a bullish reversal.
Once the low is swept and buyers step in, the target sits around the 1.3600 handle.

GBPCAD Bearish Flag Breakout!
HI,Traders !
#GBPCAD is trading in a local
Downtrend and formed a bearish
Flag pattern and now we are
Seeing a bearish breakout
So we are bearish biased
And we will be expecting
A further bearish move down !
Comment and subscribe to help us grow !

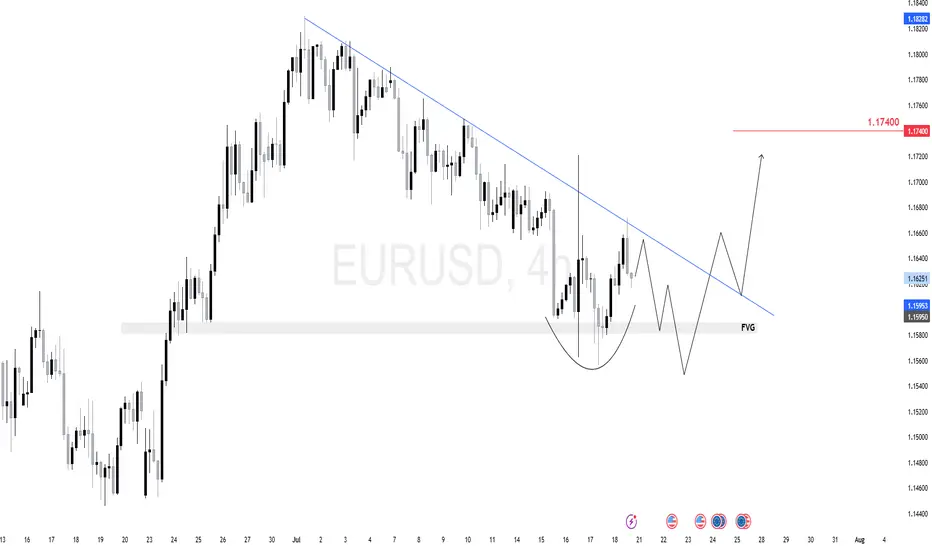
$EU (EURUSD) 4HEURUSD is forming a potential inverse head-and-shoulders just above a 4H fair value gap (FVG).
We expect one more dip toward the 1.1580–1.1595 zone to complete the right shoulder and tap demand.
From there, a breakout above the descending trendline can target 1.1740 next.
The key here is watching the reaction after the FVG test — if buyers step in strong, we ride it up.
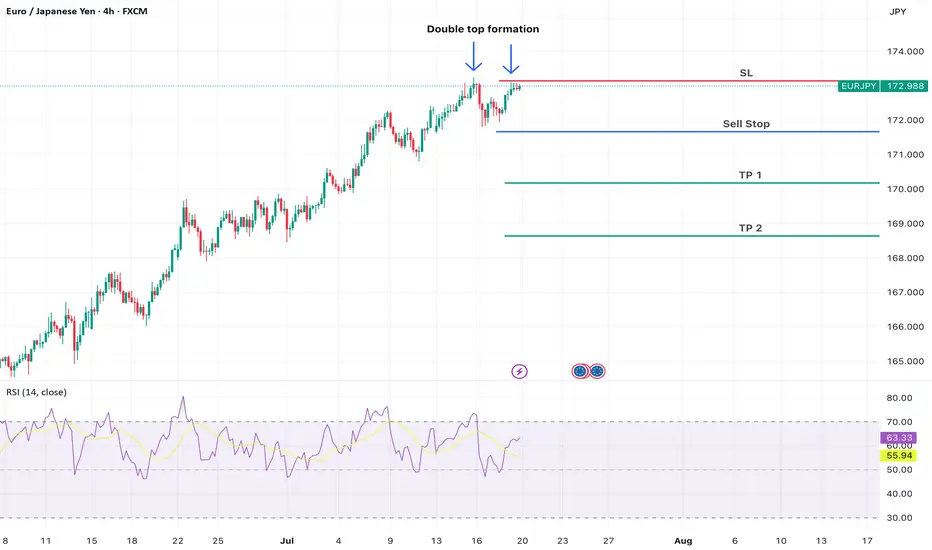
EUR/JPY – Double Top with RSI Divergence (Bearish Setup)Technical Analysis (Short Trade Idea)
EUR/JPY is forming a textbook double top pattern with notable bearish signals:
First top: 173.242
S econd top: 173.111 (lower high, indicating weakening bullish pressure)
Neckline: 171.650 – key support level, potential breakdown trigger
RSI divergence: Bearish divergence observed as RSI prints lower highs while price forms nearly equal tops, signaling momentum loss
This structure suggests a potential reversal from recent highs. A short opportunity may arise if price breaks below the neckline at 171.650 with confirmation.
Trade Setup
Sell Stop: 171.650
Stop Loss: 173.148
Take Profit 1: 170.180
Take Profit 2: 168.642
Euraud buy buy buy nowEuro is in a clear uptrend with ozzie dollar and pulled back just about enough now, we are now back in buy territory, broke through pivot point pulled back to pivot point showing nice spi,eon support zone now at 1.78598 zone buy here tp at 1.79538

Bearish GBPUSD?? maybe??I have some questions here and no clear answers yet. For the moment, there is no trading idea here.
1) Is the USD going to be strong this week? - after scanning other USD pairs, the best I can say is "maybe".
2) Looking at GBPUSD, can we say it is bearish. - The uptrend does seem to be exhausting, but until this support is convincingly broken, it is still a "maybe".
It follows that there is no trade here, just a possibility. I don't want to fall in the trap of anticipating what will happen next. That is not a trader's job. Patience is one of the core skills in trading, that we have to acquire and master. Waiting for the market to show us its hand is always advisable.
This is not a trade recommendation; it’s merely my own analysis. Trading carries a high level of risk so carefully managing your capital and risk is important. If you like my idea, please give a “boost” and follow me to get even more.

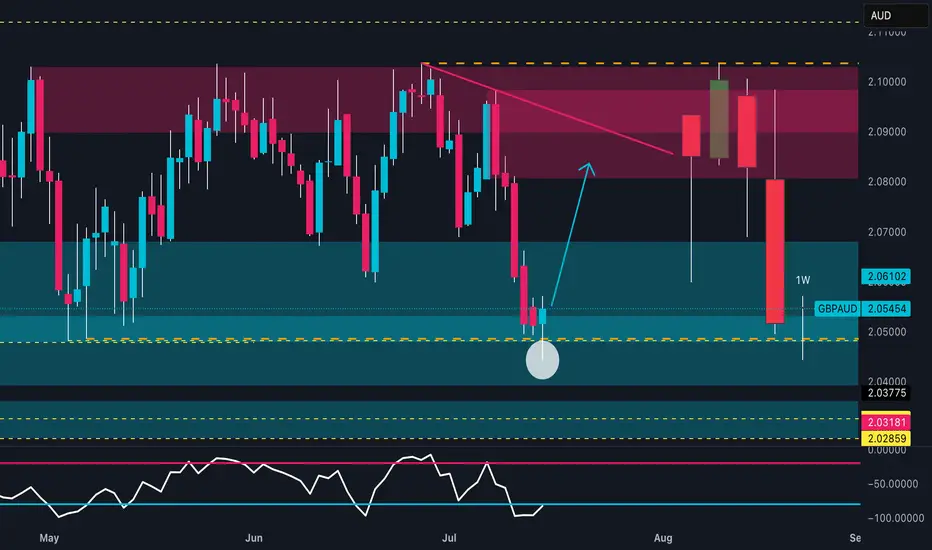
GBPAUD: Weekly Reversal | COT & Seasonality Support Bullish📊 Technical Outlook
Price strongly reacted from a key weekly demand zone between 2.0400 and 2.0500, showing clear absorption of bearish pressure. The RSI is rebounding from the 30 area, signaling early reversal potential.
The next technical target lies between 2.08900 and 2.10000, within a well-defined supply zone.
An early bullish reversal is in progress, with potential for a swing move toward the red zone.
🧠 Commitment of Traders (COT Report – 08/07/2025)
GBP: Non-commercial traders are net long, with positioning growing across the board: +869 longs / -926 shorts. Commercials reduce shorts and increase longs → Bullish bias.
AUD: Non-commercials are clearly short (-2,267 longs / +1,957 shorts). Commercials are increasing long exposure (+2,629), but still in the minority → Bearish bias.
➡️ The COT spread confirms a GBP long vs AUD short bias.
📅 Seasonality (July)
GBP: Historically strong in July, with average monthly gains across all timeframes (especially the 2Y window).
AUD: Less favorable seasonal profile in July; flat to slightly negative across all time horizons.
➡️ Seasonality supports GBP strength.
📉 Retail Sentiment
58% Long / 42% Short on GBPAUD
➡️ Retail traders are still heavily long → a shakeout of weak long hands is possible before the real rally begins.
🎯 Strategic Conclusion
GBP shows bullish convergence across technical, COT, and seasonal factors. AUD presents clear weakness.
The current price zone offers a clean entry point for longs, targeting the 2.08900–2.10000 supply zone.
EURJPY Hits Major Weekly Supply | Is the Bull Run Over?EUR/JPY – Institutional Macro Context (COT)
EUR (Euro)
Non-commercials net longs increased by +16,146 → strong buying.
Commercials added +25,799 long positions.
✅ Bias: Moderately bullish.
JPY (Japanese Yen)
Non-commercials decreased longs by -4,432.
Commercials cut -20,405 long contracts.
❌ Bias: Bearish pressure remains on JPY.
Conclusion (COT): EUR remains fundamentally strong, JPY structurally weak. Institutional flows favor long EUR/JPY, but positioning is stretched.
Seasonality (July)
EURJPY shows strong bullish seasonality in July, especially over the 2Y and 5Y averages (+1.03% and +0.66% respectively).
✅ Seasonality bias: Bullish.
Retail Sentiment
89% of traders are short on EUR/JPY.
Contrarian bias = bullish confirmation.
Technical Analysis (Weekly View)
Price is pushing into a major weekly supply zone around 172.50–173.00.
RSI still elevated but showing signs of weakening momentum.
Potential double top structure forming in confluence with liquidity grab.
First downside target sits around 169.50 (daily demand zone).
Awaiting a reaction in supply and confirmation for short.
Trading Plan (Top-Down)
Wait for price to reject the 172.50–173.00 area
Watch for bearish confirmation on Daily (engulfing or lower high)
Target: 169.50 zone
Risk: tight above 173.20 (invalidating supply zone)
