Sell gbpusdDaily time strong buy trend breaks and retested
Still weekly and monthly overbought pair
More strong bearish correction expected from this level
Wait to break its higher low then enter into sell with confirmation
Forex market

#013: Long Investment Opportunity on GBP/USD
In this article, I want to share the complete trading logic that led me to place a long order on GBP/USD, applying my proprietary SwipeUP v9.3.1 Elite FX model.
I won't discuss specific levels, but only the logical structure, because the goal is to demonstrate how hedge funds think and why waiting is sometimes more profitable than impulsive entry.
🔍 Phase 1 – Manipulation has already occurred
GBP/USD recently formed a technical double bottom, with a long shadow that chased away the stops placed by the most reactive retail investors. This is a clear signal: the first phase of manipulation is complete.
You don't enter immediately after a shadow: you wait for the market to return to seek residual liquidity, simulating a new decline.
📉 Phase 2 – The expected institutional dump
Before the real movement begins, I expect the price to be pushed lower again. This push serves only to:
trigger the stops of longs who entered too early
raise new liquidity for the banks
test the presence of passive institutional orders near volume supports
This dump will likely be the last countermove before the final reversal.
That's exactly where I placed my order.

GBPCHF → Retest of resistance to the global downtrendFX:GBPCHF is facing resistance from the local trend, which is aligned with the global bearish trend. The trend may continue...
A retest of resistance is forming within the global downtrend. As part of the correction, the price is testing the zone of interest and, after a false breakout of 1.7935, is returning to the selling zone.
The currency pair is rebounding from the resistance of the local trend, which coincides with the global trend. Consolidation of the price below 1.078 may trigger a continuation of the decline
Resistance levels: 1.07932, 1.0823
Support levels: 1.07744, 1.07255
Price consolidation in the selling zone followed by a break of the local structure could strengthen the bearish sentiment, which could trigger a further decline overall.
Best regards, R. Linda!

USDJPY ready to fire with 1:6 risk rewardWatch out USDJPY ready to fire on charts 15 min mass done pull back of Fib until .50 of previous swing I believe it should fall after touching 149.39. until then its good swing for upside.
1:6 risk reward is possible here
I'm not professional please do your own research before entering the trade.

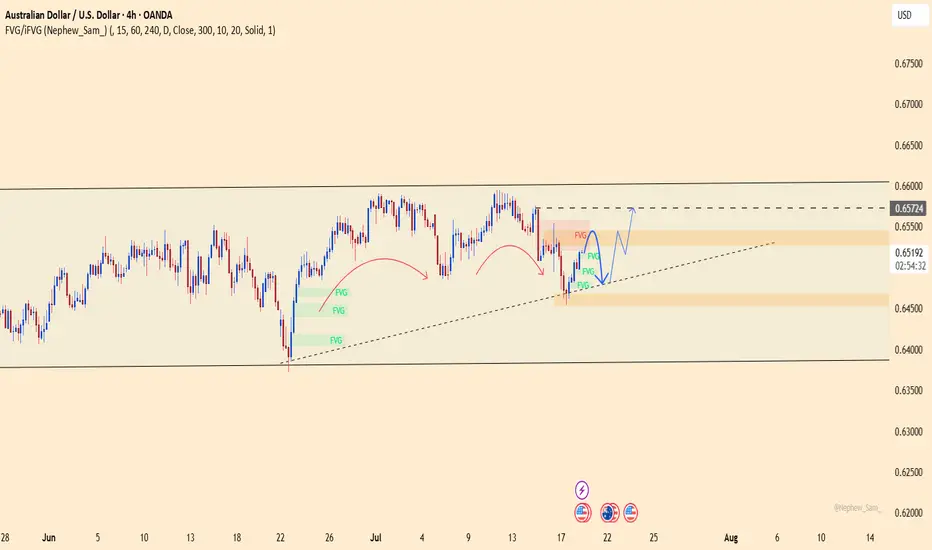
AUDUSD – bullish momentum returns, ready for a breakout?AUDUSD is showing clear strength after rebounding from a key support zone. The bullish structure remains intact with a series of higher lows, and the ascending trendline continues to hold. The recent pullback appears to be a healthy retracement before the market gathers momentum for the next leg up.
On the news front, the pair is supported by strong Australian employment data and expectations that the Federal Reserve will keep interest rates steady. This has slightly weakened the US dollar, giving AUD room to recover.
If buying pressure holds, AUDUSD could break through the overhead resistance and enter a new bullish phase. Now is the time for traders to watch price action closely and wait for a clear confirmation signal!
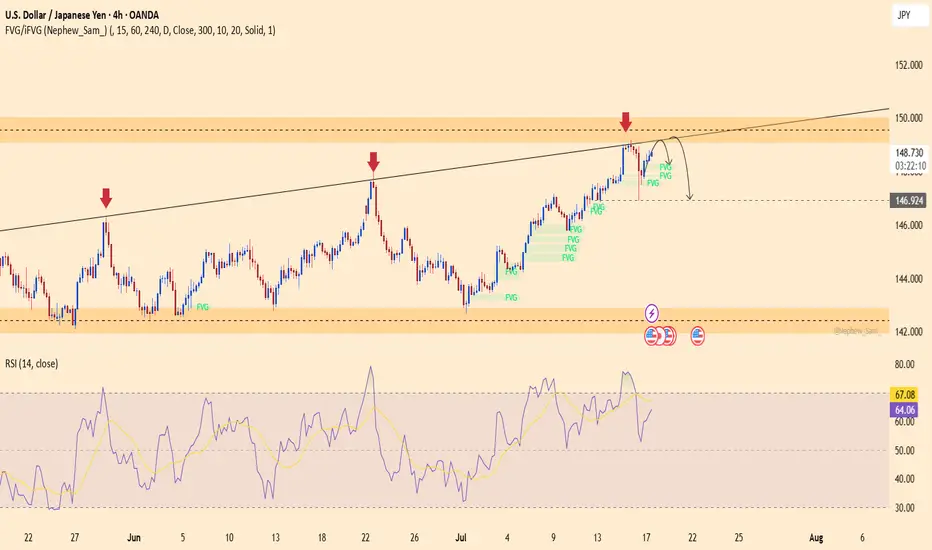
USDJPY – Rejection Pressure Builds, Is a Reversal on the HorizonUSDJPY has been rejected for the third time at the diagonal resistance line, forming a potential lower-high pattern that suggests a reversal could be underway. The RSI is dropping from the overbought zone, clearly indicating weakening bullish momentum. If the price breaks below 146.900, a bearish trend may be confirmed, with a possible move toward the lower support area.
On the news front, U.S. Treasury yields have stalled after a strong rally, and jobless claims have ticked up slightly—dampening expectations for further Fed rate hikes. This puts pressure on the USD while favoring the safe-haven JPY.
Traders should closely monitor the price action around the 149.300 level. Continued rejection could offer a prime shorting opportunity!
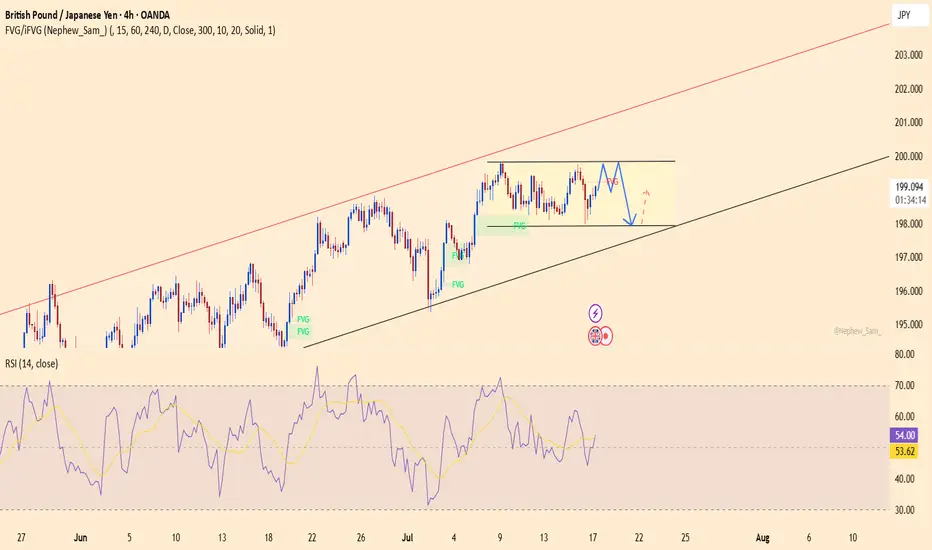
GBPJPY set for breakoutGBPJPY is currently trading in a sideways pattern within an ascending channel. The support zone around 197.900 has been respected multiple times, while price repeatedly fails to break above the 199.800 resistance – signaling that built-up pressure may soon erupt.
Recent data shows that UK inflation remains high, and the Bank of England may maintain its hawkish stance, supporting the GBP. Meanwhile, global risk-off sentiment continues to weaken the JPY.
If price breaks through the current resistance, it would confirm the continuation of the uptrend, with a target toward the upper boundary of the red channel. However, if rejection persists, buying from support remains a valid strategy.
GBPUSD Potential UpsidesHey Traders, in today's trading session we are monitoring GBPUSD for a buying opportunity around 1.33900 zone, GBPUSD is trading in an uptrend and currently is in a correction phase in which it is approaching the trend at 1.33900 support and resistance area.
Trade safe, Joe.

EUR/USD Daily Chart Analysis For Week of July 18, 2025Technical Analysis and Outlook:
In the current trading session, the Euro has continued its decline, completing our Mean Support level of 1.160. Recent analyses indicate that the Euro is likely to experience a sustained downward trend, with an anticipated retest at the Mean Support level of 1.159 and a possible further decline to reach a Currency Dip of 1.152. Nevertheless, it is crucial to consider the potential for a dead-cat bounce toward the Mean Resistance level of 1.167, which could trigger a significant reversal of the downtrend and target a Currency Dip of 1.152.

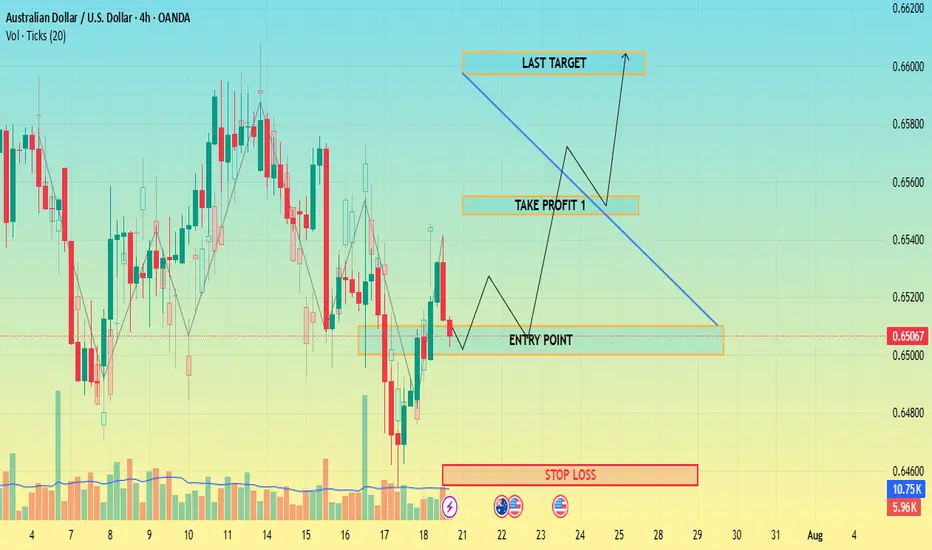
CHECK AUDUSD SIGNAL READ CAPTAIN
Entry Point: Around 0.65100 0.65000
Stop Loss: Around 0.64620
🎯 Target Levels
Take Profit 1:
0.65548
Take Profit 2:
0.66050
NZD/USD Technical Analysis | Smart Money Perspective🧠 NZD/USD Technical Analysis | Smart Money Perspective
On the current NZD/USD chart, price is trading around 0.5960, positioned between a clearly defined resistance zone (0.6130–0.6150) and a support zone (0.5890–0.5900).
We can observe the following key technical elements:
🔹 1. Liquidity Sweep
Price recently broke below the previous swing low near 0.5900, tapping into a pool of sell-side liquidity. This movement is commonly interpreted as a liquidity grab, where institutions manipulate price to trigger retail stop losses before reversing.
🔹 2. Double Bottom Formation
The chart indicates a potential double bottom forming at the support level — a classic accumulation signal. This pattern suggests buyers may be stepping in after liquidity has been taken out, anticipating a reversal.
🔹 3. Fair Value Gap (FVG)
An FVG (imbalance) is visible in the range of 0.5985 to 0.6015. This inefficiency was created by a sharp bearish move, leaving price action unbalanced. Price is now expected to retrace into this area to rebalance orders — a common smart money behavior.
🔹 4. Market Structure Outlook
If the double bottom confirms with a bullish break of structure above 0.5980, we could expect a continuation toward:
First Target: FVG zone around 0.6015
Second Target: Major resistance near 0.6150, where past distribution occurred.
✅ Conclusion
This setup combines key smart money concepts:
Liquidity grab below support
Accumulation phase at demand
FVG as target
Potential bullish market structure shift
Traders should monitor price action around the support zone for confirmation (e.g., bullish engulfing or break of short-term highs) before entering long positions. Targets remain at the FVG and resistance zones, but risk management is essential in case of a deeper sweep or macroeconomic catalyst.

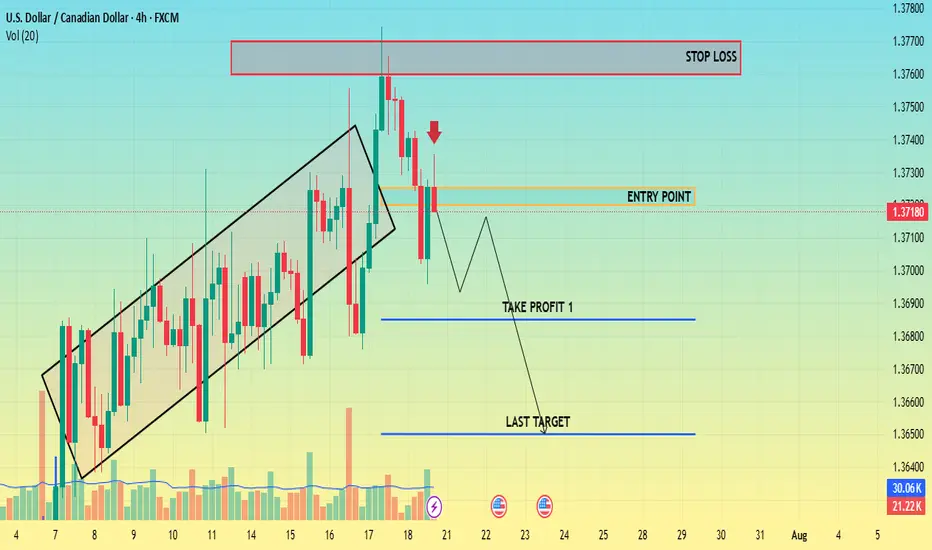
CHECK USDCAD SIGNAL READ CAPTAINShort (sell)
Entry Point: Around 1.37250 1.37200
Stop Loss: Around 1.37700
🎯 Target Levels
Take Profit 1:
1.36850
Take Profit 2:
1.36500

EURUSD SELL SETUPThis is my view on eurusd, kindly watch and share your opinion in the comment section


AUDJPY Will Go Lower From Resistance! Sell!
Please, check our technical outlook for AUDJPY.
Time Frame: 1D
Current Trend: Bearish
Sentiment: Overbought (based on 7-period RSI)
Forecast: Bearish
The market is approaching a significant resistance area 96.835.
Due to the fact that we see a positive bearish reaction from the underlined area, I strongly believe that sellers will manage to push the price all the way down to 93.887 level.
P.S
The term oversold refers to a condition where an asset has traded lower in price and has the potential for a price bounce.
Overbought refers to market scenarios where the instrument is traded considerably higher than its fair value. Overvaluation is caused by market sentiments when there is positive news.
Disclosure: I am part of Trade Nation's Influencer program and receive a monthly fee for using their TradingView charts in my analysis.
Like and subscribe and comment my ideas if you enjoy them!

GBPAUD Will Go Up From Support! Long!
Here is our detailed technical review for GBPAUD.
Time Frame: 4h
Current Trend: Bullish
Sentiment: Oversold (based on 7-period RSI)
Forecast: Bullish
The market is on a crucial zone of demand 2.060.
The oversold market condition in a combination with key structure gives us a relatively strong bullish signal with goal 2.071 level.
P.S
We determine oversold/overbought condition with RSI indicator.
When it drops below 30 - the market is considered to be oversold.
When it bounces above 70 - the market is considered to be overbought.
Disclosure: I am part of Trade Nation's Influencer program and receive a monthly fee for using their TradingView charts in my analysis.
Like and subscribe and comment my ideas if you enjoy them!

GBPJPY: Get Ready to Buy 🇬🇧🇯🇵
GBPJPY is consolidating within a narrow horizontal range
on a daily time frame.
I am waiting for its bullish breakout and a daily candle close above
199.85 to confirm the next bullish wave.
A rise will be expected to 201 level then.
❤️Please, support my work with like, thank you!❤️
I am part of Trade Nation's Influencer program and receive a monthly fee for using their TradingView charts in my analysis.

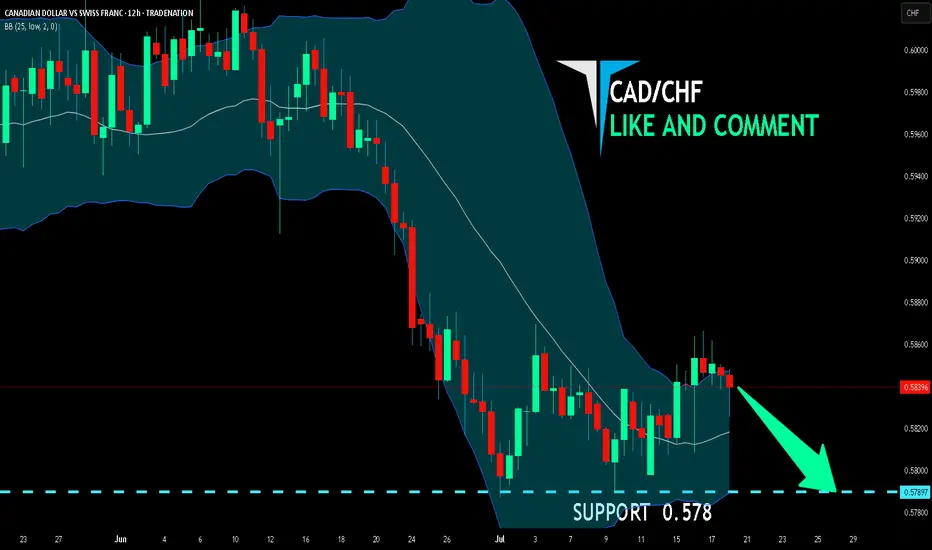
CAD/CHF SENDS CLEAR BEARISH SIGNALS|SHORT
Hello, Friends!
Previous week’s green candle means that for us the CAD/CHF pair is in the uptrend. And the current movement leg was also up but the resistance line will be hit soon and upper BB band proximity will signal an overbought condition so we will go for a counter-trend short trade with the target being at 0.578.
Disclosure: I am part of Trade Nation's Influencer program and receive a monthly fee for using their TradingView charts in my analysis.
✅LIKE AND COMMENT MY IDEAS✅
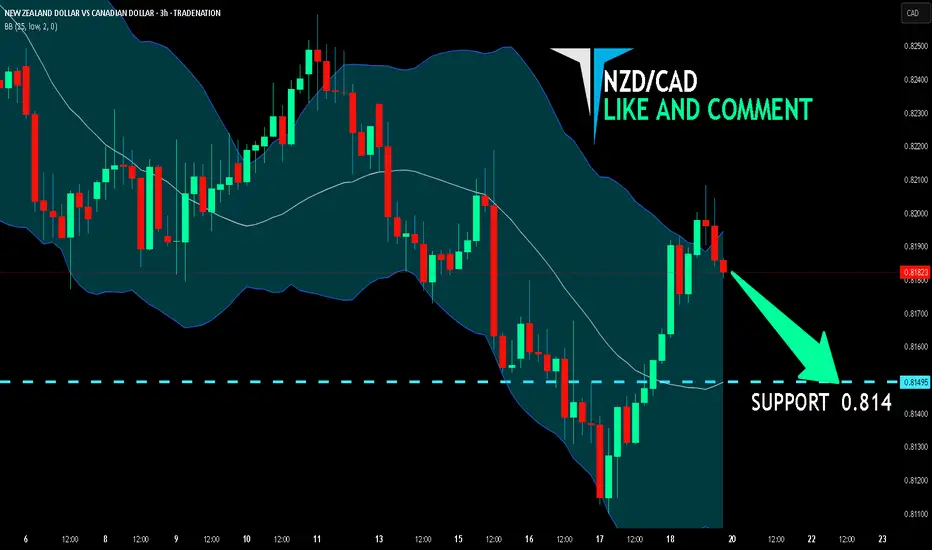
NZD/CAD BEARS ARE GAINING STRENGTH|SHORT
Hello, Friends!
NZD/CAD is trending down which is obvious from the red colour of the previous weekly candle. However, the price has locally surged into the overbought territory. Which can be told from its proximity to the BB upper band. Which presents a great trend following opportunity for a short trade from the resistance line above towards the demand level of 0.814.
Disclosure: I am part of Trade Nation's Influencer program and receive a monthly fee for using their TradingView charts in my analysis.
✅LIKE AND COMMENT MY IDEAS✅
will it rise then fall or will it fall first then rise?Two different scenarios for EURUSD, is it a rise then a fall or a fall first then a rise.
To answer this question, we need to look at the economic data that was expected last week, especially on Friday, which shows short-term inflation. This path could be in the wake of a US interest rate cut.

GBPUSD I Its ready for the deeper pullback - COT OverviewHey what up traders welcome to the COT data and Liquidity report. It's always good to go with those who move the market here is what I see in their cards. I share my COT - order flow views every weekend.
🎯 Non Commercials added significant longs and closed shorts at the same time. So for that reason I see the highs as a liquidity for their longs profits taking.
📍Please be aware that institutions report data to the SEC on Tuesdays and data are reported on Fridays - so again we as retail traders have disadvantage, but there is possibility to read between the lines. Remember in the report is what they want you to see, that's why mostly price reverse on Wednesday after the report so their cards are hidden as long as possible. However if the trend is running you can read it and use for your advantage.
💊 Tip
if the level has confluence with the high volume on COT it can be strong support / Resistance.
👍 Hit like if you find this analysis helpful, and don't hesitate to comment with your opinions, charts or any questions.
Analysis done on the Tradenation Charts
Disclosure: I am part of Trade Nation's Influencer program and receive a monthly fee for using their TradingView charts in my analysis.
"Adapt what is useful, reject what is useless, and add what is specifically your own."
— David Perk aka Dave FX Hunter ⚔️

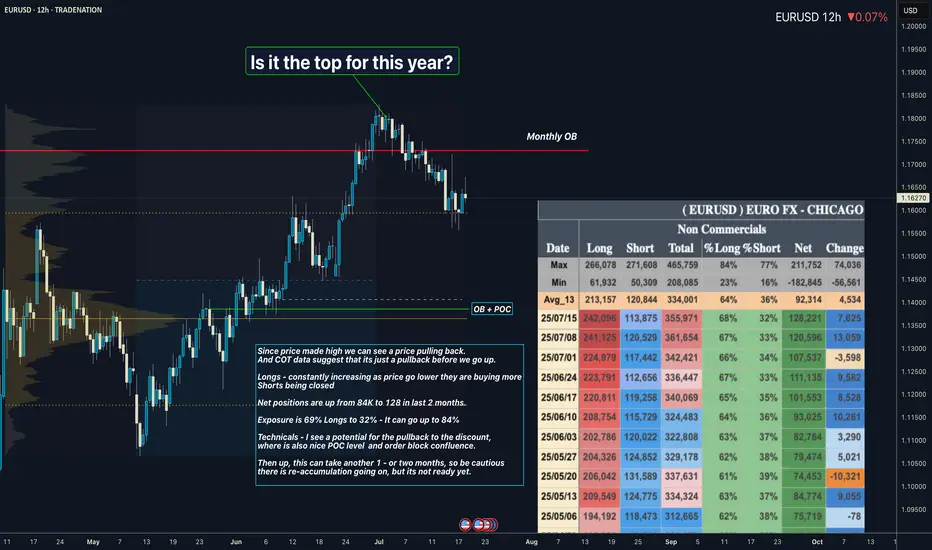
EURUSD I Its re-accumulation. COT Overview Hey what up traders welcome to the COT data and Liquidity report. It's always good to go with those who move the market here is what I see in their cards. I share my COT - order flow views every weekend.
🎯 Non Commercials added significant longs and closed shorts at the same time. So for that reason I see the highs as a liquidity for their longs profits taking.
📍Please be aware that institutions report data to the SEC on Tuesdays and data are reported on Fridays - so again we as retail traders have disadvantage, but there is possibility to read between the lines. Remember in the report is what they want you to see, that's why mostly price reverse on Wednesday after the report so their cards are hidden as long as possible. However if the trend is running you can read it and use for your advantage.
💊 Tip
if the level has confluence with the high volume on COT it can be strong support / Resistance.
👍 Hit like if you find this analysis helpful, and don't hesitate to comment with your opinions, charts or any questions.
Analysis done on the Tradenation Charts
Disclosure: I am part of Trade Nation's Influencer program and receive a monthly fee for using their TradingView charts in my analysis.
"Adapt what is useful, reject what is useless, and add what is specifically your own."
— David Perk aka Dave FX Hunter ⚔️