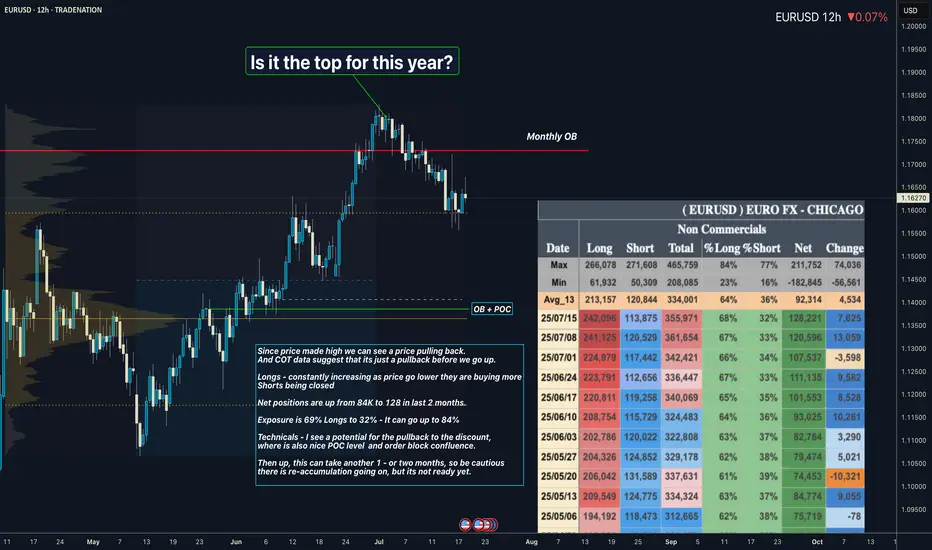
EURUSD I Its re-accumulation. COT Overview Hey what up traders welcome to the COT data and Liquidity report. It's always good to go with those who move the market here is what I see in their cards. I share my COT - order flow views every weekend.
🎯 Non Commercials added significant longs and closed shorts at the same time. So for that reason I see the highs as a liquidity for their longs profits taking.
📍Please be aware that institutions report data to the SEC on Tuesdays and data are reported on Fridays - so again we as retail traders have disadvantage, but there is possibility to read between the lines. Remember in the report is what they want you to see, that's why mostly price reverse on Wednesday after the report so their cards are hidden as long as possible. However if the trend is running you can read it and use for your advantage.
💊 Tip
if the level has confluence with the high volume on COT it can be strong support / Resistance.
👍 Hit like if you find this analysis helpful, and don't hesitate to comment with your opinions, charts or any questions.
Analysis done on the Tradenation Charts
Disclosure: I am part of Trade Nation's Influencer program and receive a monthly fee for using their TradingView charts in my analysis.
"Adapt what is useful, reject what is useless, and add what is specifically your own."
— David Perk aka Dave FX Hunter ⚔️
Forex market
GBPAUD Bullish Set-upAfter price formed Accumulation Schematic 2, it entered mark-up phase. Now, correction is approaching the 1h demand level exactly aligning with OTE level.

Buy NUWhile price rejected up and down value area, price currently in a trendline formation. Now price formed a pin rejecting the lower trendline. Combining the value area low with rejection, I anticipate a buy, with SL in swing low, targeting value area high.
Buy ENPrice at first swing rejected at Fibo 50%, at current swing price also rejected around 50% level with good pin reversal formation. Buy it
EURGBP Long Project1. Price Drivers: higher timeframe demand
2. Current Trend: up
3. Momentum: bullish
Action: Waiting for entry on the intraday timeframe (entry will be published further)
*Disclaimer: I will not accept liability for any loss or damage, including without limitation to any loss of profit, which may arise directly or indirectly from use of or reliance on such information.

Short Term Market Reversal IncomingRetail’s still buying breakouts, but the music just stopped.
This was the rally they weren’t supposed to catch.
Now it’s time to flip the script and bleed it back to origin.
Trading is a very difficult profession. Most people fail, but it's also not impossible. If you don't trade you're a loser.
It's a zero-sum game. 0 1
Zero-sum game is a mathematical representation in game theory and economic theory of a situation that involves two competing entities, where the result is an advantage for one side and an equivalent loss for the other.
It's all just digits on a screen and if they want your money they'll take your money, so you gotta respect your risk management if you don't want to lose everything or you'll have to break the matrix by seeing into the future,
Once you get to see the future. THERE IS NO TURNING BACK.
If you're reading this I hope you're having a great year. This year is all about endings and new beginnings. So stay locked in.
WAGMI
Oh yeah don't forget I gave you guys FX_IDC:EURUSD at 1.03 and FX_IDC:XAGUSD at $22
Nerds

EURCHFA 100% opportunity on EUR/CHF —
The fractal structure confirms a bullish trend, and the marked zone is based on an “N” pattern setup.


EUR/USD Bearish Reversal Confirmed – Smart Money Distribution Ne📅 Posted July 18, 2025 | 🔍 VolanX Protocol Insight
📉 Market Outlook:
The EUR/USD pair has rejected the premium supply zone (1.17–1.18) after failing to maintain structure above the red trendline. Price is now breaking down with bearish pressure building toward equilibrium at 1.09544.
📊 VolanX DSS Breakdown:
🔴 Premium Rejection confirms distribution by institutional players.
📈 Trendline Violation + SMC BOS = Shift to markdown phase.
🧠 VolanX Signal Score: Neutral → Bearish
→ Favoring short plays targeting deeper liquidity blocks.
🌐 Macro Narrative (Q3 2025):
🇺🇸 USD Strength: Driven by sticky inflation and delayed Fed cuts (Q4 expected).
🇪🇺 Eurozone Softness: Germany's PMI fell below 50; ECB’s cautious tone continues.
🏦 Rate Divergence Play: US-EU real yield gap widening → capital flowing into USD.
🎯 Probabilistic Target Path (Yellow Line):
✅ 1.1500: First liquidity gap
✅ 1.1150: Midblock retrace
🎯 1.09544: Equilibrium & High-Confidence Institutional Re-entry Zone
🛡️ VolanX Protocol Note:
This forecast is part of the WaverVanir Smart Futures Playbook. All trades are structured with AI-defined probability zones, institutional positioning layers, and macro-event syncing. The VolanX engine will reassess upon retest of the 1.1500 mid-zone.
#EURUSD #Forex #SmartMoney #MacroFX #VolanX #WaverVanir #LiquidityZones #InstitutionalTrading #TechnicalAnalysis #ForexSignals #DXY #Eurozone #FED #ECB #OptionsFlow

“USD/CAD Rocket Launch: The Bullish Surge Is Here!”The bullish path for USD/CAD on the daily timeframe is ready to begin.
And without a doubt — no, with a million percent certainty — the price will touch 1.41930.
In lower timeframes, feel free to dance with the trend 🙂
Good luck! 🙌

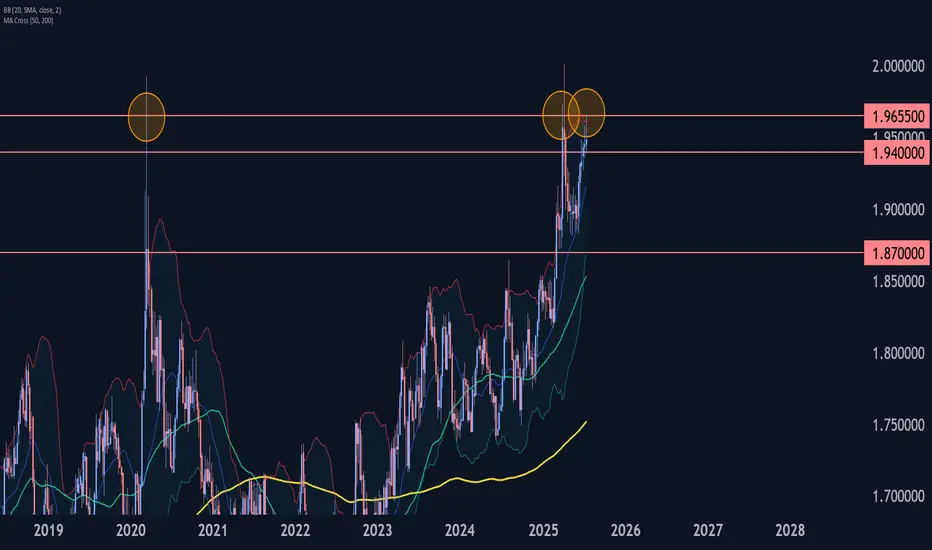
EURNZD Wave Analysis – 18 July 2025
- EURNZD reversed from the resistance area
- Likely to fall to support level 1.9400
EURNZD currency pair recently reversed down from the resistance area between the major long-term resistance level 1.9655 (which has been reversing the price from the start of 2020) and the upper weekly Bollinger Band.
The downward reversal from this resistance area stopped the previous medium-term impulse wave (5).
Given the strength of the resistance level 1.9655, EURNZD currency pair can be expected to fall to the next support level 1.9400.
GBPUSDI've been reflecting on a recent trade that got stopped out. I realize I can’t control market influences like fundamentals, but that experience pushed me to dedicate more time to studying them. I now understand trading as a balanced scale between technical and fundamental analysis.
From my experience, markets are mostly driven by technicals, while fundamentals tend to introduce short-term volatility. In my view, fundamentals don't necessarily shift the overall market bias they simply add noise.
I've also learned to approach one trade at a time. Monitoring too many currency pairs can overwhelm the mind and cloud decision-making. As crazy as it sounds, trading is simple ,when you focus on structure. The key is to invest your time in trending patterns, which are best identified through higher timeframes like the Daily (D1) or Weekly (W1) charts. These timeframes offer clearer signals and require patience. You don't need to be actively trading all the time sometimes, waiting is part of the strategy,I’ll be sharing accurate trade ideas moving forward. While some setups may require a lot of waiting, I’ll continue to provide updates on each idea as it develops

The range that will be touched in CAD/JPY It endedI provided you with this analysis that I had high confidence in.
I hope you have used this approximately 6% profit.

CAD_JPY BULLISH BIAS|LONG|
✅CAD_JPY is trading along
The rising support
And as the pair will soon retest it
I am expecting the price to go up
To retest the supply levels
Above at 108.708
LONG🚀
✅Like and subscribe to never miss a new idea!✅
Disclosure: I am part of Trade Nation's Influencer program and receive a monthly fee for using their TradingView charts in my analysis.

EUR-AUD Strong Uptrend! Buy!
Hello, Traders!
EUR-AUD is trading along
The rising support line in a
Strong uptrend so we we are
Bullish biased and as the pair
Is going down to retest the
Support we will be expecting
A rebound and a move up
Buy!
Comment and subscribe to help us grow!
Check out other forecasts below too!
Disclosure: I am part of Trade Nation's Influencer program and receive a monthly fee for using their TradingView charts in my analysis.

gbp/jpymultiple rejections from the key supply/resistance zone i dont see a reason why market wouldnt target the support/demand zone.

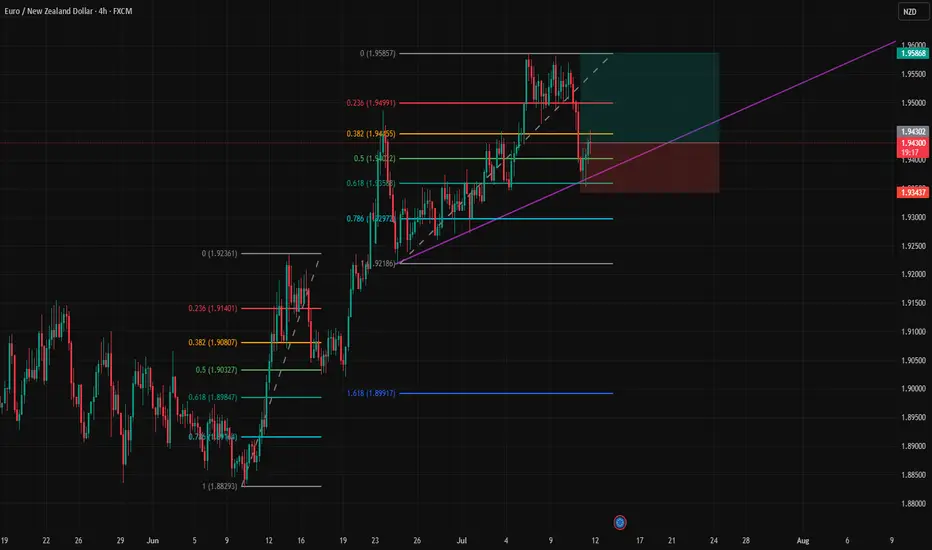
EUR_NZD LONG FROM RISING SUPPORT|
✅EUR_NZD is trading in an uptrend
Along the rising support line
Which makes me bullish biased
And the pair is about to retest the rising support
Thus, a rebound and a move up is expected
With the target of retesting the level above at 1.9544
LONG🚀
✅Like and subscribe to never miss a new idea!✅
Disclosure: I am part of Trade Nation's Influencer program and receive a monthly fee for using their TradingView charts in my analysis.

AUDUSD Potential UpsidesHey Traders, in today's trading session we are monitoring AUDUSD for a buying opportunity around 0.64500 zone, AUDUSD is trading in an uptrend and currently is in a correction phase in which it is approaching the trend at 0.64500 support and resistance area.
Trade safe, Joe.

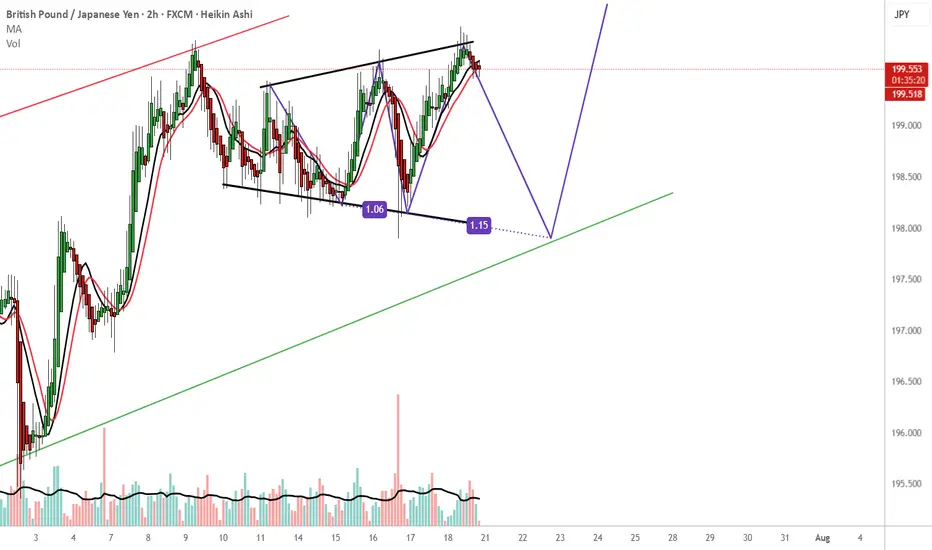
GBPJPY - How i see the market. WHAT DO YOU THINK?A channel within a channel .
Short-term bearish pressure to complete the 3-drives pattern, which ultimately suggests a long bullish setup. I'd only consider this setup if the trend continues to 198.000.
side note
198.000 I'll be looking for buying opportunities to the upside probably until we hit the red channel trendline. That should guarantee approx. 350pips.
You could take advantage of the current bearish move and rejoin when the bulls hit the ground running. Remember use your own trading plan and enjoy the ride . It can go either way but hopefully it respects PA and goes with this flow.
USD-JPY Will Keep Growing! Buy!
Hello,Traders!
USD-JPY is trading in an
Uptrend along the rising
Support line and the pair
Already made a bullish
Rebound and is consolidating
In a local range so as we
Are bullish biased we will
Be expecting a further
Bullish move up
Buy!
Comment and subscribe to help us grow!
Check out other forecasts below too!
Disclosure: I am part of Trade Nation's Influencer program and receive a monthly fee for using their TradingView charts in my analysis.

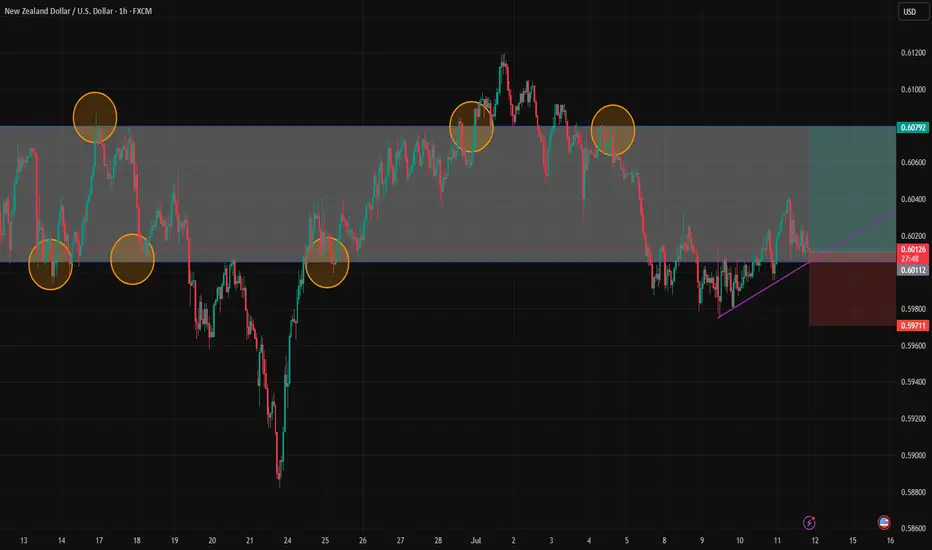
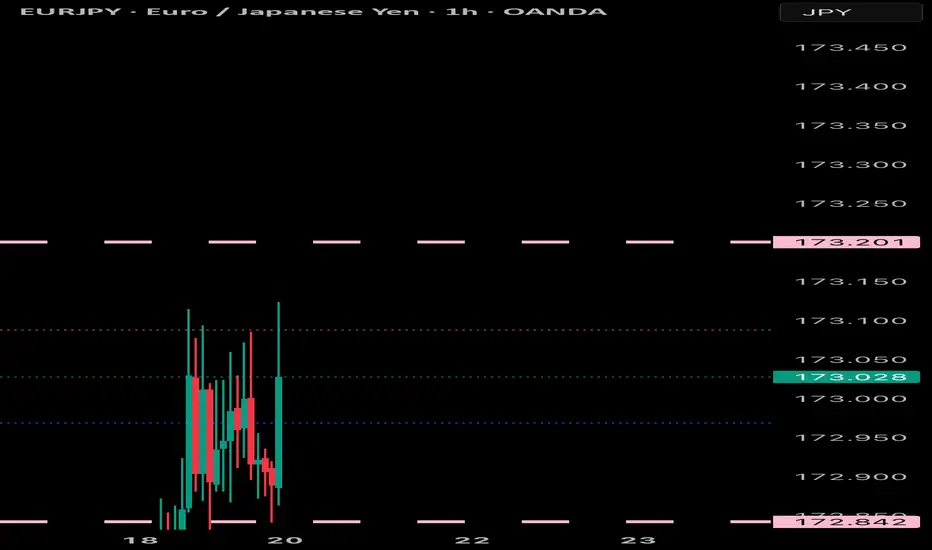
Bearish Breakdown on EUR/USD: Support Flip and Short SetupThis EUR/USD 1-hour chart shows a bearish setup after price breaks below a rising support trendline. A potential short trade is indicated, with a stop loss at 1.16453 and a target at 1.15779. The highlighted green zone marks a key support-turned-resistance area.
