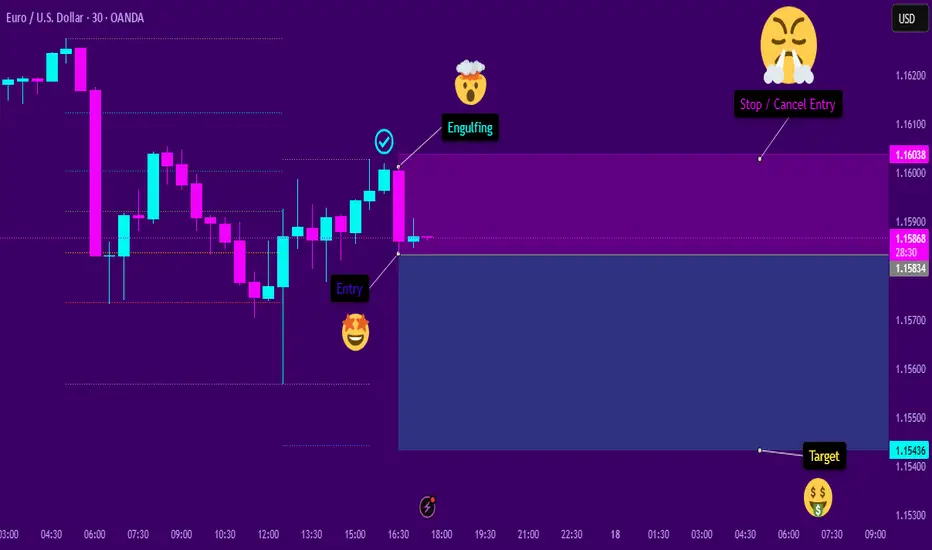
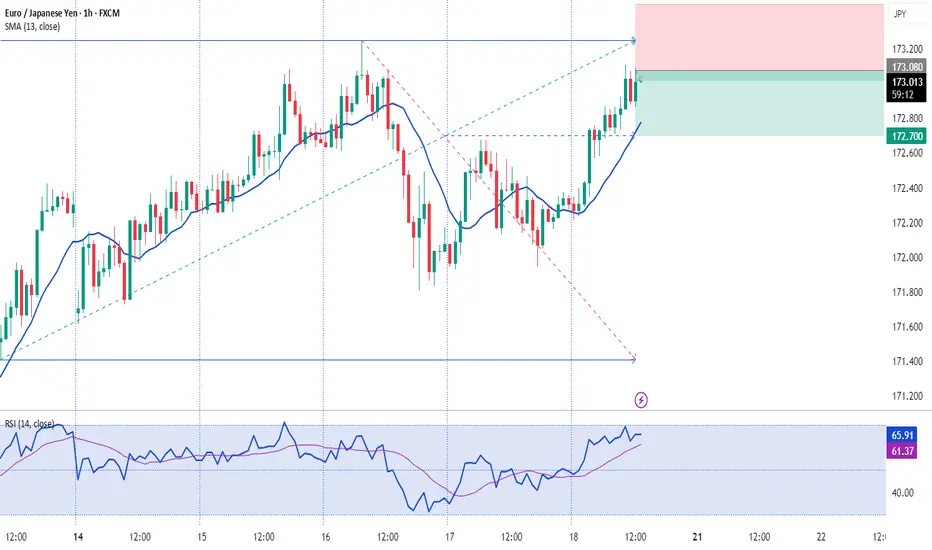
Engulfing SellThe asset shows signs of continuation in a downtrend. After a significant retracement at a favorable Fibonacci level, a bearish engulfing pattern appeared. This engulfing pattern resulted in a behavioral shift, causing the temporary pullback to resume its decline. I believe this will be the case, provided that the subsequent candlesticks confirm the entry signal.
ATM_GS : We are nearing...
Forex market
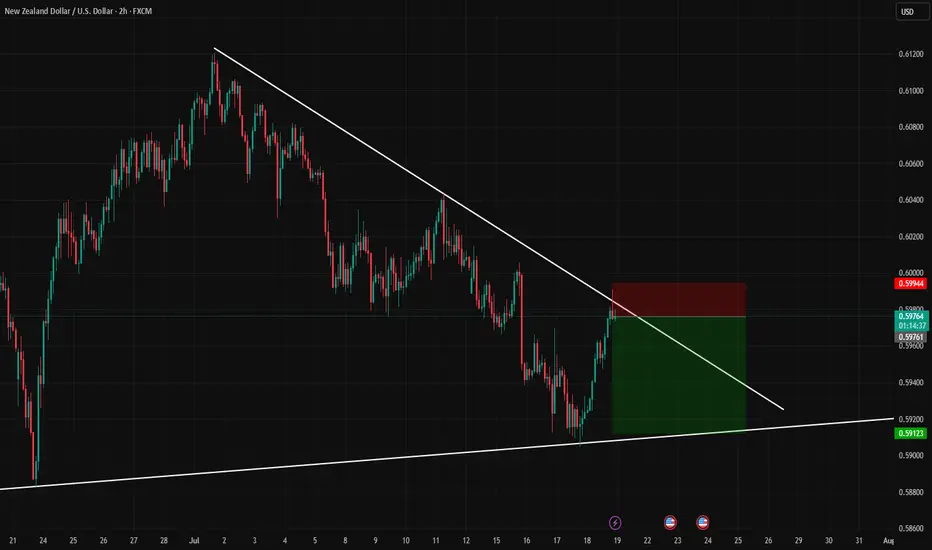
NZD-USD Will Go Down! Sell!
Hello,Traders!
NZD-USD already made a retest
Of the horizontal resistance
Of 0.5992 from where we
Are seeing a bearish reaction
And we will be expecting a
Further bearish move down
Sell!
Comment and subscribe to help us grow!
Check out other forecasts below too!
Disclosure: I am part of Trade Nation's Influencer program and receive a monthly fee for using their TradingView charts in my analysis.

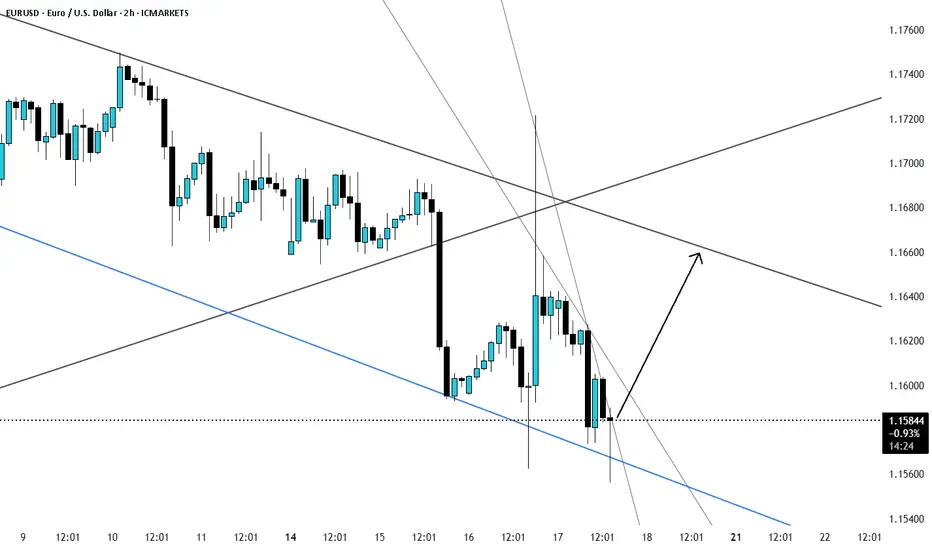
End of correction and trend continuation towards 1.195?EURUSD is in an important support area, retesting the bottom line of the wedge. I'm loking foward for any sign of reversal from here.

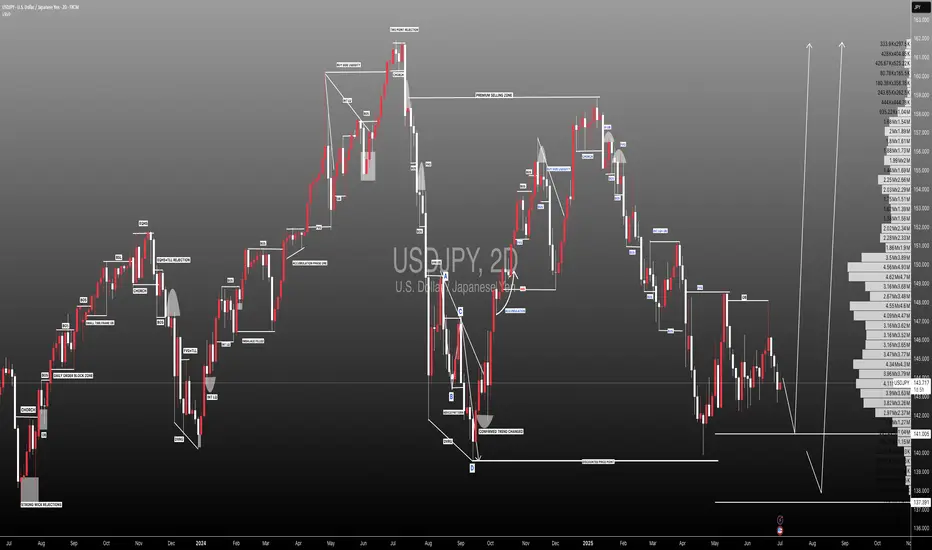
#USDJPY: Price is currently accumulating ! Wait For DistributionAt present, the USDJPY currency pair appears to be in an accumulation phase, as evidenced by the absence of significant price movement throughout the current week. Several factors contribute to this trend.
Firstly, several significant economic events are scheduled for this week, particularly tomorrow and Friday. These developments hold substantial implications for the future trajectory of the USDJPY pair. Consequently, there exists a possibility that the price may experience a decline prior to initiating a bullish trend.
Secondly, there are two primary areas where the price could reverse its course. The extent to which the USD reacts to the economic data will serve as an indicator of the potential reversal zones.
It is imperative that you conduct your own analysis before making any financial decisions. This chart should be utilised solely for educational purposes and does not guarantee any specific outcome.
Regarding the stop loss, as this is a swing trade, it is advisable to employ a larger stop loss if the price reaches entry zones. The take profit level can be determined based on your entry type and analysis.
We wish you the best of luck in your trading endeavours and emphasise the importance of trading safely.
Kindly share this analysis with others through likes, comments, and social media platforms. If you have any questions or require further assistance, please do not hesitate to comment below. We are here to provide support.
Team Setupsfx_
❤️🚀
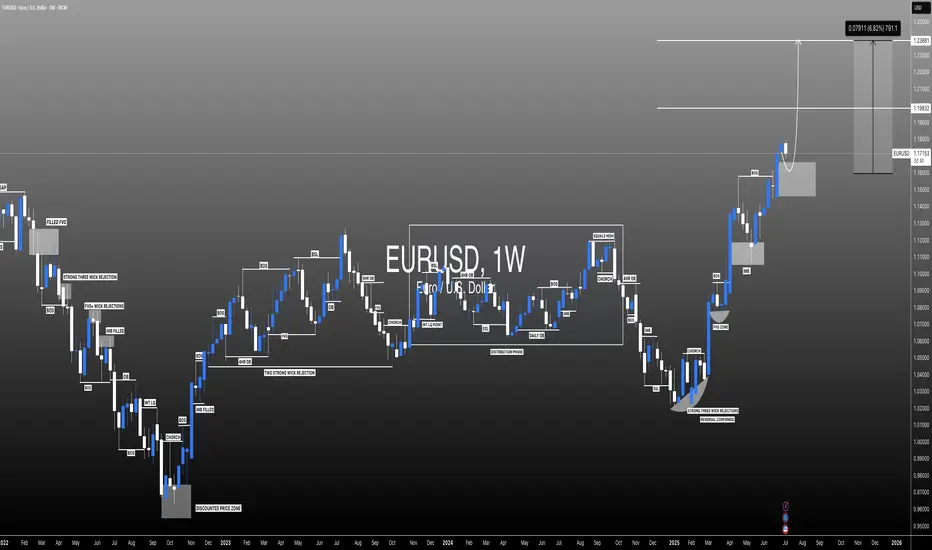
#EURUSD: Last Bullish Price Extension! Get Ready! EURUSD is approaching our buying zone, a key level, which suggests a smooth bullish reversal. As this is a swing trade, we advise keeping stop losses larger. There are two targets to keep an eye on. Remember, this is not a guaranteed move, and this is just our overview. Good luck and trade safely.
Team Setupsfx_
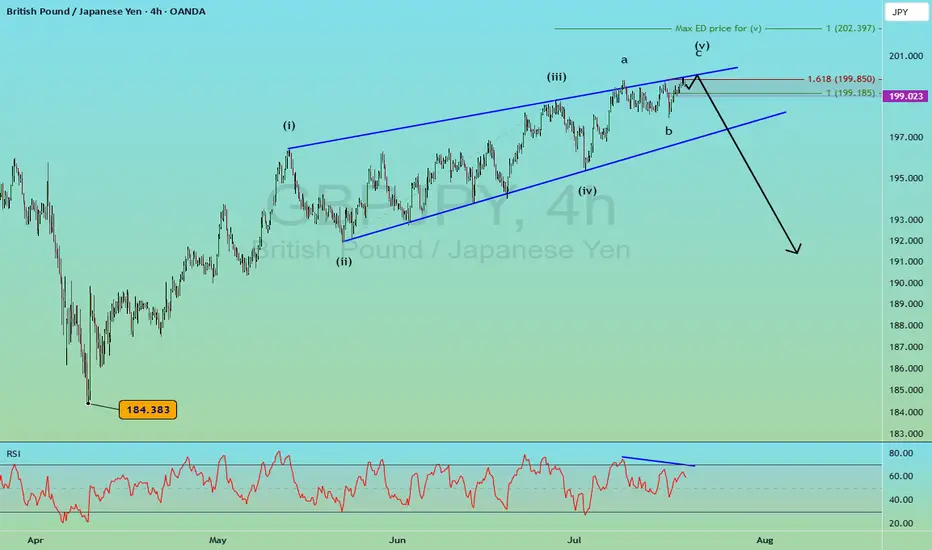
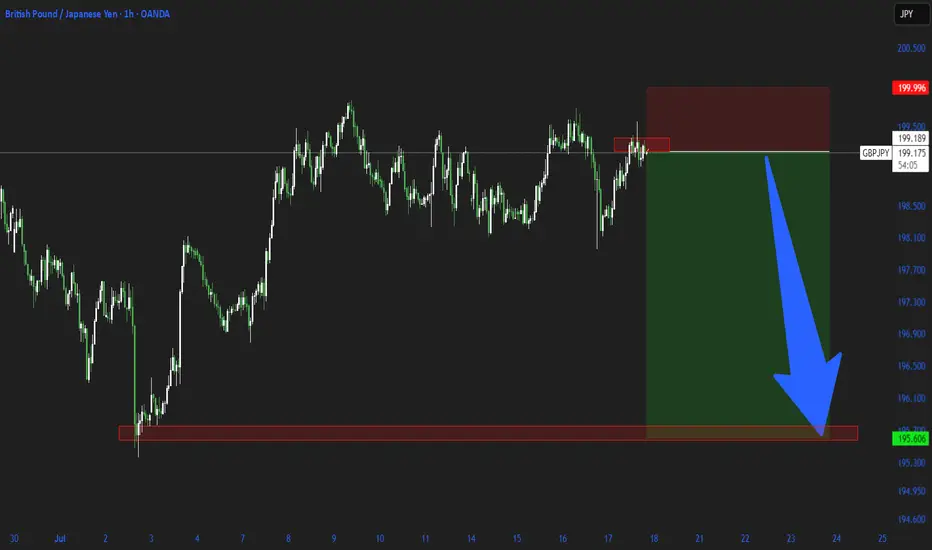
GBPJPY Large Reversal Pattern [Elliott Wave]Executive Summary:
GBPJPY shaping a diagonal pattern.
Large bearish reversal could push down to 184.
Above 202.40 voids the pattern as labeled.
I typically don't conduct Elliott wave analysis on cross pairs simply because they are the children of the two main currencies involved. GBPJPY is the child of GBPUSD and USDJPY.
With that said, I still scroll through charts looking for compelling patterns and GBPJPY caught my attention.
First, it's knocking on the door of 200...a nice round number.
Secondly, the rally from 184 in April to now appears to be a very mature Elliott wave ending diagonal pattern .
Diagonals shape in 5 waves. Remember, wave 3 cannot be the shortest of waves 1,3,5. Since wave 3 is shorter than wave 1, that means wave 5 cannot be longer than wave 3.
So we simply measure out wave 3 and apply it to the end of wave 4, and, voila, we have a maximum target for wave 5 at 202.40 .
That maximum target doesn't mean GBPJPY has to go that high, but this market is ripe for a large bearish turn. If GBPJPY does push above 202.40, then my wave labeling is incorrect.
Ending diagonals tend to be fully retraced which implies a decline back to 184 ... 1500 pips from today's price.
GBJPY may dance around in the 199 handle for a day or two.
A break below 199 could be an early warning signal of the bearish reversal. A break below the blue support trend line helps confirm the pattern.
If this bearish reversal takes hold, then GBPUSD or USDJPY likely experiences a large decline too.
#GBPUSD:We dropped a bit further down than we expected! GBPUSD dropped further down our area, currently dropping as well. This happened as DXY started gaining strength and becoming bullish. We believe this is temporary and the price will soon start dropping. Due to this, we have bought a position at an area where we think the price is likely to reverse. Please do your own analysis and use this as a secondary bias only.
Team Setupsfx_
AUD/CAD LIVE TRADE STARTEDAUD/CAD – Short Position Taken
This one was on our watchlist earlier, and it just printed a clean engulfing candle trigger. Here’s what I look for before entering a VMS pullback trade:
A clear new high/low before the pullback
A clean pullback (no choppy mini-pullbacks inside)
Pullback into support/resistance zone
Price action at or near the 50 EMA
Engulfing candle in trend direction
Strong volume (trigger candle should stand out)
Momentum “hooking” in trend direction and below/above 0
We took a short position based on this alignment.
What do you think — continuation or reversal? Up or down from here?


EURUSD Liquidity Grab at supportEURUSD respacing this trendline support and price pulled back several time and price may move up with this.
USD/JPY FORCAST🟦 Time Structure Analysis – USD/JPY | The 3-6-9 Temporal Cycle
📌 Price can lie. But time never does.
While many traders rely on price action or Elliott Wave counts, I take a different route — I trade time. Why?
Because time sets the rhythm, and the rhythm defines everything.
🔄 The 3-6-9 Time Cycle
Every complete market movement follows a hidden structure based on natural timing laws
In the current month, July 2 was the entry gate. That’s where I anchor the beginning of the new cycle.
⏳ Why Time Wins Over Price
Indicators lag
Price patterns repaint
But time never repaints.
Once the temporal cycle is locked in, it dictates future market rhythm.
You can identify where the market must move next — not by guessing the price level, but by counting time bars from a known pivot.
---
⚡ Strategy in Practice
In my system, I use:
✅ Cycle Lines starting from key reversal points
✅ Fixed monthly gates as temporal anchors
✅ Bar counting based on 3-6-9 geometry
✅ Fractal validation from higher timeframes
This gives me a predictive edge based on time pressure, not price patterns.
🎯 “The market doesn’t move because of buyers and sellers...
It moves because of time.”
Time is the structure. Price is just the effect.

GBP/JPYNear the 200 psychological and very important level for institution TP Level i expect a very deep retracement here

EURCADA sell setup is forming on EUR/CAD based on a fractal “N” pattern.
Wait for a pullback after the 50% level is broken.

Sell NZDUSD based on N patternNZD/USD has entered a bearish phase.
A sell opportunity will come after a break and retest of the 50% level.

GBPJPYGBP/JPY is undergoing a trend reversal.
What matters is that, based on price action and fractal concepts, the bullish trend has ended.
Practice proper risk management and protect your profits.
USDJPY🟢 USDJPY Trade Setup | BOS + Retest Strategy 🔥
Clear Break of Structure (BOS) followed by a clean retest into my Area of Interest (AOI).
High volume confirmation on rejection — I’m in this short trade with a 1:2.42 RR.
📉 Entry: 148.87
🛑 SL: 149.28
✅ TP: 148.10
This setup aligns with my mechanical strategy:
🔹 BOS
🔹 Retest
🔹 Liquidity sweep
🔹 Volume confirmation

CHF/JPY MISSED MOVEWe started watching this market on Wednesday for a pullback and trigger, it happened but it was late at night....yawn....i was sleeping. No chance to get in this market even with a limit order...sometimes the market just takes off like that, this is why i use the volume and momentum indicators...if both of them line up along with a price structure pattern, it can produce a strong move

Short NUAlthough now towards at the end of the week, I am gonna risk this entry as the setup looks okay, and currently the US is running strong in other pairs.
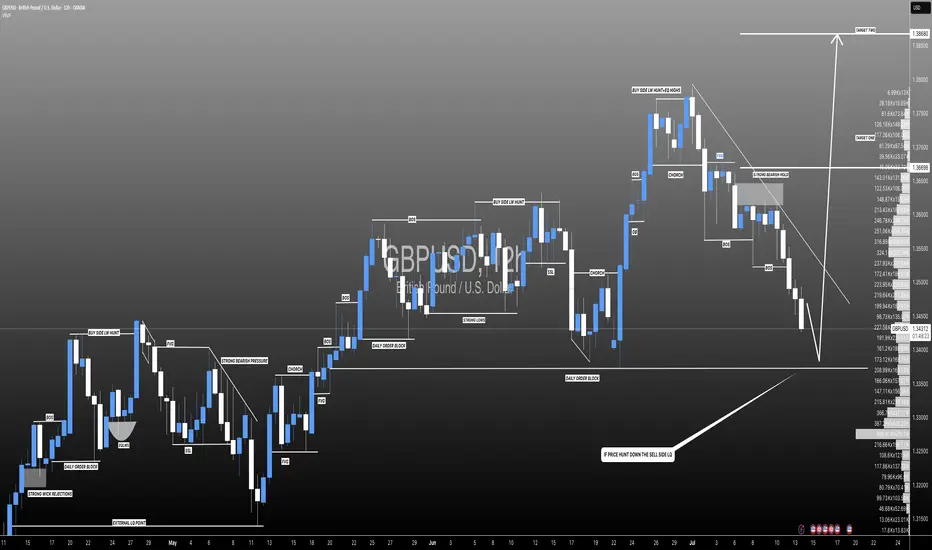
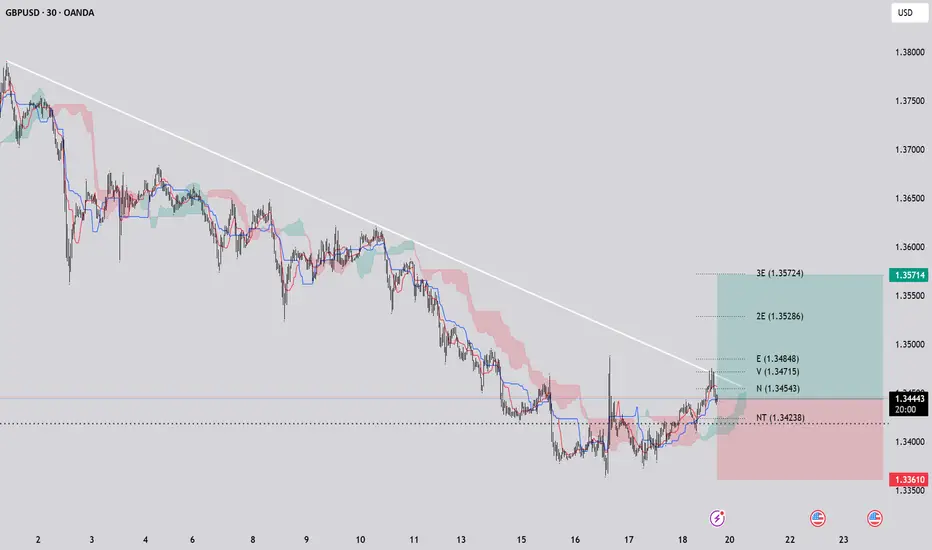
GBPUSD-M30-LONGIf the price breaks above the trendline, it could signal a reversal or a strong bullish momentum. In this scenario, the price may aim to test the nearest identified targets, which are marked as horizontal levels on the chart. These targets include zones around the upper boundaries of the shaded areas, potentially reaching the levels indicated by the upper trendline touchpoints or the previous highs within the observed range. The break's strength and accompanying volume would be key factors in determining whether these targets are realistically achievable.
If you like, please hint.
USDCAD bearish view
OANDA:USDCAD again on this pair, first analysis accurate, in new look having bearish view, price in PA moving, still we having nice structure, price is now come back in channel, looks like breaking first channel, which will take for confirmation and sign for bearish expectations.
SUP zone: 1.37400
RES zone: 1.36400, 1.36100

USDJPY Symmetrical Triangle – Be Ready for Breakout or BreakdownUSDJPY is currently squeezed inside a well-formed symmetrical triangle, indicating a breakout is imminent. This consolidation pattern is nearing its apex, and price action is getting tighter. A sharp move in either direction could unfold soon. Here's how to prepare:
🟢 Bullish Breakout Setup:
Entry Trigger: 1H candle close above 148.70
Stop Loss: Below last higher low or triangle support (~148.15)
Targets:
TG1: 149.20
TG2: 149.60
Final TG: 149.95–150.00
Bias: Favors trend continuation (previous uptrend)
🔍 Confirmation: Strong breakout candle with momentum and/or volume.
🔴 Bearish Breakdown Setup:
Entry Trigger: 1H candle close below 148.15
Stop Loss: Above triangle resistance (~148.70)
Targets:
TG1: 147.60
TG2: 147.20
Final TG: 146.80
Bias: Reversal or failed trend continuation
🔍 Confirmation: Clean breakdown with bearish candle close + possible re-test rejection.
⚠️ Avoid premature entries inside the triangle. Wait for a confirmed breakout or breakdown with candle close and rejection follow-up.
🎯 Tip: Triangle breakouts often result in fast directional moves. Plan your lot size based on volatility and stick to your risk parameters. This is a high-probability setup — trade with discipline.
=================================================================
Disclosure: I am part of Trade Nation's Influencer program and receive a monthly fee for using their TradingView charts in my analysis.
=================================================================

EURusd short position 18/07/2025English : According to our analysis, we anticipate a bearish scenario.
Morocan Darija : kanchofo d'apres l'analyse dyalna antsanaw hboot
ATENTION : I only share my ideas, not signals
