GBPJPY: Short Trading Opportunity
GBPJPY
- Classic bearish formation
- Our team expects pullback
SUGGESTED TRADE:
Swing Trade
Short GBPJPY
Entry - 199.63
Sl - 200.26
Tp - 198.44
Our Risk - 1%
Start protection of your profits from lower levels
Disclosure: I am part of Trade Nation's Influencer program and receive a monthly fee for using their TradingView charts in my analysis.
❤️ Please, support our work with like & comment! ❤️
Forex market


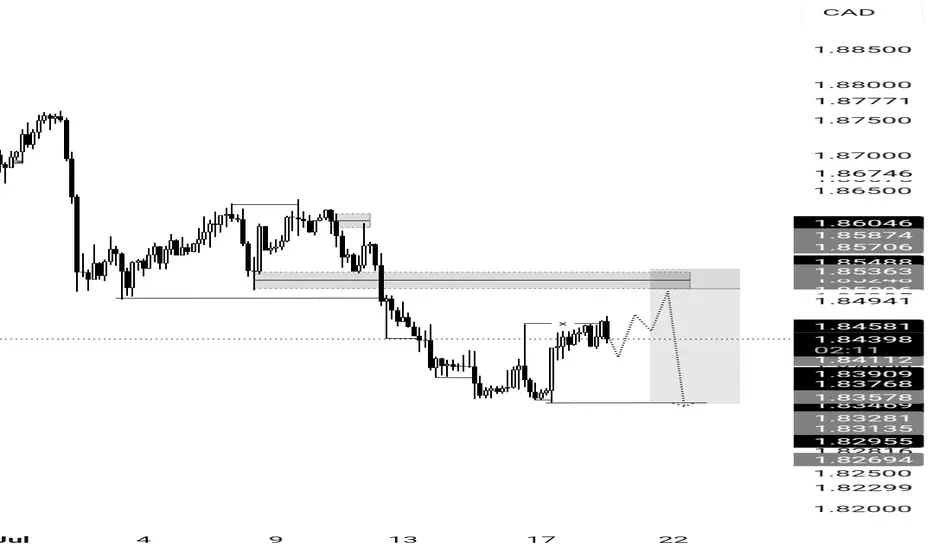
GBPCAD SELL IDEAFundamental:to cut rates thrice this year, in August, November and December. Money markets are pricing in a total of 48.6 basis points of BoE rate cuts by the year-end, with a 77.3% probability of a 25 basis point move in August.
Technical:A classical Breakerblock entry type to continue move lower
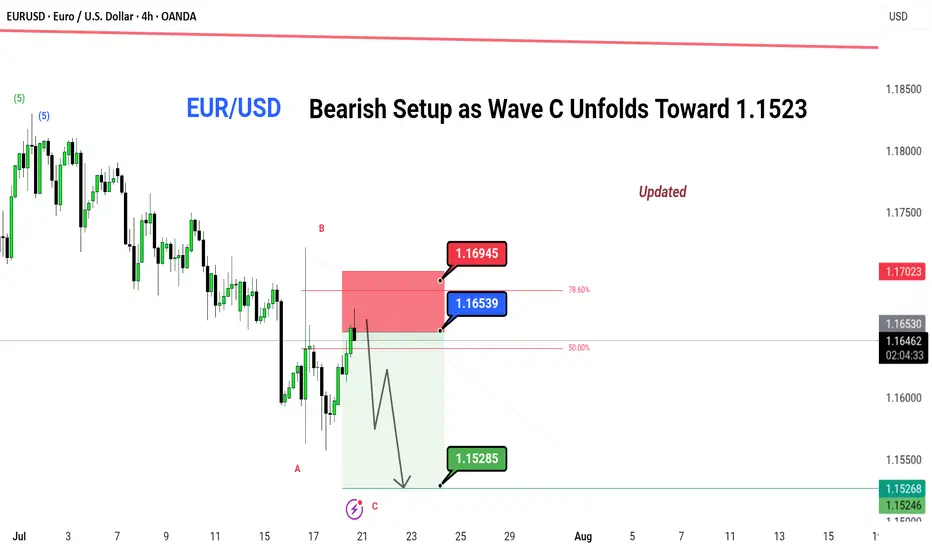
EUR/USD – Bearish Setup as Wave C Unfolds Toward 1.1523📉 EUR/USD – Bearish Setup as Wave C Unfolds Toward 1.1523
Price has retraced into the key 78.6% fib zone after completing Wave B. With clear rejection from the supply area and lower highs forming, Wave C is now in play. Expecting bearish continuation with potential downside targets around 1.1523.
🔻 SHORT BIAS (Wave C in Play)
📍 Entry Zone: 1.16530–1.16945
🎯 Target: 1.15285
⛔ Invalidation: Above 1.17023
📊 Timeframe: 4H
📈 Pattern: ABC Zig-Zag Correction
📌 Updated Analysis by: @greenfire_forex
🧠 Note: Wait for confirmation before entering. Risk management is key.
#EURUSD #ElliottWave #BearishSetup #ABCPattern #WaveC #PriceAction #ForexAnalysis #TradingView
---
Let me know if any correction , would like to suggest
Eurousd techinical analysis.Eurousd techinical analysis next move posibale at h1 time frame.not finchinal advice.

I think this area is a perfect to get buy.by daily bios it's a possibility to get higher...I'm looking for .75 of fibonacci to enter the market.

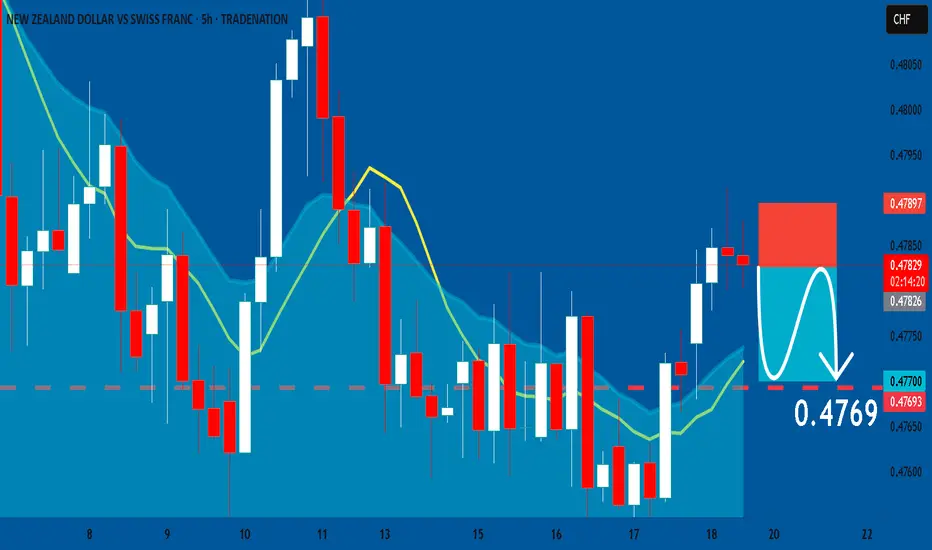
NZDCHF: Will Keep Falling! Here is Why:
The recent price action on the NZDCHF pair was keeping me on the fence, however, my bias is slowly but surely changing into the bearish one and I think we will see the price go down.
Disclosure: I am part of Trade Nation's Influencer program and receive a monthly fee for using their TradingView charts in my analysis.
❤️ Please, support our work with like & comment! ❤️
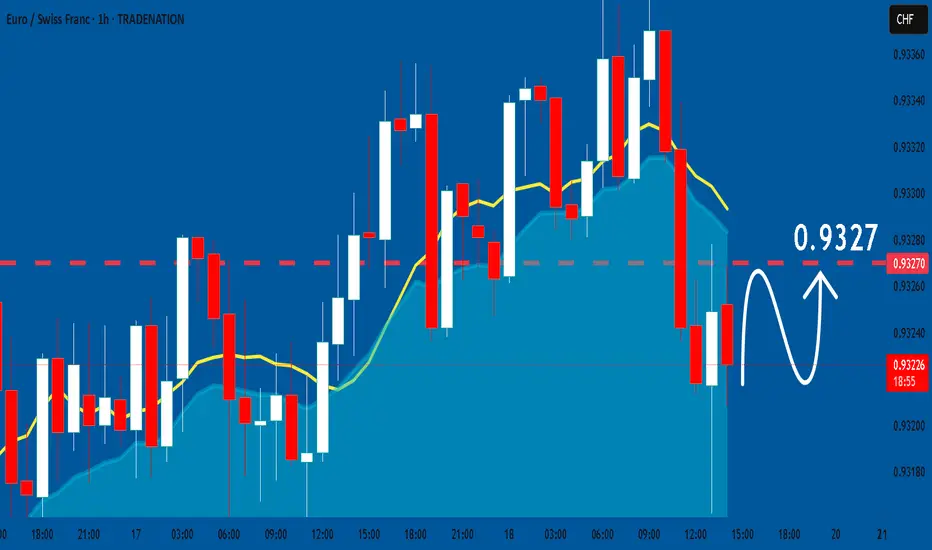
EURCHF: Bullish Continuation is Highly Probable! Here is Why:
Remember that we can not, and should not impose our will on the market but rather listen to its whims and make profit by following it. And thus shall be done today on the EURCHF pair which is likely to be pushed up by the bulls so we will buy!
Disclosure: I am part of Trade Nation's Influencer program and receive a monthly fee for using their TradingView charts in my analysis.
❤️ Please, support our work with like & comment! ❤️
EUR/USD LIVE TRADE UPDATEWe have been short in this market since Monday and although we did get a nice move down it did not hit our profit target and has been heading back up, resistance at the current price action should work in our favor and move this market back down.

AUD/JPY LIVE TRADE UPDATEWe took this trade yesterday based on the VMS strategy and it moved nicely in our direction for awhile, now it is reclaiming some of the previous gains...we will see if the market can push this one just a bit higher

EUR/CHF LOSSBoy, sometimes you think the market is targeting you.....I get it. this is not the first time we have been taken out of a trade that just "barely" touched our stop. Keep a solid money management plan in place, no revenge trading....this one didn't work out but in my opinion it was a solid trade. Onto the next one.

GBPJPY short at current market priceH4 candle closed in doji pattern, hint for buyer started losing the strength.
i'm short at current market price.
target to take profit at 198.60
calculate your own risk & reward
Good luck

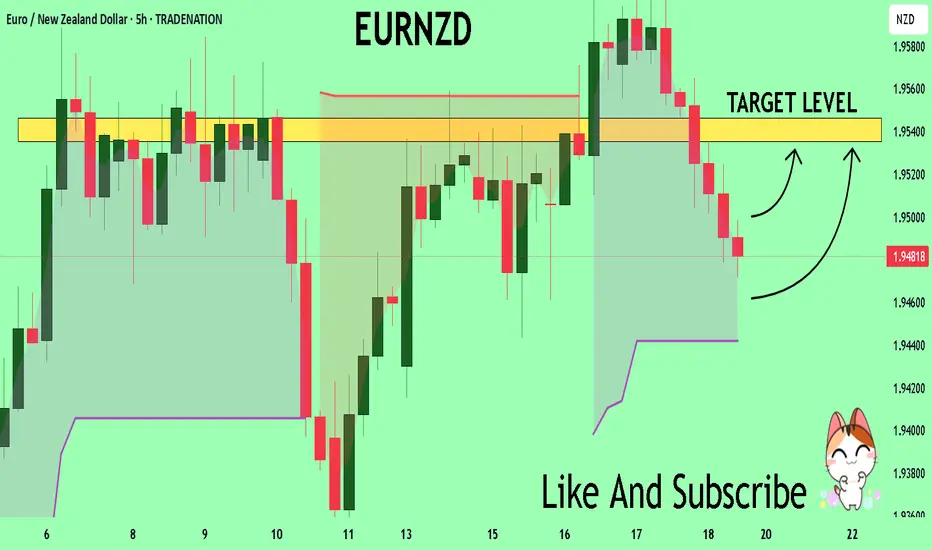
EURNZD On The Rise! BUY!
My dear friends,
EURNZD looks like it will make a good move, and here are the details:
The market is trading on 1.9481 pivot level.
Bias - Bullish
Technical Indicators: Supper Trend generates a clear long signal while Pivot Point HL is currently determining the overall Bullish trend of the market.
Goal - 1.9535
About Used Indicators:
Pivot points are a great way to identify areas of support and resistance, but they work best when combined with other kinds of technical analysis
Disclosure: I am part of Trade Nation's Influencer program and receive a monthly fee for using their TradingView charts in my analysis.
———————————
WISH YOU ALL LUCK
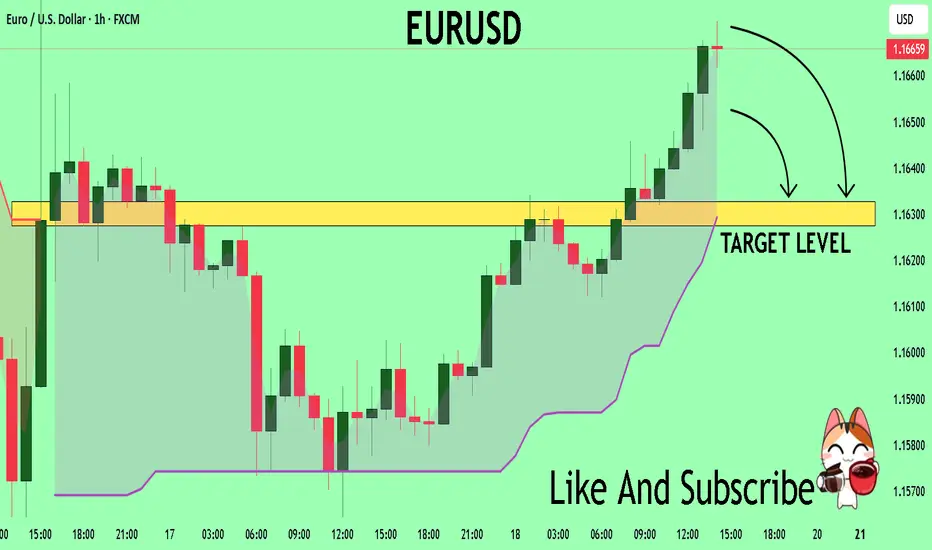
EURUSD Will Collapse! SELL!
My dear subscribers,
This is my opinion on the EURUSD next move:
The instrument tests an important psychological level 1.1663
Bias - Bearish
Technical Indicators: Supper Trend gives a precise Bearish signal, while Pivot Point HL predicts price changes and potential reversals in the market.
Target - 1.1632
About Used Indicators:
On the subsequent day, trading above the pivot point is thought to indicate ongoing bullish sentiment, while trading below the pivot point indicates bearish sentiment.
Disclosure: I am part of Trade Nation's Influencer program and receive a monthly fee for using their TradingView charts in my analysis.
———————————
WISH YOU ALL LUCK
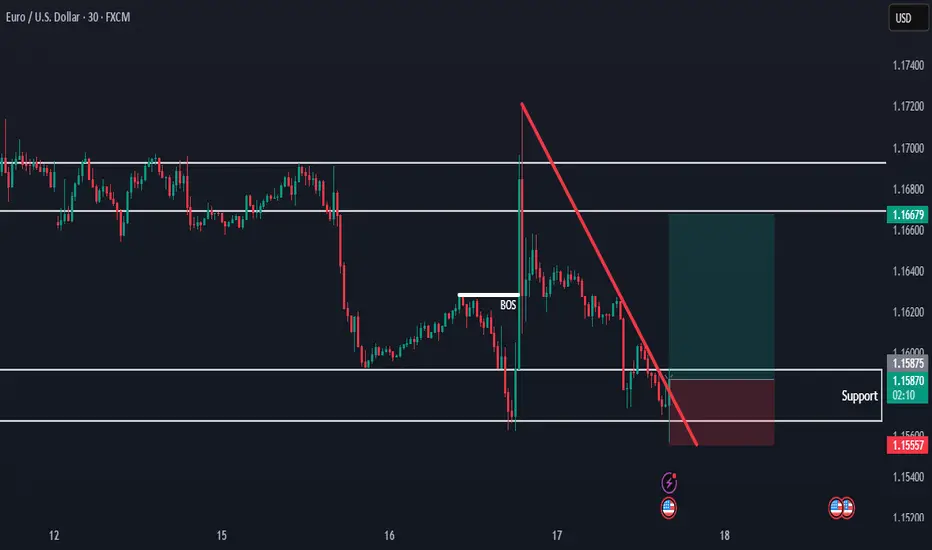
EURUSD Holding Support — Bullish Move in ProgressHello everybody!
There is a strong higher timeframe resistance now acting as support.
Price is respecting this area and starting to form a strong move to the upside.
We are looking to enter a buy position here, as the overall bullish trend is likely to continue.
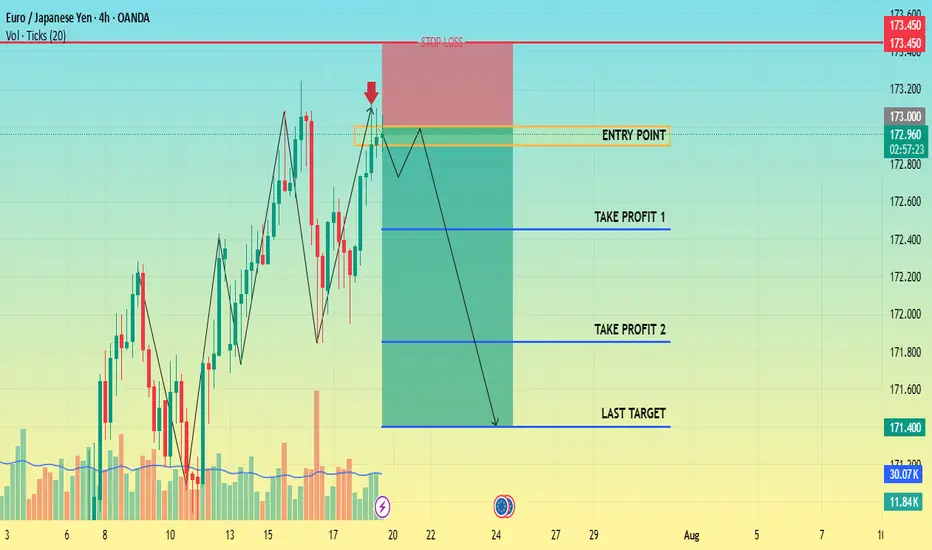
CHECK EURJPY SIGNAL READ CAPTAINShort (sell)
Entry Point: Around 173.000 172.900
Stop Loss: Around 173.450
🎯 Target Levels
Take Profit 1:
172.450
Take Profit 2:
171.850
Last Target:
171.400
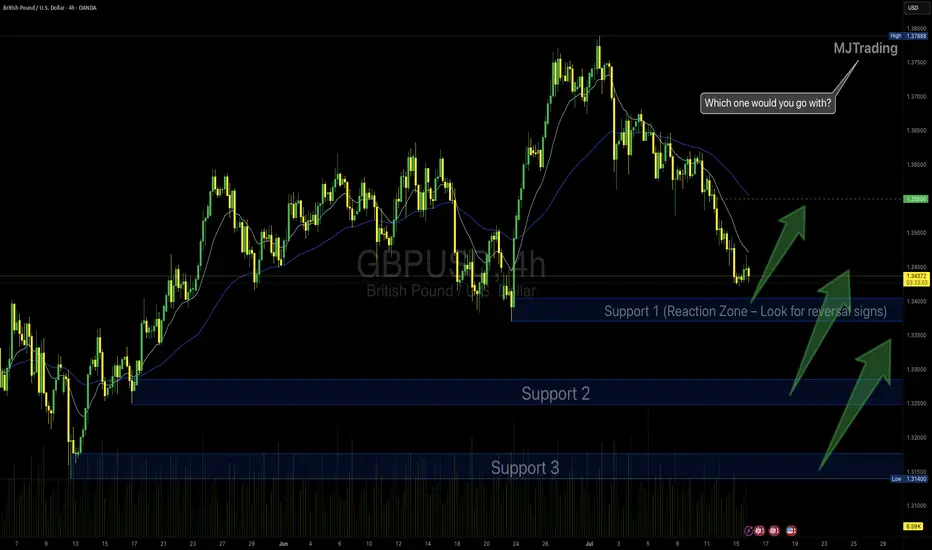
GBPUSD Idea – Demand Zones & Potential Reversal Play🧠 MJTrading:
After a steady downtrend, GBPUSD is now approaching a strong 4H demand zone (Support 1), where we previously saw explosive bullish reactions.
Price is also extended from both EMAs, showing potential for a technical pullback or full reversal.
💡Scenarios to consider:
🔹 If Support 1 holds → we may see a bounce toward 1.3500+
🔹 If broken → Support 2 & 3 offer deeper liquidity and high-probability demand zones
👀 Watch for:
Bullish reversal candles (engulfing / hammer)
Bullish divergence on lower timeframes
Volume spikes on reaction
⚠️ Invalidation:
If Support 3 breaks with strong momentum, we might enter a bearish continuation phase.
#GBPUSD #Forex #ChartDesigner #SmartMoney #PriceAction #MJTrading #ForexSetup #TrendReversal #SupportZones
GBPCHF may bounce back from 1.0750 support areaGBPCHF may bounce back from 1.0750 support area
GBPCHF reached a low of 1.0687 for the time being and resumed an upward move.
The price rose above a strong support area, indicating increasing momentum. If GBPCHF manages to hold around this area, the chances of further growth will increase.
Key target areas: 1.0800; 1.0820 and 1.0865
You may find more details in the chart!
Thank you and Good Luck!
PS: Please support with a like or comment if you find this analysis useful for your trading day

EURUSD: Bears Are Winning! Short!
My dear friends,
Today we will analyse EURUSD together☺️
The market is at an inflection zone and price has now reached an area around 1.16557 where previous reversals or breakouts have occurred.And a price reaction that we are seeing on multiple timeframes here could signal the next move down so we can enter on confirmation, and target the next key level of 1.16419..Stop-loss is recommended beyond the inflection zone.
❤️Sending you lots of Love and Hugs❤️

CHECK EURUSD SIGNAL READ CAPTAIN📍 Trade Setup Overview
Trade Direction: Short (sell)
Entry Point: Around 1.16600 1.16530
Stop Loss: Around 1.16900
🎯 Target Levels
Take Profit 1:
1.16250
Take Profit 2:
1.15800
Last Target:
1.15500

NZDCADThis is a 1-hour chart of NZDCAD, and you’ve clearly marked a descending channel with multiple respected touches on both trendlines — showing clean market structure.
Analysis:
- Price is approaching the upper boundary of the descending channel again.
- There’s a potential supply zone just above current price.
- The blue projection suggests a possible rejection from that upper zone, continuing the overall bearish trend.
- Repeated reactions at the channel edges signal strong technical respect.
What to Do Next:
- Wait for bearish confirmation (e.g. rejection wick, bearish engulfing) at the upper trendline/supply zone.
- If confirmed, enter a sell trade with targets toward the lower boundary of the channel.
- Place stop-loss just above the supply zone or last swing high.
Suggested Caption for Social Media:
"NZDCAD playing beautifully within this descending channel. Watching closely for a bearish reaction at this key zone. Patience is power in trading. Let the market speak. 📉🔥 #ForexAnalysis #NZDCAD #PriceAction #SmartTrading"
Let me know if you want it in a more casual or motivational tone.

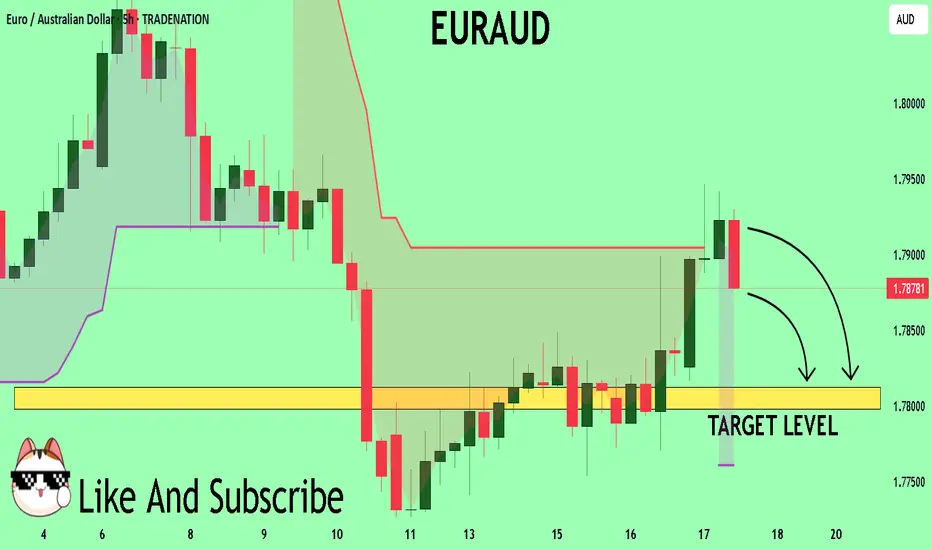
EURAUD Buyers In Panic! SELL!
My dear friends,
Please, find my technical outlook for EURAUD below:
The price is coiling around a solid key level - 1.7893
Bias - Bearish
Technical Indicators: Pivot Points Low anticipates a potential price reversal.
Super trend shows a clear sell, giving a perfect indicators' convergence.
Goal - 1.7812
About Used Indicators:
The pivot point itself is simply the average of the high, low and closing prices from the previous trading day.
Disclosure: I am part of Trade Nation's Influencer program and receive a monthly fee for using their TradingView charts in my analysis.
———————————
WISH YOU ALL LUCK
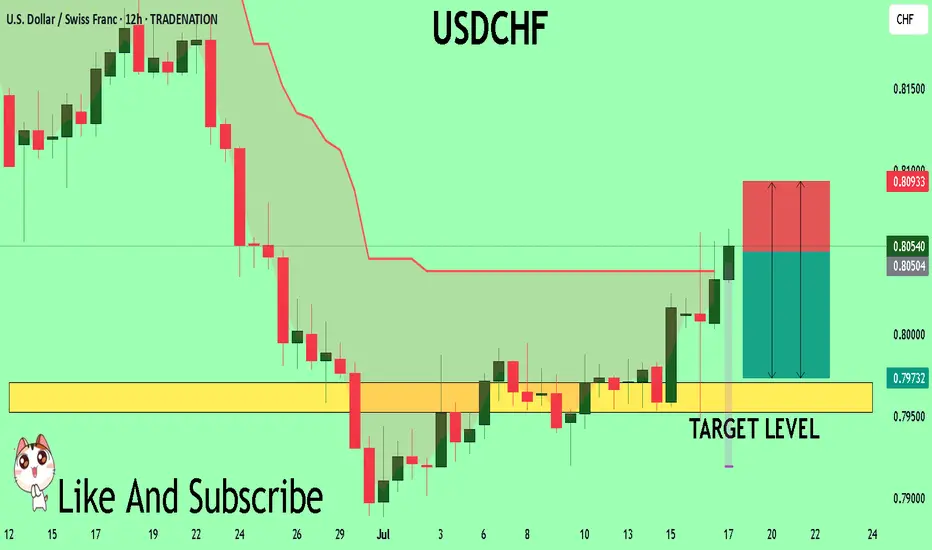
USDCHF The Target Is DOWN! SELL!
My dear followers,
I analysed this chart on USDCHF and concluded the following:
The market is trading on 0.8050 pivot level.
Bias - Bearish
Technical Indicators: Both Super Trend & Pivot HL indicate a highly probable Bearish continuation.
Target - 0.7970
Safe Stop Loss - 0.8093
About Used Indicators:
A super-trend indicator is plotted on either above or below the closing price to signal a buy or sell. The indicator changes color, based on whether or not you should be buying. If the super-trend indicator moves below the closing price, the indicator turns green, and it signals an entry point or points to buy.
Disclosure: I am part of Trade Nation's Influencer program and receive a monthly fee for using their TradingView charts in my analysis.
———————————
WISH YOU ALL LUCK