Lingrid | USDJPY Pullback From the Key Resistance ZoneThe price perfectly fulfilled my previous idea . FX:USDJPY is moving inside an upward channel after reclaiming support near 145.25 and breaking out from its previous range. The pair printed a higher low and is now approaching resistance around 146.78, testing the upper boundary of the ascending channel. If it fails to break through the red resistance trendline, a retracement toward the 145.25–145.00 support is likely.
📈 Key Levels
Buy zone: 146.78 - 147.00
Sell trigger: rejection from 146.78 and lower high below resistance
Target: 145.25
Buy trigger: bullish breakout above 147.00 with momentum confirmation
💡 Risks
Price rejection near 146.78 may cause a sharp pullback
A surge above 147.00 breaks trendline structure
Market reaction to macro data could distort short-term pattern
If this idea resonates with you or you have your own opinion, traders, hit the comments. I’m excited to read your thoughts!
Forex market

EURGBP SHORT DAILY FORECAST Q3 D8 W28 Y25EURGBP SHORT DAILY FORECAST Q3 D8 W28 Y25
Professional Risk Managers👋
Welcome back to another FRGNT chart update📈
Diving into some Forex setups using predominantly higher time frame order blocks alongside confirmation breaks of structure.
Let’s see what price action is telling us today! 👀
💡Here are some trade confluences📝
✅Daily Order block identified
✅4H Order Block identified
✅1H Order Block identified
🔑 Remember, to participate in trading comes always with a degree of risk, therefore as professional risk managers it remains vital that we stick to our risk management plan as well as our trading strategies.
📈The rest, we leave to the balance of probabilities.
💡Fail to plan. Plan to fail.
🏆It has always been that simple.
❤️Good luck with your trading journey, I shall see you at the very top.
🎯Trade consistent, FRGNT X

GBPCAD LONG FORECAST Q3 D8 W28 Y25GBPCAD LONG FORECAST Q3 D8 W28 Y25
Professional Risk Managers👋
Welcome back to another FRGNT chart update📈
Diving into some Forex setups using predominantly higher time frame order blocks alongside confirmation breaks of structure.
Let’s see what price action is telling us today! 👀
💡Here are some trade confluences📝
✅Daily Order block identified
✅4H Order Block identified
✅1H Order Block identified
🔑 Remember, to participate in trading comes always with a degree of risk, therefore as professional risk managers it remains vital that we stick to our risk management plan as well as our trading strategies.
📈The rest, we leave to the balance of probabilities.
💡Fail to plan. Plan to fail.
🏆It has always been that simple.
❤️Good luck with your trading journey, I shall see you at the very top.
🎯Trade consistent, FRGNT X


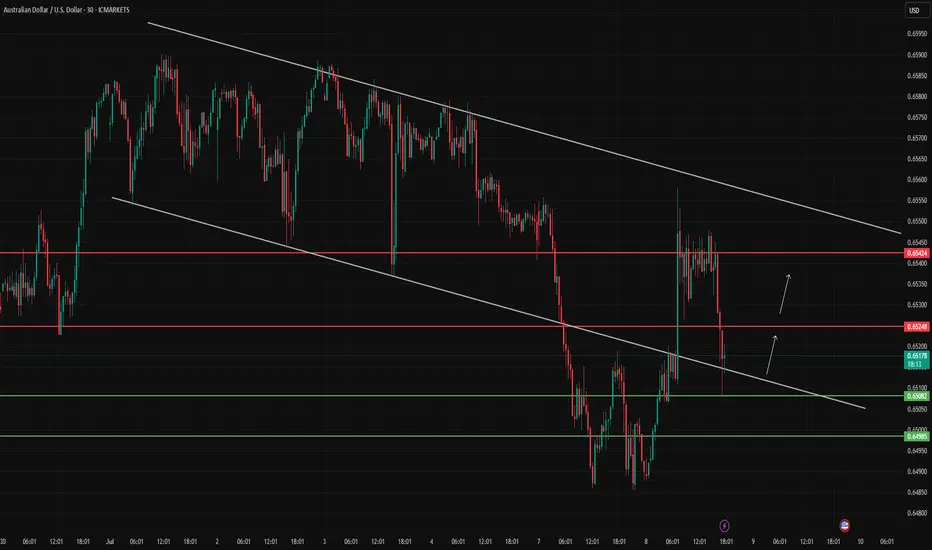
AUDUSD – Watching for a Channel ReboundAUDUSD is testing key support at the lower boundary of the descending channel. Eyes on 0.65248 and 0.65424 as potential rebound targets.
NZDUSD: Bullish Continuation & Long Trade
NZDUSD
- Classic bullish pattern
- Our team expects retracement
SUGGESTED TRADE:
Swing Trade
Buy NZDUSD
Entry - 0.5984
Stop - 0.5949
Take - 0.6053
Our Risk - 1%
Start protection of your profits from lower levels
Disclosure: I am part of Trade Nation's Influencer program and receive a monthly fee for using their TradingView charts in my analysis.
❤️ Please, support our work with like & comment! ❤️

SHORT and SHORT in GBPUSDHello Fellow traders,
I am sharing my short position in GBP/USD today.
I have decided to go short on GBP/USD, following the announcement of steep U.S. tariffs. Fundamentally, this aligns with my outlook: the USD is acting as a safe haven, while the GBP remains more risk-sensitive amidst global uncertainty.
From a technical standpoint—though I keep things simple—my analysis supports the bearish sentiment, and I have entered a short position accordingly.
Good luck, everyone, and trade safe!

GBPUSD Expected Growth! BUY!
My dear friends,
GBPUSD looks like it will make a good move, and here are the details:
The market is trading on 1.3557 pivot level.
Bias - Bullish
Technical Indicators: Supper Trend generates a clear long signal while Pivot Point HL is currently determining the overall Bullish trend of the market.
Goal - 1.3657
Recommended Stop Loss - 1.3503
About Used Indicators:
Pivot points are a great way to identify areas of support and resistance, but they work best when combined with other kinds of technical analysis
Disclosure: I am part of Trade Nation's Influencer program and receive a monthly fee for using their TradingView charts in my analysis.
———————————
WISH YOU ALL LUCK

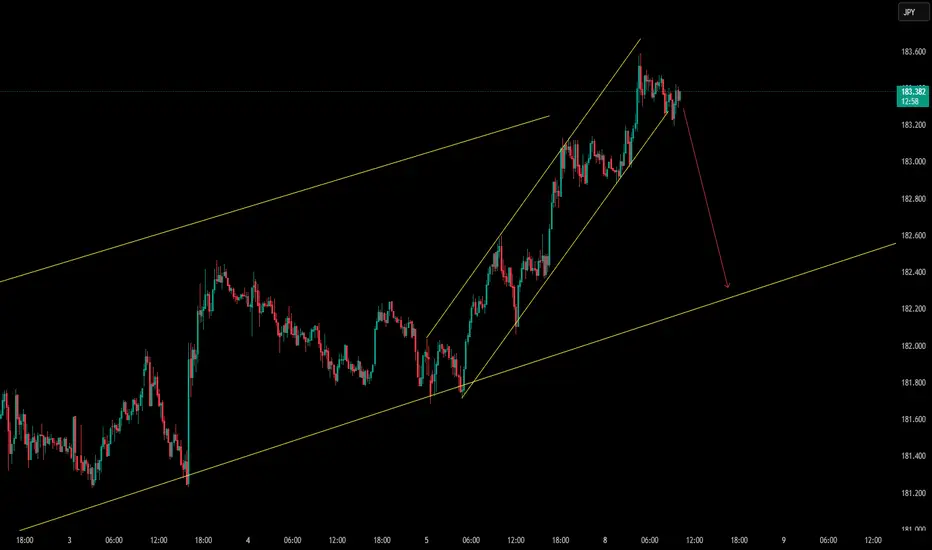
This pullback is necessary to maintain the channel structure.OANDA:CHFJPY
We're in an ascending channel on the higher time frame, and based on candlestick patterns, I expect a minor crash as the market tests the bottom of the channel.
Stay with me so we don't miss the move. ✅
USDCAD obeying Elliott Wave Principles.Our D1 chart is a continuation of a wave that started earlier and had a Flat correction for its Wave 2(Red), hence a Zigzag should be expected for our Wave 4(Red). When Wave 3(Red) completes, an aggressive selling move is triggered this is our Wave A(Black). A correction of this move occurs in the form of a Flat and this is now our Wave B(Black) of the major Zigzag correction that started when Wave 3(Red) completed. When Wave B(Black) is done, we should expect a Wave C(Black) to complete the Zigzag. Our Wave C(Black) unfolds in a 5 wave move and this is very normal. This 5 wave move is marked in Green. When Wave 1(Green) completes, our Wave 2(Green) unfolds in a Flat correction, meaning our Wave 4(Green) should be a Zigzag correction. After Wave 2(Green) completes, Wave 3(Green) is a strong downward move that reaches the 261.8% Fib. level. On reaching this level, we see a retest and a confirmation occurring. This is is to signal the end of Wave 3(Green) and the start of Wave 4(Green). As mentioned earlier, we should expect a Zigzag correction for Wave (Green) and we can see a shallow pullback and retest. The pullback is our first wave of the three wave Zigzag and is marked as Wave A(Blue). The retest as noted, does not go beyond Wave 3(Green) and this confirms it is a Zigzag. This retest is marked as Wave B(Blue). Next would be a Wave C(Blue) to complete Wave 4(Green). A retest and confirmation gives us an entry for the Wave C(Blue) which is also Wave 4(Green).


GBPJPY: Bearish Forecast & Outlook
Looking at the chart of GBPJPY right now we are seeing some interesting price action on the lower timeframes. Thus a local move down seems to be quite likely.
Disclosure: I am part of Trade Nation's Influencer program and receive a monthly fee for using their TradingView charts in my analysis.
❤️ Please, support our work with like & comment! ❤️

EURGBP Bullish Flag Pattern!
HI,Traders !
EURGBP is trading in an
Uptrend and made a bullish
Breakout out of bullish flag
Pattern so we are
Bullish biased and we
Will be expecting a
Further bullish move up !
Comment and subscribe to help us grow !

GBPCAD: Bullish Continuation is Highly Probable! Here is Why:
Remember that we can not, and should not impose our will on the market but rather listen to its whims and make profit by following it. And thus shall be done today on the GBPCAD pair which is likely to be pushed up by the bulls so we will buy!
Disclosure: I am part of Trade Nation's Influencer program and receive a monthly fee for using their TradingView charts in my analysis.
❤️ Please, support our work with like & comment! ❤️

SYMMETRYHey traders, hope you’re crushing it! 🚀
Spotted a crisp ABC Bullish Symmetry on the EUR/NZD 1-Hour chart—let’s break it down:
🧠 Pattern Breakdown
A→B: 1.94537 → 1.93486 (pullback low)
B→C: 1.93486 → 1.95882 (impulse high)
C→D: 1.95882 → 1.94688 (corrective low)
Point D lines up perfectly with the 100% expansion of the A→B move projected off C—textbook harmonic symmetry!
✅ Why This Works
ABC Symmetry: CD ≈ AB in distance
Fib Expansion: D hits the 100% A→B expansion from C
Clear Structure: Strong impulse then neat corrective leg
⚔️ Trade Plan
Trigger: Wait for an hourly close above 23.6% retrace of C→D at 1.95253 to confirm buyers.
Entry Zone: 1.95253–1.94688 (our PCZ + expansion zone)
Stop-Loss: Just below D at 1.94688 (e.g. 1.9455)
Size: Risk 1–2% of your account
🎯 Profit Targets
T1: 61.8% retrace of C→D → 1.96169
T2: 78.6% retrace of C→D → 1.96571
🔍 Confirmation & Invalidation
Confirm: Bullish pin-bar or engulfing candle closing above 1.95253
Invalidate: Price closes below 1.94688 (point D) – scrap the idea
Keep it simple: ABC → 100% Expansion → PCZ → Trigger → Ride.
Respect that stop under D, let price do the talking, and make sure to watch for any EUR/NZD news for extra context. Trade safe and stack those pips! ✌️

GBP/USD30 Mins Frame
🧠 Technical Overview:
Price is currently testing a strong resistance zone after a gradual upward movement, with signs of a potential bearish reversal.
A rising wedge pattern is forming — typically a bearish reversal pattern, especially if broken to the downside.
🧩 Key Technical Elements:
1. Supply Zone:
Defined between 1.3675 and 1.3717 — a previously strong resistance area.
Price is currently facing rejection within this zone, showing weakening bullish momentum.
2. Entry Point:
Sell at 1.36560, triggered by rejection from the resistance zone and a potential breakdown below the ascending support (blue line).
3. Stop Loss:
1.37177, placed above the supply zone — a logical level that invalidates the bearish setup if reached.
4. Targets:
First Target: 1.35602 – a clear previous support level and logical profit-taking zone.
Second Target: 1.34207 – a stronger, more significant support zone, likely to be tested if bearish momentum continues.
📉 Expected Price Action:
The chart shows a weak rising wedge pattern, indicating potential buyer exhaustion.
A break below the ascending trendline (blue) may trigger strong downside movement.
The expected move is illustrated with the red arrow on the chart, indicating a bearish trajectory.
🔥 Risk-to-Reward Ratio (R:R):
First Target:
Potential Reward: ~95 pips
Risk (SL): ~61 pips
→ R:R ≈ 1.56:1
Second Target:
Potential Reward: ~235 pips
→ R:R ≈ 3.85:1
✅ Very favorable, especially toward the second target.
✅ Conclusion:
The short setup is technically valid and supported by price structure and resistance confirmation.
The supply zone has proven strong, and price is struggling to break above it.
A solid trade opportunity for short- to medium-term traders with clearly defined risk and reward.


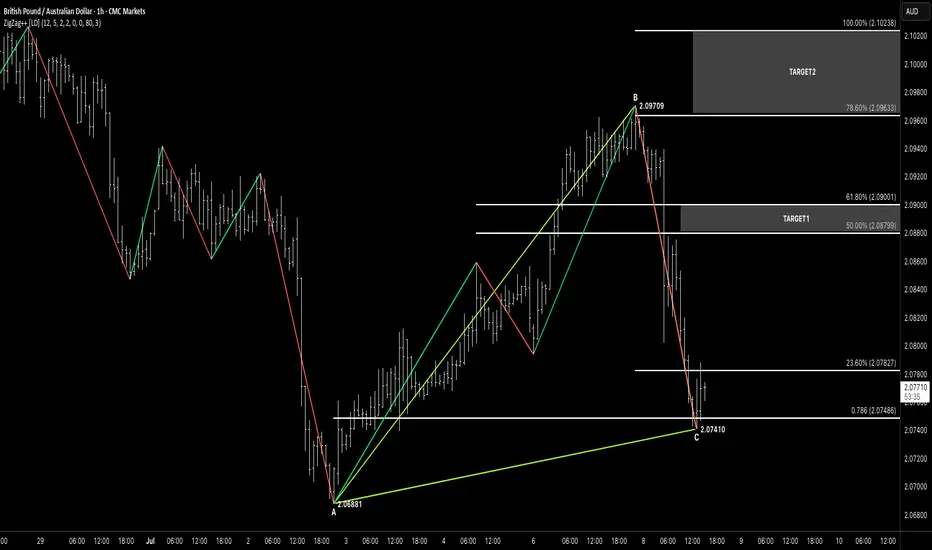
ABCHey traders, hope you’re crushing it this week! 🚀
Just spotted a clean ABC Bullish setup on the GBP/AUD 1-Hour chart. Here’s the breakdown:
🧠 Pattern Breakdown
A→B (Impulse Up): 2.06881 → 2.09709
B→C (Retrace Down): 2.09709 → 2.07410
Point C landed right on our rising A→C trendline and just under the 78.6% Fib of A→B (~2.07486)—double confluence!
✅ Why This Works
ABC Structure: Clear impulse then corrective leg into support
Trendline Support: A→C line guiding our C pivot
Fib Confluence: C sits in the 23.6%–78.6% zone of A→B (2.07827–2.07486)
⚔️ Trade Plan
Entry: Long after an hourly close above 2.07827 (23.6% level), ideally within 2.07827–2.07410 (PCZ)
Stop-Loss: Just below point C at 2.07410 (e.g. 2.07380)
Size: Keep risk sensible—1–2% of your account
🎯 Profit Targets
T1: 50% retrace of B→C → 2.08799 (take partial)
T2: 61.8% retrace → 2.09001
T3: 78.6% retrace → 2.09633–2.10238
🔍 Confirmation & Invalidation
Confirm: Look for a bullish pin-bar or engulfing candle closing above 2.07827 before entering
Invalidate: If price dips below 2.07410 (point C), scrap the idea—this setup needs that level to hold
💡 Keep It Simple:
ABC → PCZ → 23.6% close → Trigger → Ride.
Let the chart guide you, not your emotions, and watch for any GBP/AUD news for extra context.
Here’s to tight stops, smart entries, and smooth profits! ✌️
EURUSD Will Go Down!
HI,Traders !
#EURUSD is making a
Bullish rebound after a
Bearish breakout but the
Pair will soon hit a new
Horizontal resistance
Of 1.17489 from where
We will be expecting a
Further move down !
Comment and subscribe to help us grow !

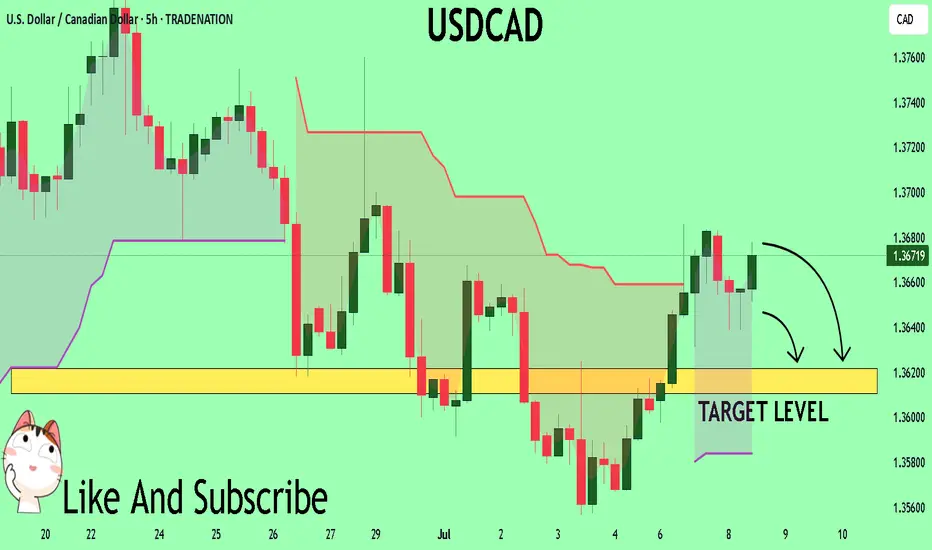
USDCAD My Opinion! SELL!
My dear friends,
Please, find my technical outlook for USDCAD below:
The price is coiling around a solid key level - 1.3669
Bias - Bearish
Technical Indicators: Pivot Points High anticipates a potential price reversal.
Super trend shows a clear sell, giving a perfect indicators' convergence.
Goal - 1.3621
About Used Indicators:
The pivot point itself is simply the average of the high, low and closing prices from the previous trading day.
Disclosure: I am part of Trade Nation's Influencer program and receive a monthly fee for using their TradingView charts in my analysis.
———————————
WISH YOU ALL LUCK
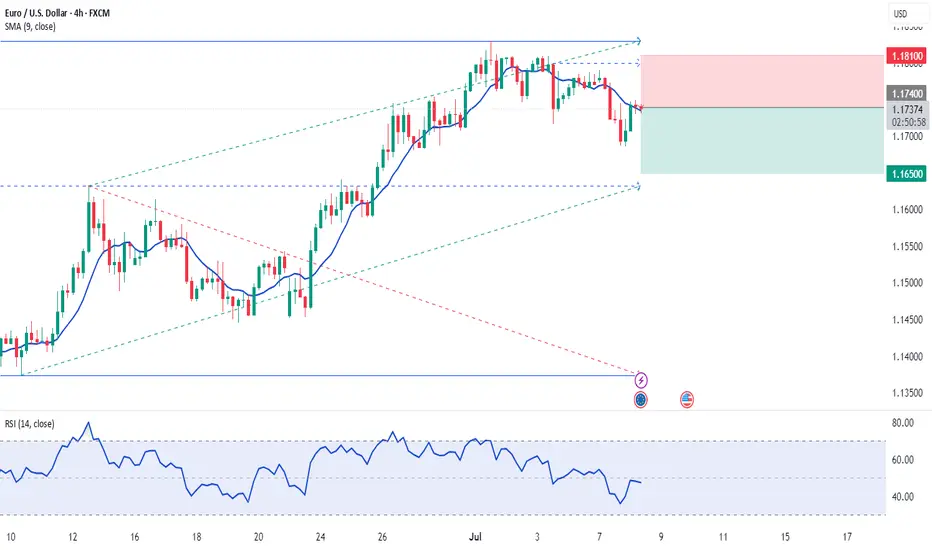
EUR/USD 2-Hour Chart - OANDA2-hour performance of the Euro/U.S. Dollar (EUR/USD) currency pair on the OANDA platform as of July 08, 2025. The current exchange rate is 1.17365, reflecting a 0.24% increase (+0.00279). The chart includes a recent sharp decline highlighted in a shaded area, with buy and sell signals at 1.17375 and 1.17357 respectively. Key price levels are marked, ranging from 1.1500 to 1.1850, with a focus on the recent market movement.

EURAUD BUY SETUP IDEAI will be longing #euraud when price return to the demand area 1.78625 while my invalidation point is 1.78093 and target is 1.80223 respectively. Apply proper risk management🤌🏾.
