USD/JPY - continue with the UptrendOn USD/JPY , it's nice to see a strong buying reaction at the price of 143.860.
There's a significant accumulation of contracts in this area, indicating strong buyer interest. I believe that buyers who entered at this level will defend their long positions. If the price returns to this area, strong buyers will likely push the market up again.
(FVG) - Fair Value GAP and high volume cluster are the main reasons for my decision to go long on this trade.
Happy trading
Dale
Forex market

NZDUSD Pullback in Play – Head & Shoulders Signals More DownsideNZDUSD ( OANDA:NZDUSD ) is currently trading near the Resistance zone($0.612-$0.605) and has also managed to break the Support zone($0.604-$0.602) . We consider the Support zone as the neckline of the Head and Shoulders Pattern .
In terms of classic technical analysis , NZDUSD has managed to form a Head and Shoulders Pattern .
I expect NZDUSD to decline towards the Support zone($0.5968-$0.5946) after completing the pullback .
Note: Stop Loss(SL): $0.6062
Please respect each other's ideas and express them politely if you agree or disagree.
New Zealand Dollar/ U.S. Dollar Analyze (NZDUSD), 1-hour time frame.
Be sure to follow the updated ideas.
Do not forget to put a Stop loss for your positions (For every position you want to open).
Please follow your strategy and updates; this is just my Idea, and I will gladly see your ideas in this post.
Please do not forget the ✅' like '✅ button 🙏😊 & Share it with your friends; thanks, and Trade safe.

EURJPY: Another Bullish pattern pushing EURJPY to 173 EURJPY: Another Bullish pattern pushing EURJPY to 173
Yesterday, EURJPY confirmed a bullish triangle pattern during the opening of the U.S. market.
EURJPY has already reached 170.60 and is coming back for a retest of the broken resistance before moving higher again.
It's a complex situation, but if the price holds above the 169.75 pattern, the chances of a clear uptrend will increase further.
Remember that the larger pattern will be almost complete near 173.00.
You may find more details in the chart!
Thank you and Good Luck!
PS: Please support with a like or comment if you find this analysis useful for your trading day
Disclosure: I am part of Trade Nation's Influencer program and receive a monthly fee for using their TradingView charts in my analysis.

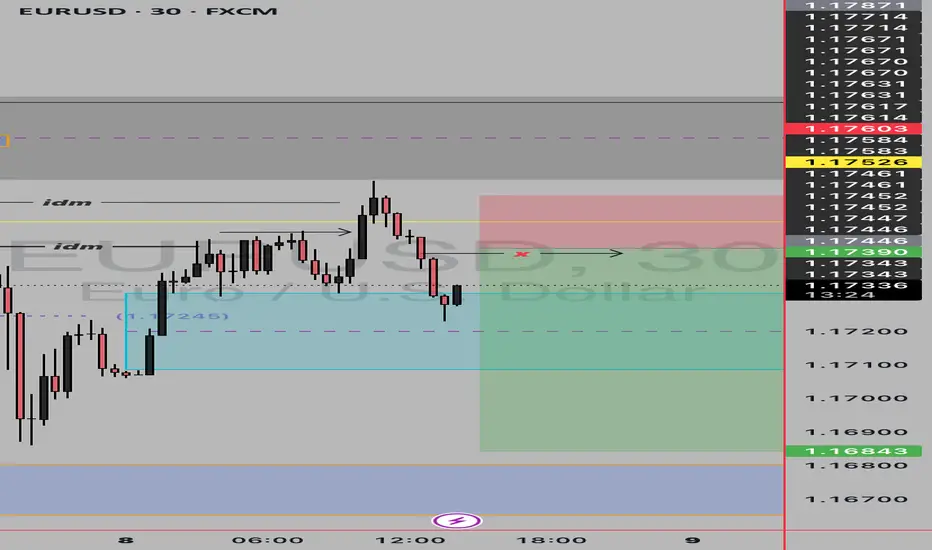
30M Insight: EURUSD Buy Limit ReadyGood Mornıng Traders;☀️
Based on a 30-minute analysis, I’ve identified a shift in EURUSD market structure. I’ll be waiting for price to reach my level with a buy limit order.
📥 BUY LIMIT ORDER: 1.17180
🛑 STOP LOSS: 1.16946
🎯 TP1: 1.17275
🎯 TP2: 1.17412
🎯 TP3: 1.17649
📊 Risk / Reward Ratio: 2.00
Patience meets precision. Let the market come to you.
🧠 Master your mindset with iron discipline.
Never fear the trade—let the trade fear you.
Keep your motivation high and your focus sharper than ever.
-----
Your likes and support are what keep me motivated to share these analyses consistently.
Huge thanks to everyone who shows love and appreciation! 🙏

USD/JPY - H1- Wedge Breakout (07.07.2025)The USD/JPY pair on the H1 timeframe presents a Potential Buying Opportunity due to a recent Formation of a Wedge Breakout Pattern. This suggests a shift in momentum towards the upside and a higher likelihood of further advances in the coming hours.
Possible Long Trade:
Entry: Consider Entering A Long Position around Trendline Of The Pattern.
Target Levels:
1st Resistance – 148.00
🎁 Please hit the like button and
🎁 Leave a comment to support for My Post !
Your likes and comments are incredibly motivating and will encourage me to share more analysis with you.
Best Regards, KABHI_TA_TRADING
Thank you.
Disclosure: I am part of Trade Nation's Influencer program and receive a monthly fee for using their TradingView charts in my analysis.

Bearish Bias on EURUSD Down trend line respected
D= pullback 4H= Bearish - low high form
1H = Bearish at LH
- short term down trend is over
- Bearish engulfing candle
- both 14 and 50 ema above price at a LH
= short entry

AUD/USD💰Symbol: { AUD/USD }
🟩Price: { 0.65569 }
🟥Stop: { 0.65850 }
1️⃣profit: { 0.65244 }
2️⃣profit: { 0.64888 }
3️⃣profit: { 0.64528 }
4️⃣profit: { 0.64093 }
📊Check your chart before entering.
🚨Check before use to make sure there is no important news.🚨

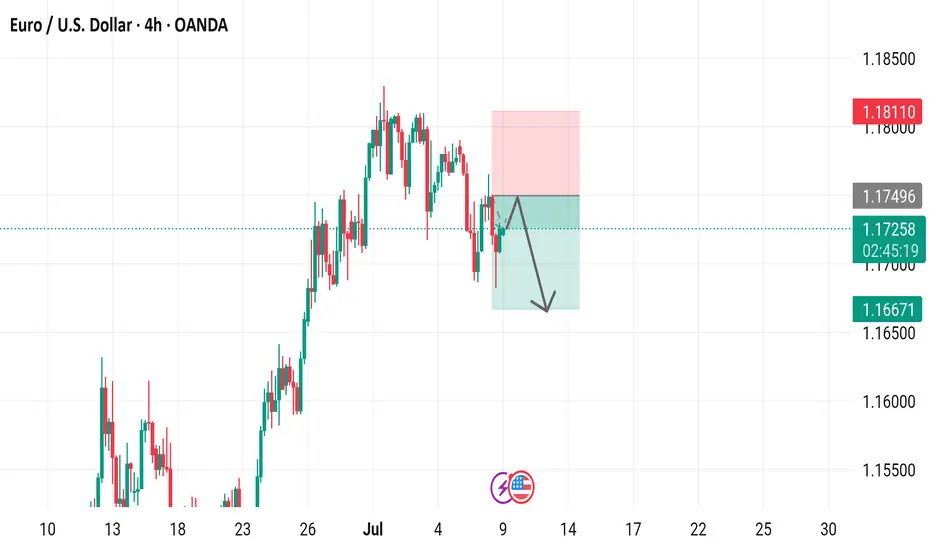
EURUSD TRADES BEARISH
Last week, due to a fail of holding above the 1.18000 level, we saw a huge 1-hour decline of 0.39% on big selling volumes, which is not typical for such instruments as EURUSD. Since that time, the price has been moving within a descending channel and has formed a possible pennant yesterday. All of the factors "vote" for going bearish in this asset.
So, what will be the possible scenario? We may go market sell right immediately, or wait till the breakout of the pennant pattern. In this case we may set
🔽 a sell stop order at 1.17400 with
❌a stop loss at 1.17670 and
🤑a take profit at 1.16915
Additionally, EURUSD may go even further downstairs, next to a 1.16000 support level. For this case we may preserve some minor part of our position with a take profit set nearby this level.

Eurusd sellwe have retested daily where we broke previous candle open and currently changed structure currently waiting for retracement to the 50% and premium zone to short
EURUSDWe have an Ob on that 15 m TF but we also have the Liquidity on bottom side and on top so possibly it will Grab the lower Liquidity and then go up But we need to be causious for that OB on 15m that zone

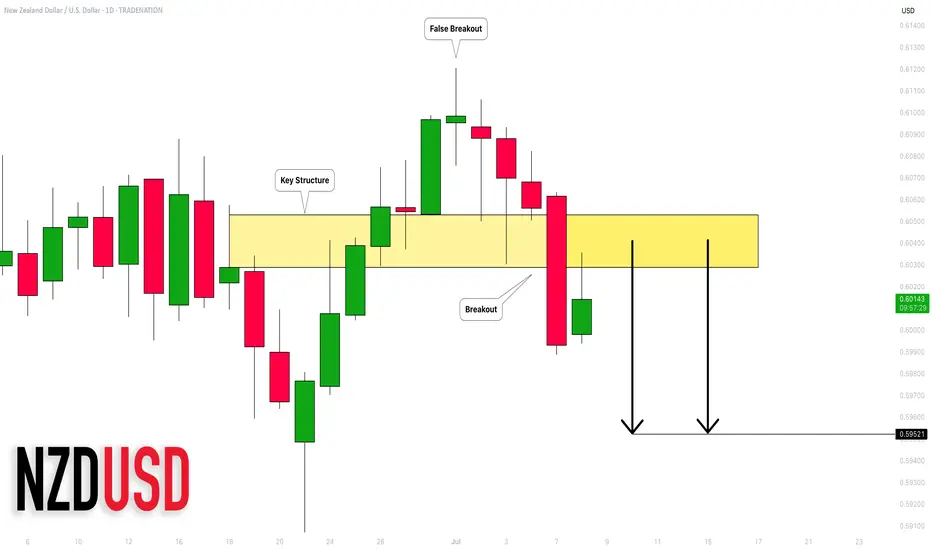
NZDUSD: Important Breakout 🇳🇿🇺🇸
NZDUSD looks bearish after a false violation of a current daily structure high.
The price dropped with a high momentum bearish candle, violating
a significant support cluster and closing below that.
The pair may fall even more.
Next support - 0.5952
❤️Please, support my work with like, thank you!❤️
I am part of Trade Nation's Influencer program and receive a monthly fee for using their TradingView charts in my analysis.
CHECK EURUSD SIGNAL READ CAPTAIN Entry Point: 1.17450
Stop Loss: 1.17700
Take Profit 1: Approx. 1.17100
Take Profit 2: Approx. 1.16900
Last Target: 1.16750

A Move to Parity?We've seen 5 waves to the upside to complete the assumed C-wave and an RSI divergence has emerged to support an end to the upside trend. We are waiting for a trendline break to the downside to confirm a change in trend.

X1: GBPCHF Long Trade Risking 1% to make 1.35%OANDA:GBPCHF Long trade, with my back testing of this strategy, it hits multiple possible take profits, manage your position accordingly.
Risking 1% to make 1.35%
This is good trade, don't overload your risk like greedy, be disciplined trader, this is good trade.
Use proper risk management
Looks like good trade.
Lets monitor.
Use proper risk management.
Disclaimer: only idea, not advice

BUY EURCAD now for a four hour time frame bullish trend continuBUY EURCAD now for a four hour time frame bullish trend continuation ...............
STOP LOSS: 1.60037
This buy trade setup is based on hidden bullish divergence trend continuation trading pattern ...
Always remember, the trend is your friend, so whenever you can get a signal that the trend will continue, then good for you to be part of it
TAKE PROFIT : take profit will be when the trend comes to an end, feel from to send me a direct DM if you have any question about take profit or anything...
Remember to risk only what you are comfortable with... trading with the trend, patient and good risk management is the key to success here

Bearish reversal?USD/JPY is reacting off the pivot and could drop to the 1st support which has been identified as a pullback support.
Pivot: 146.18
1st Support: 145.01
1st Resistance: 147.62
Risk Warning:
Trading Forex and CFDs carries a high level of risk to your capital and you should only trade with money you can afford to lose. Trading Forex and CFDs may not be suitable for all investors, so please ensure that you fully understand the risks involved and seek independent advice if necessary.
Disclaimer:
The above opinions given constitute general market commentary, and do not constitute the opinion or advice of IC Markets or any form of personal or investment advice.
Any opinions, news, research, analyses, prices, other information, or links to third-party sites contained on this website are provided on an "as-is" basis, are intended only to be informative, is not an advice nor a recommendation, nor research, or a record of our trading prices, or an offer of, or solicitation for a transaction in any financial instrument and thus should not be treated as such. The information provided does not involve any specific investment objectives, financial situation and needs of any specific person who may receive it. Please be aware, that past performance is not a reliable indicator of future performance and/or results. Past Performance or Forward-looking scenarios based upon the reasonable beliefs of the third-party provider are not a guarantee of future performance. Actual results may differ materially from those anticipated in forward-looking or past performance statements. IC Markets makes no representation or warranty and assumes no liability as to the accuracy or completeness of the information provided, nor any loss arising from any investment based on a recommendation, forecast or any information supplied by any third-party.

EUR/USD 4-Hour Chart Analysis4-hour candlestick chart for the Euro/U.S. Dollar (EUR/USD) currency pair on the OANDA platform. The chart shows a recent upward trend followed by a consolidation phase, with key technical levels and trading signals indicated. The presence of "SELL" and "BUY" signals suggests active trading opportunities. The downward arrow within the shaded area hints at a potential bearish move. This chart is likely used by traders to analyze short-term price movements and make informed decisions.
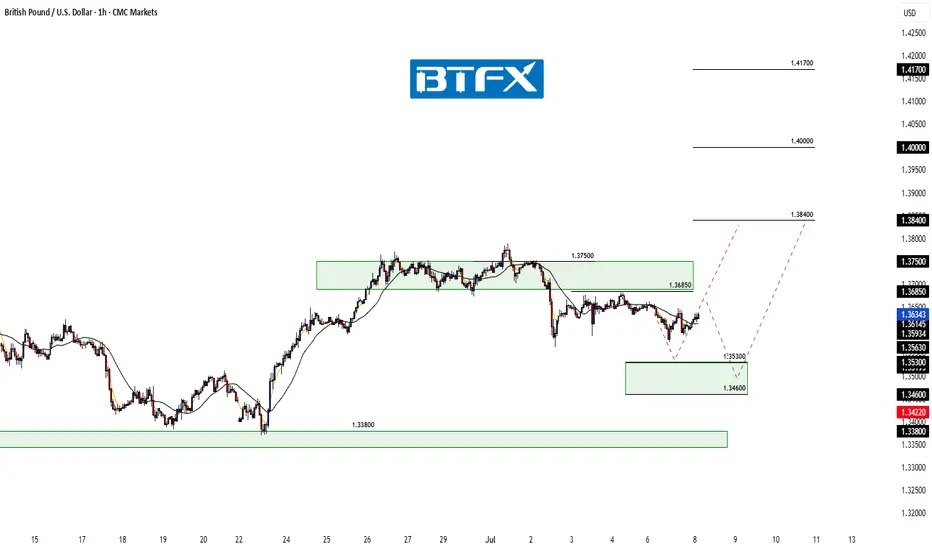
GBP/USD: Short‑Term Pullback Likely Before Fresh Upside AttemptHi everyone,
GBP/USD continues to consolidate below the 1.36850 level. We expect a retest of this level today; should price fail to break above, we anticipate a move lower to find buying interest between the 1.35300 and 1.34600 zones. A drop into this area appears to be the more probable short‑term path and could set the stage for another push higher.
As previously noted, a decisive break above 1.37500 would renew our expectation for further upside, with the next key target around 1.38400. We'll be monitoring price action closely to see how it unfolds.
We’ll continue to provide updates on the projected path for GBP/USD as price approaches this target.
The longer-term outlook remains bullish, and we expect the rally to continue extending further from the 1.20991 January low towards 1.40000 and 1.417000.
We’ll be keeping you updated throughout the week with how we’re managing our active ideas. Thanks again for all the likes/boosts, comments and follows — we appreciate the support!
All the best for the week ahead. Trade safe.
BluetonaFX
EUR/USD Update: Breakout Potential Above Recent HighsHi Everyone,
Monday played out as expected; a bounce off the highlighted support area appears to have provided enough momentum for a retest of the 1.18000 level. Price could briefly dip below the 1.16680 support; however, our outlook will remain unchanged as long as we hold above the 1.16450 level.
We maintain the view that a decisive break above last week’s high could attract additional buyers, paving the way for a move towards the 1.19290 level and ultimately the 1.20000 level.
We’ll share further updates on the projected path for EUR/USD if price breaks above this key resistance.
The longer-term outlook remains bullish, with expectations for the rally to extend towards the 1.2000 level, provided the price holds above the key support at 1.10649.
We will continue to update you throughout the week with how we’re managing our active ideas and positions. Thanks again for all the likes/boosts, comments and follows — we appreciate the support!
All the best for a good end to the week. Trade safe.
BluetonaFX

USDCHF – Sell Into Resistance in Bearish ChannelTrade Idea
Type: Sell Limit
Entry: 0.7989
Target: 0.7905
Stop Loss: 0.8018
Duration: Intraday
Expires: 09/07/2025 06:00
Technical Overview
The primary trend remains bearish, and price is currently trading within a corrective channel formation, suggesting further downside potential.
Trendline resistance at 0.7995 aligns closely with the entry point of 0.7989, providing a strong technical barrier to cap gains.
The recent weakness in the US dollar supports a continued bearish outlook for USDCHF.
A break below support zones could accelerate a move toward the target at 0.7905.
No significant events are scheduled in the next 24 hours, allowing technical patterns to dominate intraday trading.
Key Technical Levels
Resistance: 0.7991 / 0.8020 / 0.8050
Support: 0.7958 / 0.7922 / 0.7900
Disclosure: I am part of Trade Nation's Influencer program and receive a monthly fee for using their TradingView charts in my analysis.

A Good Trade & An Even Better Trading LessonA good trading idea on the GBPUSD, looking at a potential bearish trend continuation trade using a breakout & pullback technique. But an even better trading lesson on the importance of having rules for how to analyze the market so that you can avoid confusion and/or conflicting signals.
If you have any questions or comments please leave them below.
Akil

SellsWe currently experiencing a short sell as a pullback. We in a buy channel on 1day but on 4 hr we on a flug cautios sells as we await buys on OB

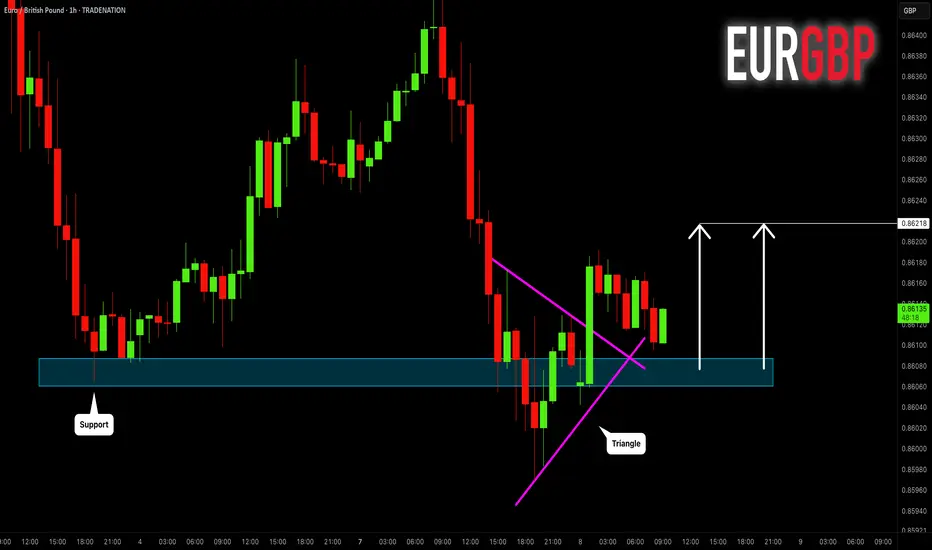
EURGBP: Bullish Move After False Breakout 🇪🇺🇬🇧
EURGBP will likely go up from a key daily/intraday support,
following a bullish breakout of a resistance line
of a bullish triangle on an hourly time frame.
The price may go up to 0.86218 level then.
❤️Please, support my work with like, thank you!❤️
I am part of Trade Nation's Influencer program and receive a monthly fee for using their TradingView charts in my analysis.