GBP/USD - Bearish Channel (07.07.2025)The GBP/USD Pair on the M30 timeframe presents a Potential Selling Opportunity due to a recent Formation of a Bearish Channel Pattern. This suggests a shift in momentum towards the downside in the coming hours.
Possible Short Trade:
Entry: Consider Entering A Short Position around Trendline Of The Pattern.
Target Levels:
1st Support – 1.3545
2nd Support – 1.3485
🎁 Please hit the like button and
🎁 Leave a comment to support for My Post !
Your likes and comments are incredibly motivating and will encourage me to share more analysis with you.
Best Regards, KABHI_TA_TRADING
Thank you.
Disclosure: I am part of Trade Nation's Influencer program and receive a monthly fee for using their TradingView charts in my analysis.
Forex market

GBP/USD💰Symbol: { GBP/USD }
🟩Price: { 1.36990 }
🟥Stop: { 1.37826 }
1️⃣profit: { 1.36536 }
2️⃣profit: { 1.35912 }
3️⃣profit: { 1.35116 }
4️⃣profit: { 1.34483 }
5️⃣profit: { 1.33859 }
📊Check your chart before entering.
🚨Check before use to make sure there is no important news.🚨

EURUSD is moving within the 1.16850 -1.18310 range👀 Possible scenario:
The euro (EUR) dropped 0.6% on July 7 amid rising trade tensions and fading hopes for near-term rate cuts by the Federal Reserve. Market sentiment turned cautious after U.S. President Donald Trump announced new tariffs targeting 14 countries without trade deals, raising concerns over global trade disruption.
Major exporters like Japan and South Korea could face 25% tariffs if deals aren’t reached, while nations aligning with BRICS risk an extra 10% duty. With a quiet economic calendar on July 8, market volatility may ease, though investors remain alert to any trade policy shifts that could spark renewed market reaction.
✅Support and Resistance Levels
Now, the support level is located at 1.16850
Resistance level is located at 1.18310

USD/CHF SWISSY Forex Heist Plan | Thief-Style Buy Setup🔥💰 "Forex Bank Heist: Thief Trading Blueprint for USD/CHF SWISSY 💵💸" 💣🚨
"Steal Pips, Not Dreams. Trade Like a Robber, Think Like a Mastermind." 🕶️💼
🌟 Hello World! Bonjour! Ola! Hallo! Marhaba! 🌟
Welcome, all Money Makers, Market Hustlers & Chart Robbers 🕵️♂️🤑🚁
Let’s gear up for our latest USD/CHF "Swissy" Forex Bank Heist, crafted using our high-level Thief Trading Style—a bold fusion of technical know-how, street-smart price action, and strategic risk maneuvers.
💎 HEIST PLAN SUMMARY
This trade is locked, loaded, and ready to target the vault using a Bullish Breakout / Pullback strategy.
We are eyeing the SWISSY with laser focus, watching closely for price action to retest key support zones, then blast through resistance to secure our escape route.
Let’s not get caught in the police trap zone (aka overbought resistance with fakeouts and bearish ambushes). Keep those trailing stops tight and your loot tighter. 🏃♂️💨
🎯 ENTRY STRATEGY — “The Vault is Open!” 📈
💰 Buy Limit Orders near recent swing low or pullback zone (15M–30M timeframe).
💣 Use DCA (Dollar-Cost Averaging) or Layered Entry strategy to spread risk and improve entry points.
🏹 Entry range: Monitor consolidation for the perfect dip-snatch setup.
🛑 STOP LOSS — “Fallback Safe House” 🚨
📍 Place SL just below recent swing low using 2H timeframe (e.g., 0.79200).
💡 Adjust based on position size, number of entries, and personal risk.
🏴☠️ TARGET ZONE — “The Getaway” 🎯
🎯 TP Level: 0.80700
🚁 Or escape early if momentum weakens—profit is profit.
💹 Scalpers: Ride only the bullish getaway car. Use Trailing SLs to ride and protect gains.
📊 MARKET STATUS — "SWISSY Watchtower" 🕵️
The market is currently neutral, but pressure is building. Expect a bullish breakout if macro & technicals align.
💡 Smart Robbers read the full blueprint:
→ Macro Outlook
→ COT Reports
→ Sentiment Analysis
→ Intermarket Trends
→ Seasonality & Institutional Flow
📰 TRADING ALERT — “Dodge the Sirens” 🚓
🚨 Avoid opening new trades during high-impact news events
💼 Use Trailing Stop-Loss to lock in profits
🧠 Plan your risk and exit BEFORE the bullets (candles) start flying
❤️ BOOST THE CREW! 💥
If this plan helps you pull clean profits, show love and Boost the chart 🔥📈
Your support fuels more strategies and keeps the crew funded 💼💵
Stay sharp, stay ruthless, and always trade like a Thief in the Charts 🎩🕶️
📌 Disclaimer
This strategy is educational and should not be considered investment advice.
Always trade based on your own analysis, risk profile, and market research.
🗓️ Stay tuned for the next Forex Heist Blueprint — we rob charts, not wallets.
📡 Tap follow. Boost the crew. Profit like a pro.

EUR/USD💰Symbol: { EUR/USD }
🟩Price: { 1.17141 }
🟥Stop: { 1.17642 }
1️⃣profit: { 1.17175 }
2️⃣profit: { 1.16865 }
3️⃣profit: { 1.16338 }
📊Check your chart before entering.
🚨Check before use to make sure there is no important news.🚨


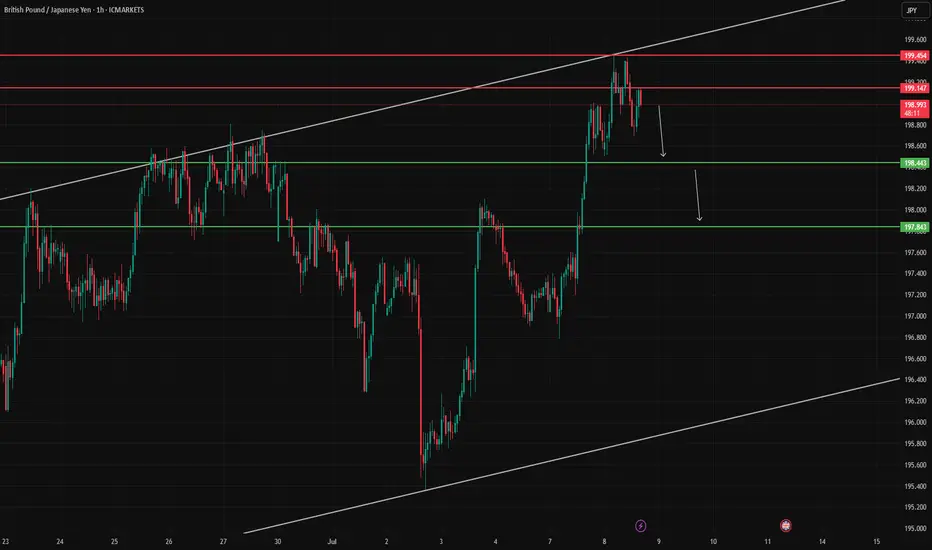
GBPJPY – Rejected from Upper Channel LineGBPJPY has failed to break above the upper channel resistance at 199.454. The pair is now showing signs of bearish rejection.
Targets to watch:
🔻 First: 198.443
🔻 Second: 197.843
Invalidation above 199.454 would negate the setup.
AUDCAD 15min ICT 1:2 bullish trade 1. Daily
• Sell-side liquidity swept below previous low.
• Price bounced from a bullish order block.
• Bias: Bullish, targeting draw on liquidity above.
2. 4H
• Bullish FVG respected.
• Break of structure (BOS) to upside.
• Retracement into OB + FVG → continuation expected.
3. 1H
• Strong displacement candle.
• Price returned to 1H FVG + OB.
• MSS confirms shift in bullish momentum.
15M
• Liquidity sweep + market structure shift.
• Entry on return to OB or FVG.
• Target: Equal highs / 4HR.

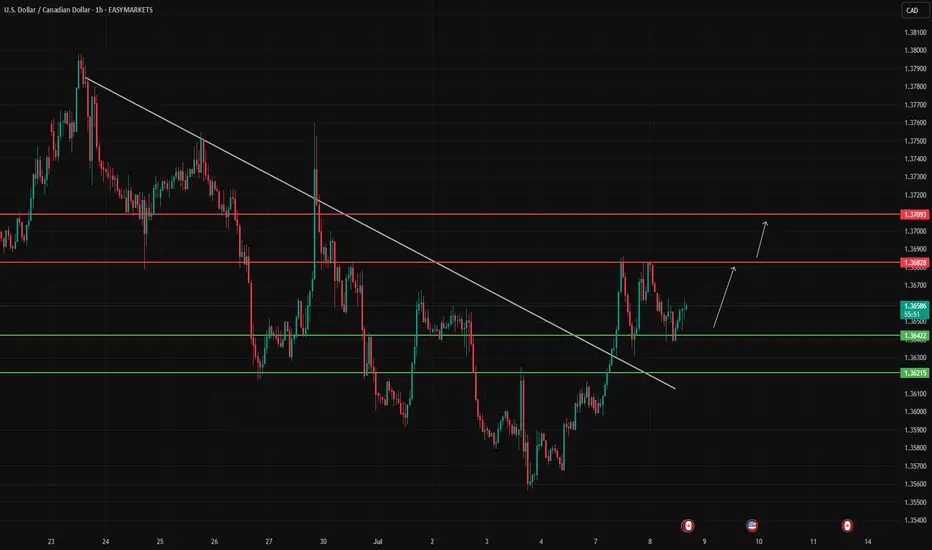
USDCAD AnalysisPrice broke the descending trendline and is forming a base above the 1.36422 support zone. This may signal a bullish continuation targeting 1.36828 and 1.37093.
⚠️ Invalidation: Break below 1.36215 cancels the idea.
This is a market idea, not a signal.
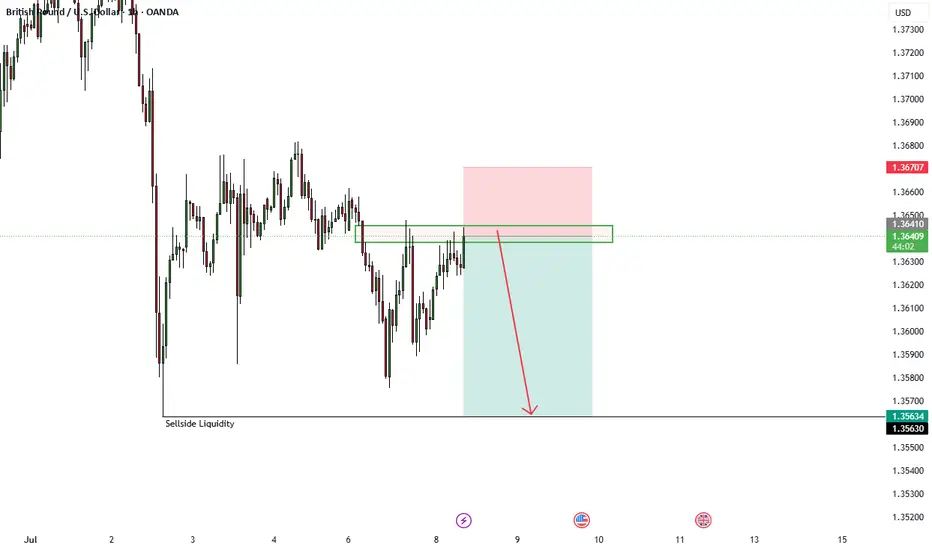
Gbpusd long scalp Same idea as previous post, I want to see a close above 1.35832 and a return into that level would be my entry. 3 targets as depicted.

EUR/USD Slides Below 1.1720 - Dovish Euro Data and Hawkish FedThe euro continued to retreat against the U.S. dollar in Tuesday’s European session, with FOREXCOM:EURUSD falling to 1.17163, pressured by weakening Eurozone fundamentals and renewed U.S. dollar strength.
Technically, the pair has broken below a short-term support zone around 1.1745, marking a clear shift toward bearish momentum. Price action on the 4-hour chart shows a rejection from the 1.1773 resistance zone last week, forming a descending pattern as sellers gained control. Multiple indicators confirm the downward bias.
The MACD (19,39,29) and MACD (12,26,9) are both printing bearish crossovers, with declining histograms indicating increasing downside momentum. Meanwhile, the JoeChalhoub_FXForecaster V1, a custom indicator, shows fading bullish pressure with histogram bars turning pink and gradually weakening. The non-repainting version supports the same trend, reflecting reduced bullish participation.
Adding to the technical signals, the OsMA oscillator remains negative and is steadily declining, underscoring the persistent bearish sentiment.
On the fundamental side, pressure on the euro increased after this morning’s German Industrial Production data missed expectations, further reinforcing concerns about stagnation in Germany. This comes amid ongoing dovish signals from the European Central Bank (ECB), which is widely expected to maintain a cautious stance through Q3.
In contrast, the U.S. dollar is gaining ground as investors respond to Friday’s robust Non-Farm Payrolls (NFP) report and increasingly hawkish rhetoric from Federal Reserve officials. The central bank has hinted at the possibility of additional rate hikes should inflation remain sticky, widening the policy divergence between the Fed and the ECB.
Key support levels for EUR/USD are now seen at 1.16890, followed by a critical zone at 1.16184. A break below these areas could open the door toward the 1.15230 region in the coming sessions. On the upside, resistance lies at 1.17498 and 1.17730.
Outlook:
The path of least resistance for EUR/USD remains lower in the short term. Unless upcoming data reverses the current macro narrative, the euro may remain on the defensive.
Current Trade Status
Opened - 7/7 @ 7:51 PM - 1.17043
Target - 1.16184
SL - 1.18289
Current Trading Account Status - (-0.007%)
This is not trading advice. You should always perform your own research and technical analysis before opening a position.

GBPUSD 1:2.64 R Trade Idea - 1hr Liquidity Sweep - ICTBeautiful 1:2.64 Trade Idea for a short on GPBUSD, aiming for the 1hr low to take out the 1hr SS Liquidity

GBPCAD - BEARISH MOVE !Hello Traders !
On the 1h time frame,
The GBPCAD price broke the higher low (change of character).
So, I expect a bearish move📉
______________
TARGET: 1.84580🎯

GBPUSD Sell analysis/ideaThis analysis is based on the daily and 4-hour timeframes and executed using reversal trading and trend formation. Complete explanation in the video!

AUDNZD; Heikin Ashi Trade IdeaOANDA:AUDNZD
In this video, I’ll be sharing my analysis of AUDNZD, using FXAN's proprietary algo indicators with my unique Heikin Ashi strategy. I’ll walk you through the reasoning behind my trade setup and highlight key areas where I’m anticipating potential opportunities.
I’m always happy to receive any feedback.
Like, share and comment! ❤️
Thank you for watching my videos! 🙏

Gbpusd long scalpWe've taken some sellside liquidity. I am expecting price revert back into the range. Simulated trade #6 already triggered at 1.35792 any return into this level would be a good entry or near this level allowing 3 pips.

NZDUSD Pullback in Play – Head & Shoulders Signals More DownsideNZDUSD ( OANDA:NZDUSD ) is currently trading near the Resistance zone($0.612-$0.605) and has also managed to break the Support zone($0.604-$0.602) . We consider the Support zone as the neckline of the Head and Shoulders Pattern .
In terms of classic technical analysis , NZDUSD has managed to form a Head and Shoulders Pattern .
I expect NZDUSD to decline towards the Support zone($0.5968-$0.5946) after completing the pullback .
Note: Stop Loss(SL): $0.6062
Please respect each other's ideas and express them politely if you agree or disagree.
New Zealand Dollar/ U.S. Dollar Analyze (NZDUSD), 1-hour time frame.
Be sure to follow the updated ideas.
Do not forget to put a Stop loss for your positions (For every position you want to open).
Please follow your strategy and updates; this is just my Idea, and I will gladly see your ideas in this post.
Please do not forget the ✅' like '✅ button 🙏😊 & Share it with your friends; thanks, and Trade safe.

EURUSD Sell analysis/ideaThis trade is based on the daily and 4-hour timeframes and executed based on reversal trading and trend formation. Complete explanation in the video!

GBP/USD : Get Ready for Another Fall!By analyzing the GBP/USD chart on the 4-hour timeframe, we can see that after reaching 1.36800—filling the targeted FVG as expected—the price faced selling pressure once again and has since dropped to around 1.35690.
The first target at 1.35630 is now within reach. After collecting liquidity below this level and a possible short-term bounce, we can expect another bearish continuation on GBPUSD.
Key supply zones to watch are 1.36180–1.36465 and 1.36940.
Key demand zones are located at 1.35630, 1.35100, and 1.34880.
THE MAIN ANALYSIS :

GBP/USD Climbs as Trump Targets 14 NationsGBP/USD edged higher to around 1.3630 during Tuesday’s Asian session, posting a modest recovery after two straight days of losses. The British Pound found support as the US Dollar weakened in response to heightened market caution following President Donald Trump’s announcement of new tariff rates targeting 14 countries that have not yet finalized trade agreements with the US.
The Trump administration introduced a 25% tariff on imports from Japan and South Korea, warning of further escalation if these countries retaliate. Other nations affected include Malaysia, Kazakhstan, and Tunisia, each facing a 25% tariff, while South Africa will face a 30% tariff. Tariffs on Laos and Myanmar will rise to 40%, Indonesia faces 32%, Bangladesh 35%, and both Thailand and Cambodia will see tariffs of 36%.
Additionally, Trump signed an executive order delaying the enforcement of these new tariffs until August 1, allowing more time for negotiations, according to Bloomberg.
On social media, Trump issued a firm warning that any country aligning with the anti-American stance of the BRICS bloc would face an extra 10% tariff, stating unequivocally: “There will be no exceptions to this policy.”
Resistance is at 1.3640, while support holds at 1.3500.

EUR/USD at 1.1750 as EU Pushes Trade DealEUR/USD trades around 1.1745 in Tuesday’s Asian session, supported by strong Eurozone retail sales for May. The Euro benefits as the EU aims to finalize a preliminary trade deal with the US this week, seeking to maintain a 10% tariff beyond the August 1 deadline while negotiations continue. The proposed agreement would keep the 10% base tariff but exempt sensitive sectors like aviation and alcohol, which helps lift market sentiment toward the Euro.
Eurostat data showed retail sales rose 1.8% year-on-year in May, beating expectations of 1.2% but slowing from April’s 2.7%. Monthly sales fell 0.7%, matching forecasts.
Resistance for the pair is at 1.1830, while support is at 1.1730.

EURUSD 15/3 Pullback LongThis is the follow up idea. The 1-hr chart already show bullish. Will be waiting for the pullback probably liquidation and long.
