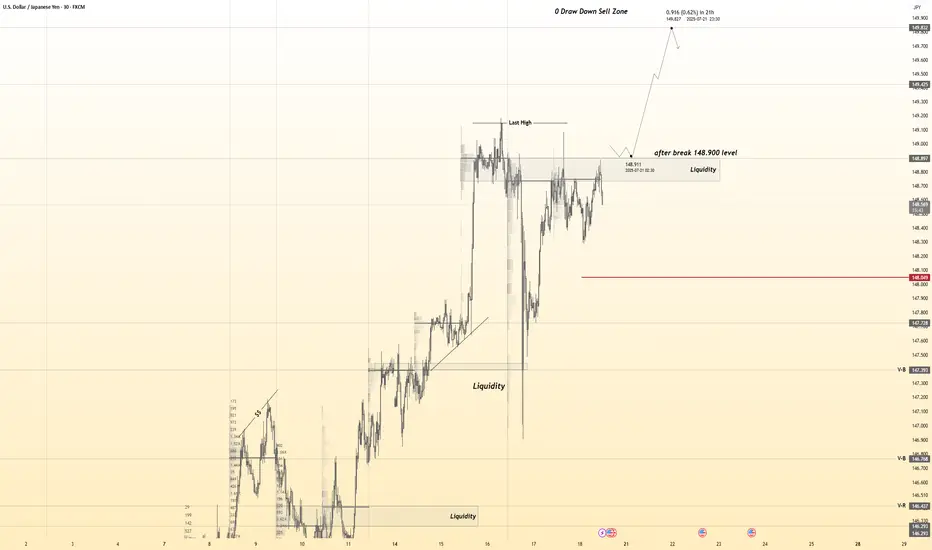
USDJPY 30Min Engaged ( Bullish After Breakout Entry Detected )————-
➕ Objective: Precision Volume Execution
Time Frame: 30-Minute Warfare
Entry Protocol: Only after volume-verified breakout
🩸 Bullish After Break : 148.900
➗ Hanzo Protocol: Volume-Tiered Entry Authority
➕ Zone Activated: Dynamic market pressure detected.
The level isn’t just price — it’s a memory of where they moved size.
Volume is rising beneath the surface — not noise, but preparation.
🔥 Tactical Note:
We wait for the energy signature — when volume betrays intention.
The trap gets set. The weak follow. We execute.
Forex market
USDCAD SELLUSD/CAD retakes 1.3700, eyes multi-week top amid a broadly firmer USD
The USD/CAD pair attracts some dip-buying during the Asian session on Thursday and climbs further beyond the 1.3700 mark amid a broadly firmer US Dollar. Spot prices have now reversed the previous day's retracement slide from a three-week high and seem poised to appreciate further
The year will be politically marked by Trump’s return to the White House. A Republican government is seen as positive for financial markets, but Trump’s pledge to cut taxes and impose tariffs on foreign goods and services may introduce uncertainty to both the political and economic landscape.
Canada’s political crisis peaked in late 2024 with a no-confidence vote against Prime Minister Justin Trudeau, leading to snap elections and a weakened Liberal minority government. Policy uncertainty and economic challenges dominate 2025’s outlook, raising concerns over market stability and investor confidence.
The BoC is set to continue easing interest rates through 2025, at least at a faster pace than the Fed is expected to, which could apply pressure on CAD’s already-rising rate differentia
TP 1 1.37214
TP 2 1.37095
TP 3 1.36987
RESISTANCE 1.37413

GBPCAD Bearish Continuation Patterns and ConfirmationsA broken daily demand zone, a resistance trendline showing direction to the downside, bearish continuation patterns (rejection patterns) and consistent H4 supply zones all indicate that this market is bearish and if the current H4 supply holds then use bearish confirmations on LTFs to short to the next support or demand zone.

EURUSDEUR/USD shows bullish COT (net longs), but USD’s individual COT is very strong (net longs), which usually means USD strength and EUR/USD bearish pressure.
COT on the pair can lag or reflect speculative flows, while USD’s strength often has bigger impact.

EURUSDShort-Term Bullish Outlook for EUR/USD
1. DXY Bearish Momentum
As the dollar index (DXY) weakens due to rate cut expectations and political instability, EUR/USD benefits directly (EUR makes up ~58% of DXY).
2. ECB More Hawkish Than Fed (for Now)
The European Central Bank has taken a more data-dependent and cautious tone, holding off on aggressive rate cuts.
This divergence boosts the euro relative to the dollar.

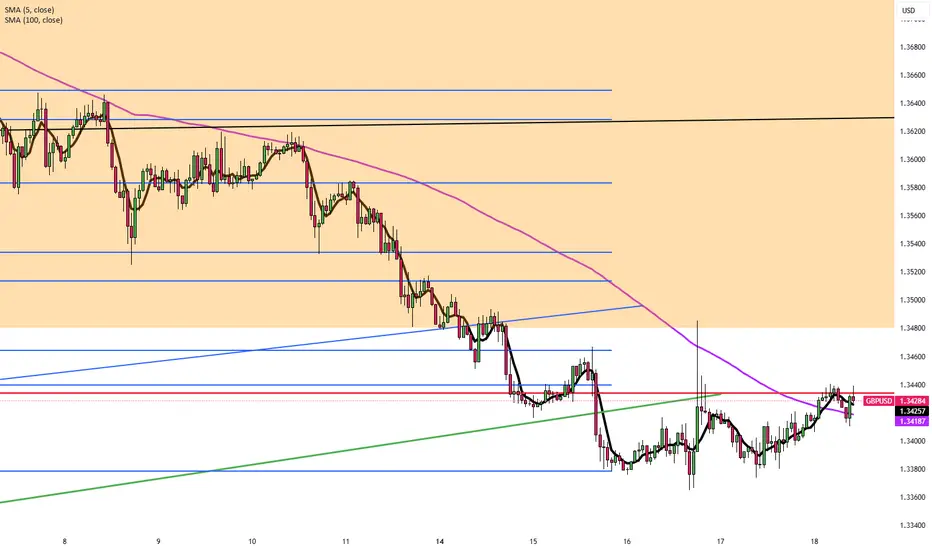
GBPUSD BUYGBP/USD rises to near 1.3450 due to improved market sentiment, UoM Consumer Sentiment eyed
GBP/USD gains ground after registering small losses in the previous session, trading around 1.3440 during the Asian hours on Friday. The pair appreciates as the US Dollar edges lower due to dovish remarks from the Federal Reserve officials.
The Relative Strength Index (RSI) indicator on the 4-hour chart stays below 40, reflecting bearish conditions for GBP/USD. The Fibonacci 61.8% retracement level of the latest uptrend seems to have formed a pivot level at 1.3400.
In case GBP/USD fails to stabilize above 1.3400, technical sellers could remain interested. In this scenario, 1.3300 (Fibonacci 78.6% retracement) and 1.3275 (100-day Simple Moving Average) could be seen as next support levels. On the upside, resistance levels could be spotted at 1.3470 (Fibonacci 50% retracement), 1.3500 (static level, round level) and 1.3540 (Fibonacci 38.2% retracement).
TP 1 1.34403
TP 2 1.34859
TP 3 1.35407
RESISTANCE 1.33627

EURUSD long Lion SETUPhello everyone
the price is in a strong demand area
as liquidity has been withdrawn
and the fair value gap has been filled
but we are waiting for formation pattern on a smaller frame in order to enter an upward wave.
we also have resistance area
so in short. I expect an upside go upppp
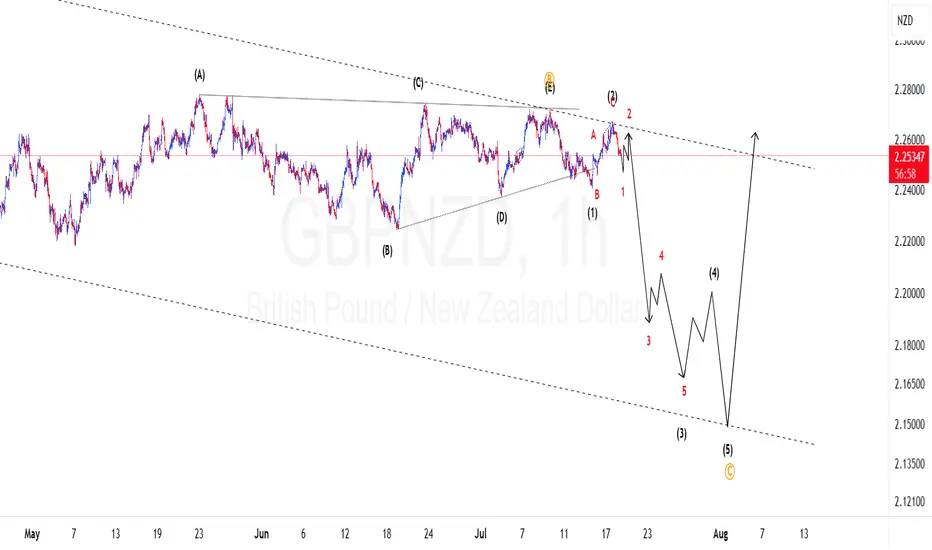
GBPNZD Elliotwaves update: Are Bears still on control?We have been on this in the past two weeks and now we can see clear signs of bears controlling the price. We had a triangle correction completed and made an impulsive wave to the downside which confirmed our bias. Now are are on the first wave of wave 3 and we should anticipate momentum to the downside to increase. To take advantage of the drop one should find areas where price might find resistance and other confluences like Fibonacci to take a trade.
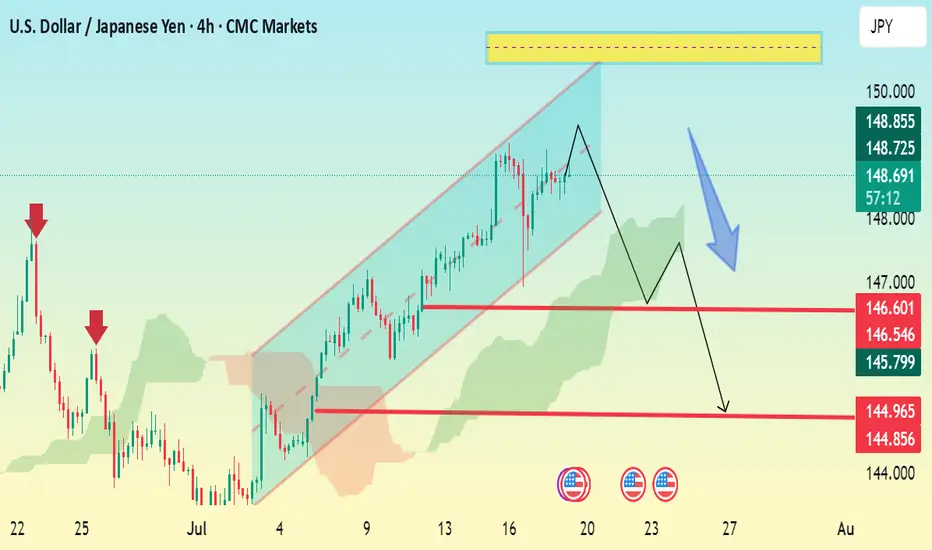
USD/JPY 4H Bearish Setup – Channel Breakdown ExpectedThe chart shows USD/JPY in a rising channel with a projected bearish reversal setup forming. Here’s a breakdown:
🔹 Current Price: 148.83
🔹 Pattern Observed:
The pair is trading inside a rising channel.
A potential double top or lower high formation near the top of the channel suggests weakening bullish momentum.
Price may break down through the channel support.
🔻 Bearish Scenario (as shown by the blue arrow):
1. Initial drop expected to the support zone around:
146.60 – 146.54
Minor consolidation possible at this level.
2. If broken, next target zone is:
144.96 – 144.85
🔑 Key Levels:
Resistance Zone: 149.80–150.00 (highlighted in yellow)
Support Levels:
First: 146.60
Second: 144.96
✅ Bearish Confirmation:
A 4H candle close below 146.60 would confirm the bearish move.
Watch Ichimoku cloud — if price breaks and closes below the cloud, it will strengthen the downtrend.
Yen Rebounds as Japan Inflation Stays ElevatedThe yen rose to around 148 per dollar on Friday, recovering from the previous day’s decline as markets assessed fresh inflation figures. Japan’s inflation eased slightly to 3.3% in June from 3.5% in May but remained above the Bank of Japan’s 2% target for the 39th straight month. This persistent overshoot has intensified speculation about possible policy tightening by the central bank.
Resistance is at 149.30, with major support at 147.50.
Pound Pressured by Firm Dollar and UK Data ReviewThe British pound held near $1.339 on Friday, its lowest level in eight weeks, as the U.S. dollar strengthened. The dollar reached a three-week high after President Trump confirmed he would not remove Fed Chair Jerome Powell, despite continued criticism of the Fed’s careful stance on rate cuts. In the UK, markets are closely reviewing recent employment and inflation data. While the labor market shows signs of weakness, updated tax records suggest the slowdown may not be as severe as previously thought.
Resistance is at 1.3535, while support holds at 1.3380.

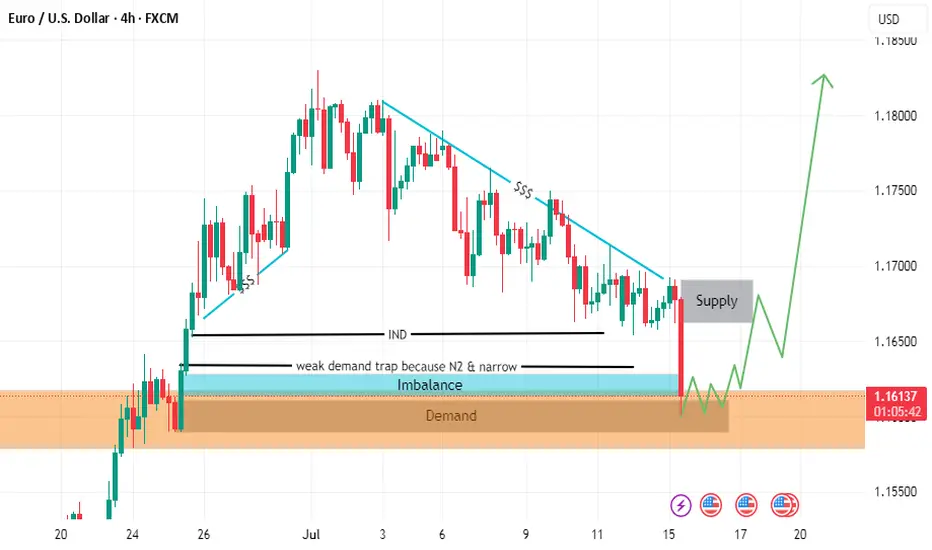
Hellena | EUR/USD (4H): LONG to the resistance area 1.18280.The previous idea was aimed at updating the maximum of 1.18280, but the correction turned out to be too deep.
Therefore, I am proposing a new idea. I believe that wave “3” has formed, and now we should see the completion of the correction in wave “4,” after which I expect to see an upward movement in wave “5.” My target is at least the high of wave “3” — the resistance area of 1.18280.
As for the correction, I think it could reach the 1.15459 area, but I recommend working with pending orders.
Manage your capital correctly and competently! Only enter trades based on reliable patterns!

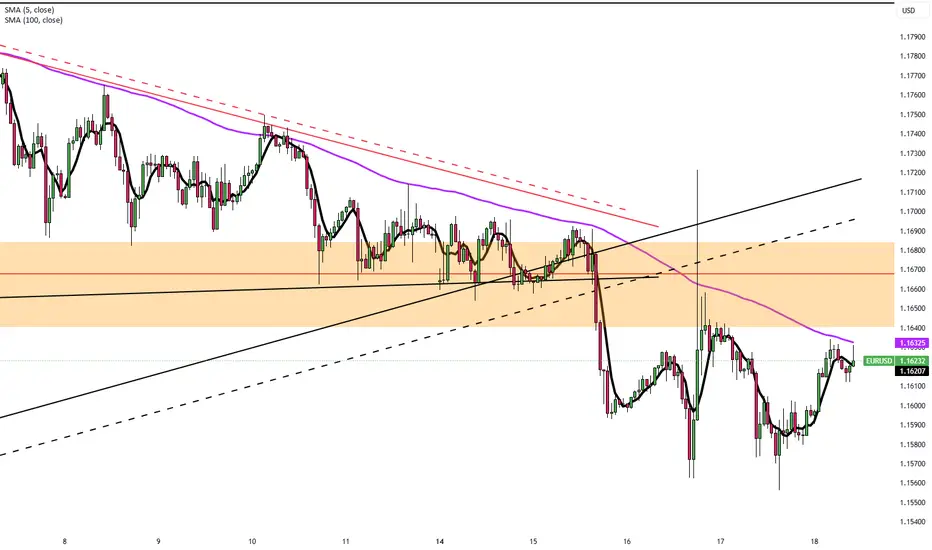
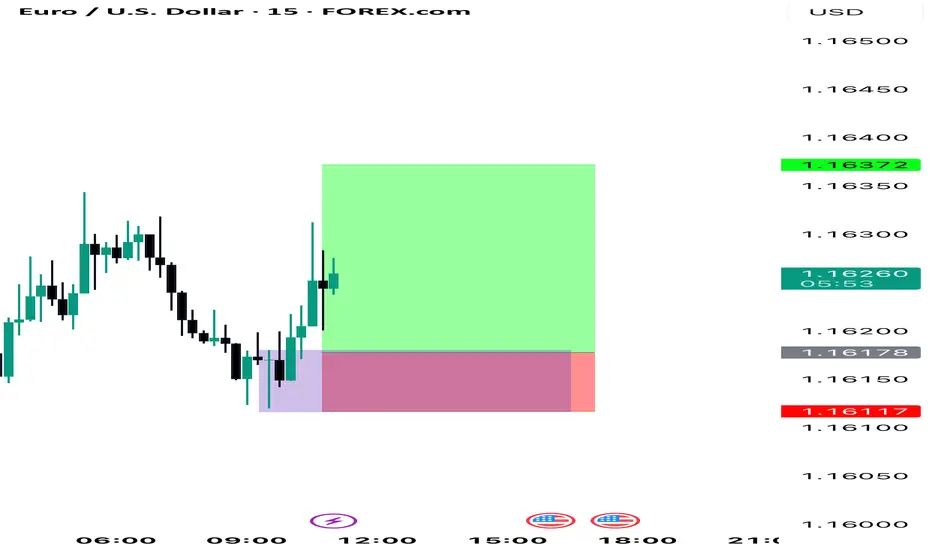
EUR/USD Drops to $1.16 Amid Strong U.S. DataThe euro declined to $1.16 on Thursday, reaching its lowest level in almost a month as the U.S. dollar regained strength. The dollar’s rise followed solid U.S. inflation data and President Trump’s comments suggesting he will keep Fed Chair Jerome Powell in place, reducing expectations for near-term Fed rate cuts. Meanwhile, markets continued to monitor U.S.-EU trade negotiations ahead of the August 1 deadline.
Resistance for the pair is at 1.1670, while support is at 1.1580.
GBPUSD – Long Setup from 15M OBIdea:
- Market structure is bullish on H1
- CHoCH + OB on 15M confirmed entry
TP: 3R | SL: Below 15M OB | Risk: 1%
#XAUUSD #ICT #OrderBlock #FundedTrader #TradingStrategy
EURAUD → Correction for accumulation before growthFX:EURAUD reaches the zone of interest during a correction and forms a false breakdown of local support. Traders can switch to the buy side to support the trend.
Against the backdrop of a global bullish trend and a correction in the euro, the currency pair is following this movement, the essence of which is to consolidate funds for further growth. Liquidation is forming in relation to the liquidity zones of 1.785, 1.78, and 1.773, and the market imbalance is changing. The current movement is bringing the price to the zone of interest: the liquidity area of 1.773 and the order block. The capture of liquidity relative to 1.773 leads to the formation of a false breakdown and a pullback to the area of interest for buyers. Accordingly, price consolidation above 1.776 and 0.7 Fibonacci could support the main trend and allow the price to strengthen.
Support levels: 1.776, 1.773, 1.763
Resistance levels: 1.786, 1.795
The euro clearly demonstrates an upward trend, the structure of which has not been broken during the correction. Correction is a perfectly healthy movement within a trend, allowing positions to be opened at more favorable prices. If the bulls hold their defense above 1.776, momentum towards the specified targets may form.
Best regards, R. Linda!

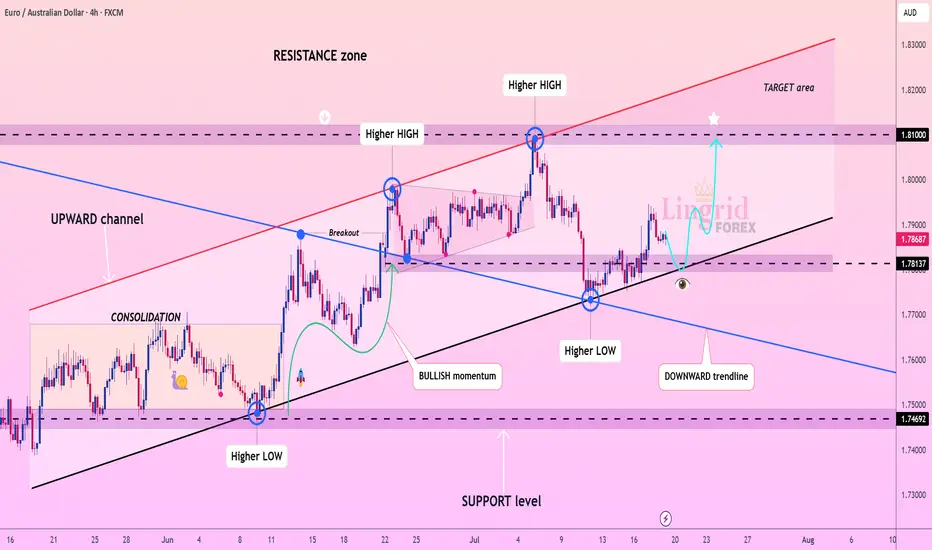
Lingrid | EURAUD Potential Retest of the Key LevelFX:EURAUD is holding firmly above the rising trendline after a successful retest of the support zone at 1.7813. The price has formed consecutive higher lows and remains within a well-defined upward channel, indicating continued bullish structure. A small corrective pullback is expected before a renewed rally toward the 1.8100 resistance level. Momentum is building for a potential breakout continuation toward the upper boundary of the channel.
📉 Key Levels
Buy trigger: Bounce from 1.7813 and reclaim of 1.7900
Buy zone: 1.7820–1.7880
Target: 1.8100
Invalidation: Breakdown below 1.7780 and support trendline
💡 Risks
Failure to hold above the current higher low
False breakout followed by bearish rejection from the mid-range
Weak momentum due to macroeconomic uncertainty
If this idea resonates with you or you have your own opinion, traders, hit the comments. I’m excited to read your thoughts!
EURUSD – Long Setup from 15M OB
Idea:
- Market structure is bullish on H1
- CHoCH + OB on 15M confirmed entry
TP: 3R | SL: Below 15M OB | Risk: 1%
#XAUUSD #ICT #OrderBlock #FundedTrader #TradingStrategy
Nzdusd sell to buy narrativeNzdusd has been responding positively after CPi data and we can see price reacting to close imbalance caused by Trump-powell power tussle.
We expect more bullish move in the future.

USDJPY Bullish breakout in Daily TimeFrame
USDJPY weekly and daily looks very bullish, it recently broke the resistance in daily and weekly candles.

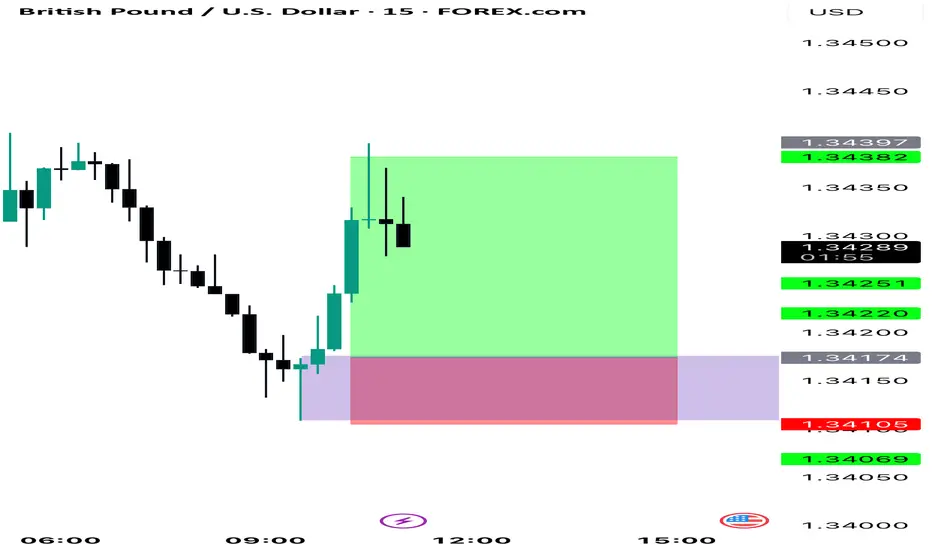
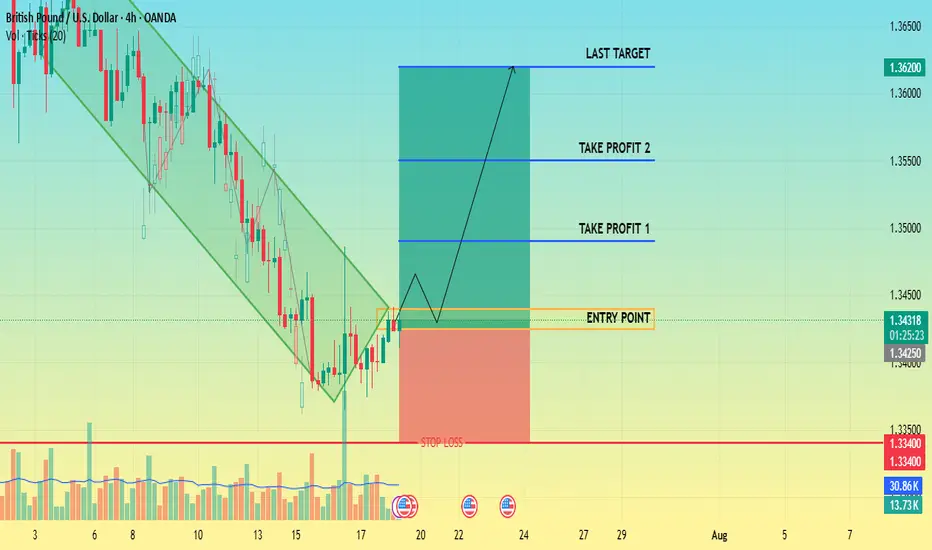
CHECK GBPUSD SIGNAL READ CAPTAIN📍 Trade Setup Overview
Trade Direction: Short (buy)
Entry Point: Around 1.34400 1.34250
Stop Loss: Around 1.33400
🎯 Target Levels
Take Profit 1:
1.34900
Take Profit 2:
1.35500
Last Target:
1.36200
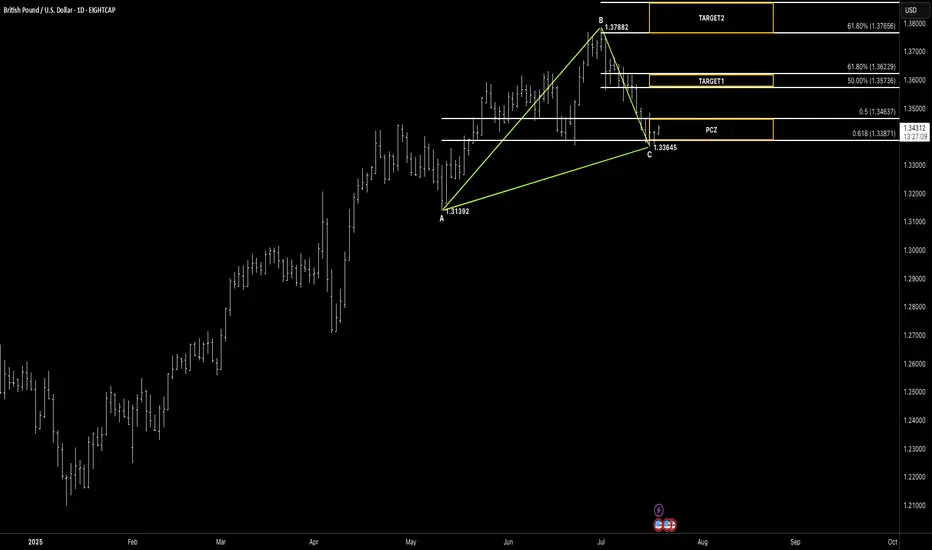
GBPUSD / British Pound – US Dollar (1D) – ABC Bullish Pattern (R
Hello awesome traders! 👋
Hope you’ve collected some good pips this week — I’m closing out with one more chart for your weekend review. Let’s take a look at this Daily ABC Bullish structure on Cable with precision symmetry and a strong technical reaction.
📌 Pattern Overview
🔹 A beautifully measured ABC Bullish corrective wave unfolding:
• A = 1.31392
• B = 1.37882
• C = 1.33645
🔹 Price has respected the PCZ (Potential Completion Zone) — aligned right on the 61.8% retracement of the AB leg
🔹 From the PCZ, price has started a reaction leg and is now working toward fib-based targets:
📍 TARGET 1 Zone
• 50% = 1.35736
• 61.8% = 1.36229
📍 TARGET 2 Zone
• 61.8% = 1.37566
• 78.6% = 1.38746
📈 What We’re Watching
✅ Bullish reaction off 1.336x zone confirms structure
✅ Price moving back toward mid-range fib levels
✅ We’re currently between PCZ and the first resistance shelf at 1.3500
🔸 Momentum confirmation needed above 1.3550 to lock in the push toward TP1
🧠 Key Concepts
✅ Textbook ABC symmetry
✅ PCZ anchored by 61.8% fib and prior structure
✅ Clear fib ladder: 50/61.8 → 61.8/78.6
✅ Swing low invalidation: break below 1.33645
🗝 Final Thoughts
It’s the kind of pattern that builds conviction without noise. Let price continue to unfold. We'll be collecting on TP1 first and reassessing next week for potential rotation toward TP2.
“Patterns don’t predict – they prepare. Breakouts confirm the plan.”
—Constantino DeLa. @tradechartpatternslikethepros.
Fakeout or Pullback?The only signal that makes me lean more toward a fakeout rather than a clean pullback is the distance between the 100 and 200 moving averages and the current price.
At the moment, price is struggling around the 50 MA, and there’s a clear gap between it and the longer-term averages.
We need to give the market some time and see which direction gains confirmation. Until then, we stay patient and watch for clearer signals.

