EURUSD ALERTPrice starts ranging
No clear breakout yet — we're staying patient and waiting for a cleaner entry signal.
#EURUSD #Forex #PriceAction #Trading
Forex market

Trading balanceTrading balance The price of the asset has rebounded from the balance zone. With the prospect of growth into the resistance zone.
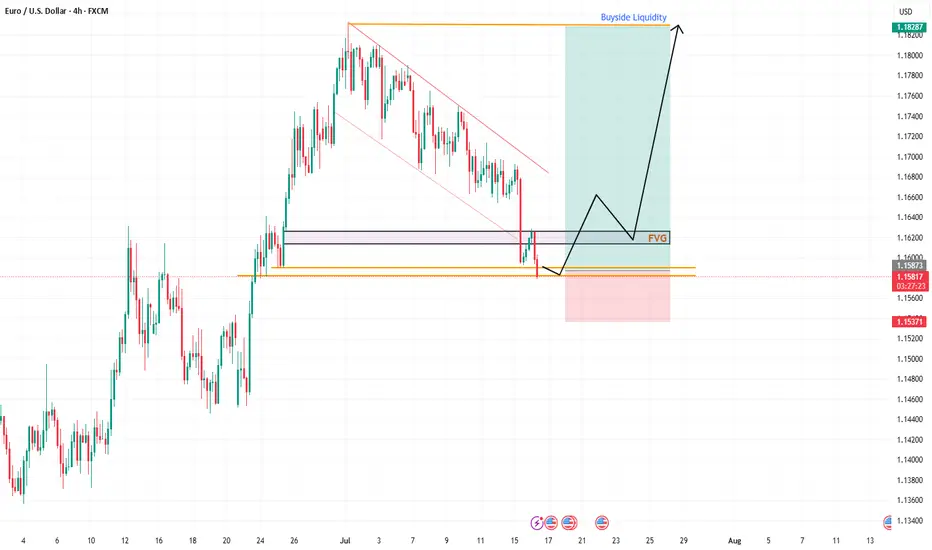
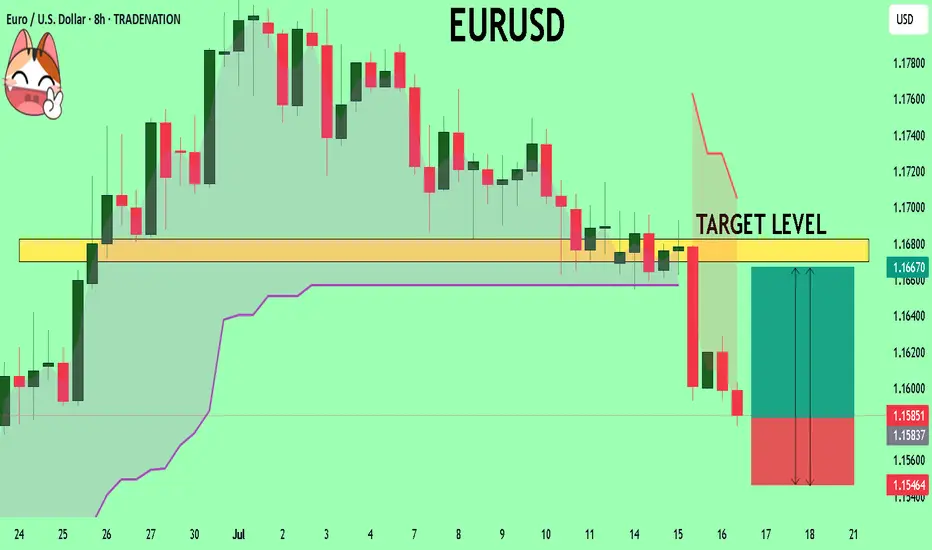
EU's Wild Drop: A Sneaky Trap or Reversal Time?Hey Fellow Traders! 😎
What a ride yesterday, right? The EUR/USD took a massive plunge, smashing through the descending channel like a wrecking ball and sweeping up all that liquidity. 💥 But hold up—was that just a clever market manipulation to shake out the bulls? I think so! 🧠
Right now, the price is chilling in a Daily Fair Value Gap (FVG), and I’m expecting some serious action here. This could be the perfect setup for a reversal! The market makers pulled a fast one—tricking bullish traders into flipping bearish after that dramatic drop. But guess what? That’s the trap! 🕸️ Don’t fall for it.
I’m eyeing a long entry right at this level. Here’s the plan:
Entry: Right now—let’s catch this wave! 🌊
Stop Loss: Set it tight around 1.15360 to keep risk in check.
Take Profit: Aiming for those juicy highs (check the chart I shared in my last post for the exact levels). 📈
This setup is screaming opportunity, so let’s talk about it! 💬 What’s your take—are we reversing or is the market still playing games? Drop your thoughts below, smash that Like button if you’re with me, and Follow for more trade ideas! 🚀 Let’s keep the community buzzing. 🐝
#Trading #EURUSD #MarketAnalysis #ReversalSetup
EURUSD: The Market Is Looking Down! Short!
My dear friends,
Today we will analyse EURUSD together☺️
The in-trend continuation seems likely as the current long-term trend appears to be strong, and price is holding below a key level of 1.15850 So a bearish continuation seems plausible, targeting the next low. We should enter on confirmation, and place a stop-loss beyond the recent swing level.
❤️Sending you lots of Love and Hugs❤️

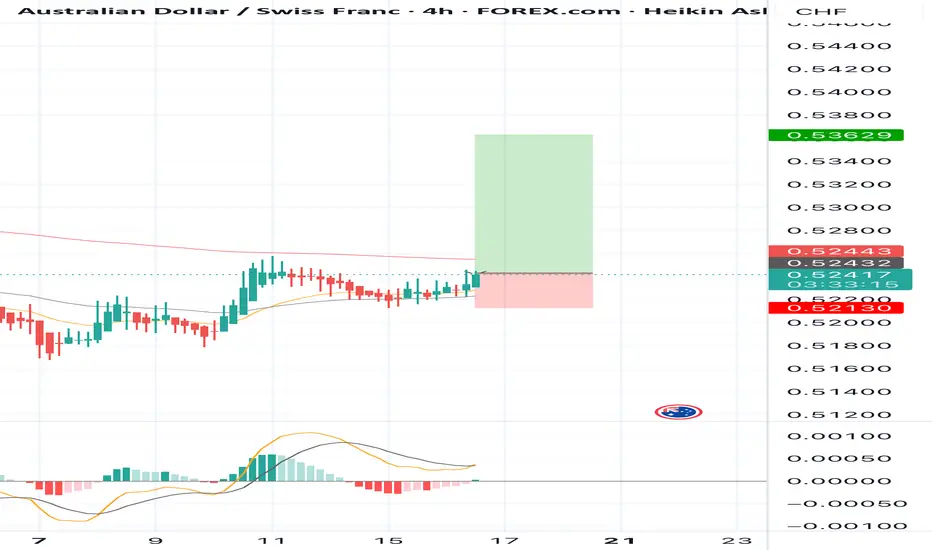
BUY AUDCHF for divergence bearish trend reversal STOP LOSS: 0.5BUY AUDCHF for divergence bearish trend reversal STOP LOSS: 0.52130
Regular Bullish Divergence
In case of Regular Bullish Divergence:
* The Indicator shows Higher Lows
* Actual Market Price shows Lower Lows
We can see a strong divergence on the MACD already and There is a strong trend reversal on the daily time frame chart.....
The daily time frame is showing strength of trend reversal from this strong level of Support so we are looking for the trend reversal and correction push from here.....
TAKE PROFIT : take profit will be when the trend comes to an end, feel from to send me a direct DM if you have any question about take profit or anything...
Remember to risk only what you are comfortable with... trading with the trend, patient and good risk management is the key to success here
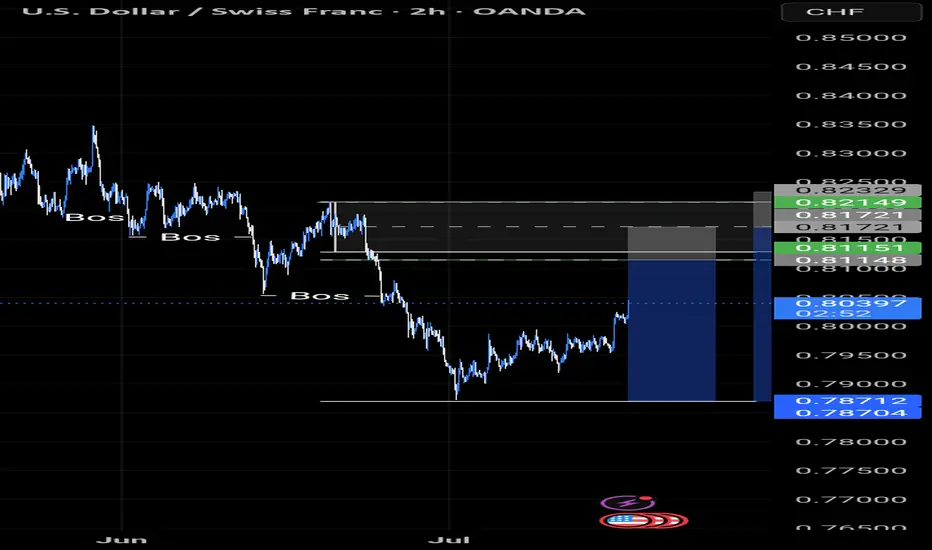
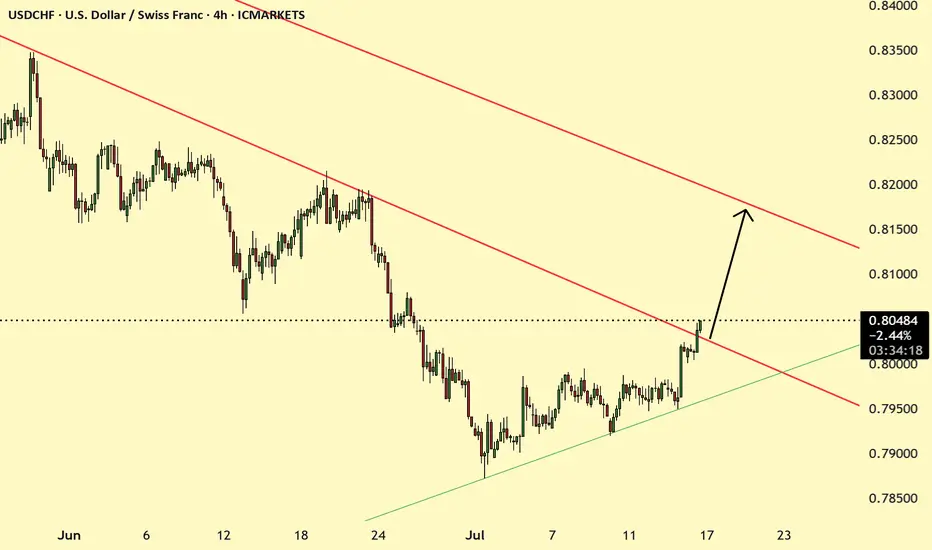
USDCHF break of Resistance USDCHF has recently brokend the resistance trendline is likely to go up. After the yesterday news the bullish movement of USD will continue
EURUSD My Opinion! BUY!
My dear friends,
Please, find my technical outlook for EURUSD below:
The price is coiling around a solid key level - 1.1584
Bias - Bullish
Technical Indicators: Pivot Points Low anticipates a potential price reversal.
Super trend shows a clear buy, giving a perfect indicators' convergence.
Goal - 1.1670
Safe Stop Loss - 1.1546
About Used Indicators:
The pivot point itself is simply the average of the high, low and closing prices from the previous trading day.
Disclosure: I am part of Trade Nation's Influencer program and receive a monthly fee for using their TradingView charts in my analysis.
———————————
WISH YOU ALL LUCK
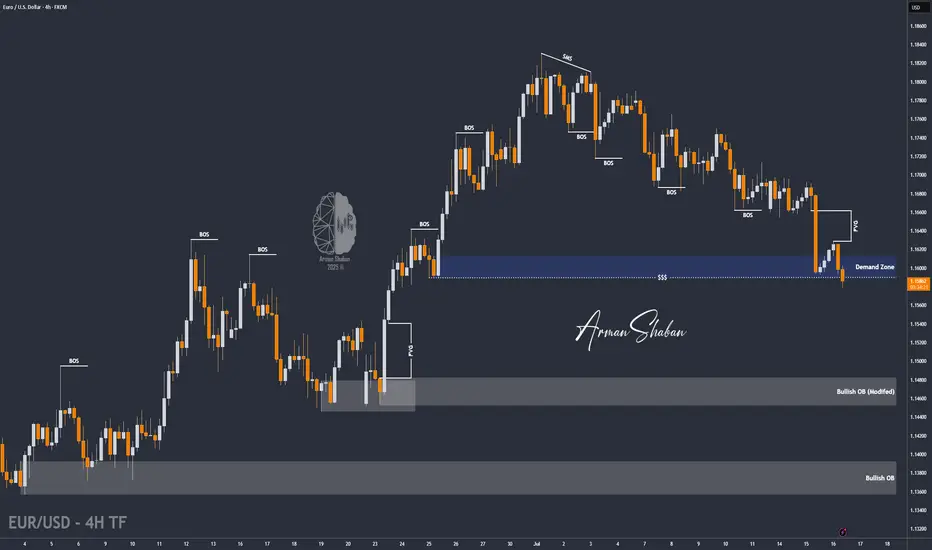
EUR/USD : Another Fall Ahead ? (READ THE CAPTION)By analyzing the EURUSD chart on the 4-hour timeframe, we can see that the price is currently breaking through the 1.16–1.158 zone. If it manages to hold below 1.159, we can expect further downside movement. The next targets for EURUSD are 1.15580, 1.154, and 1.148.
Please support me with your likes and comments to motivate me to share more analysis with you and share your opinion about the possible trend of this chart with me !
Best Regards , Arman Shaban
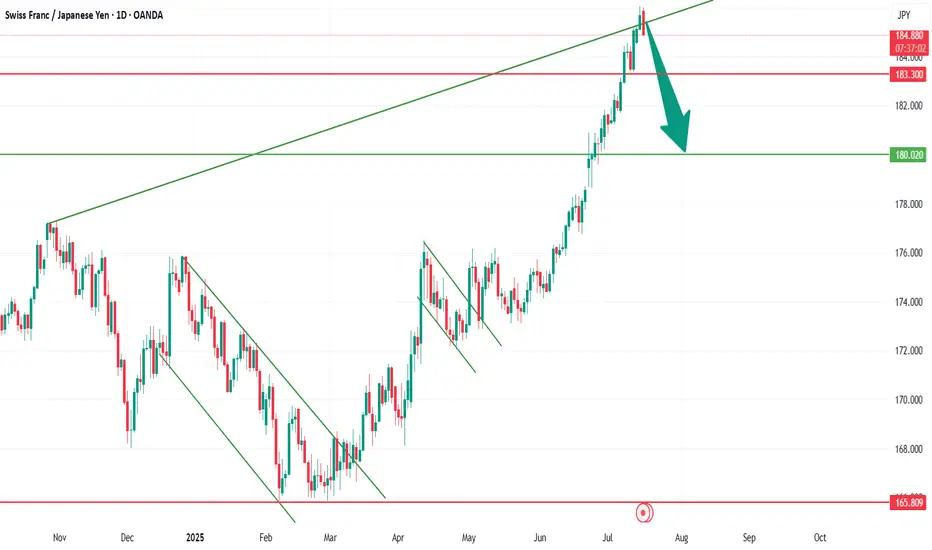
CHF/JPY: Poised for a Short-Term CorrectionThe CHF/JPY pair has experienced an impressive and sustained bullish run, gaining approximately 1000 pips in under two months. Such rapid and significant upward movements often lead to a healthy market correction as buyers exhaust their momentum and profit-taking ensues.
Based on this strong bullish run, and likely factoring in overbought conditions that often follow such moves, the pair appears ready for a short-term correction. The level of 180.000 stands out as a critical psychological and technical target for this potential pullback.
Considering the exhaustion of the recent rally, a short-term sell trade targeting 180.000 appears to be a viable strategy. My sell trade is currently on 10 pips gain and its not too late to join the rally.
Stay safe!
Australian job numbers and AUDWe are keeping a close eye on the Australian job numbers tonight. If you are trading AUD, then that's the data to watch. Let's dig in.
FX_IDC:AUDUSD
FX_IDC:AUDJPY
FX_IDC:AUDNZD
Let us know what you think in the comments below.
Thank you.
75.2% of retail investor accounts lose money when trading CFDs with this provider. You should consider whether you understand how CFDs work and whether you can afford to take the high risk of losing your money. Past performance is not necessarily indicative of future results. The value of investments may fall as well as rise and the investor may not get back the amount initially invested. This content is not intended for nor applicable to residents of the UK. Cryptocurrency CFDs and spread bets are restricted in the UK for all retail clients.

7.16 EUR/USD LIVE TRADE UPDATE DAY 3This market made a very nice down candle yesterday and then pulled back a little, currently it looks to be heading down again. We are looking for this market to make new lows on the current down momentum.

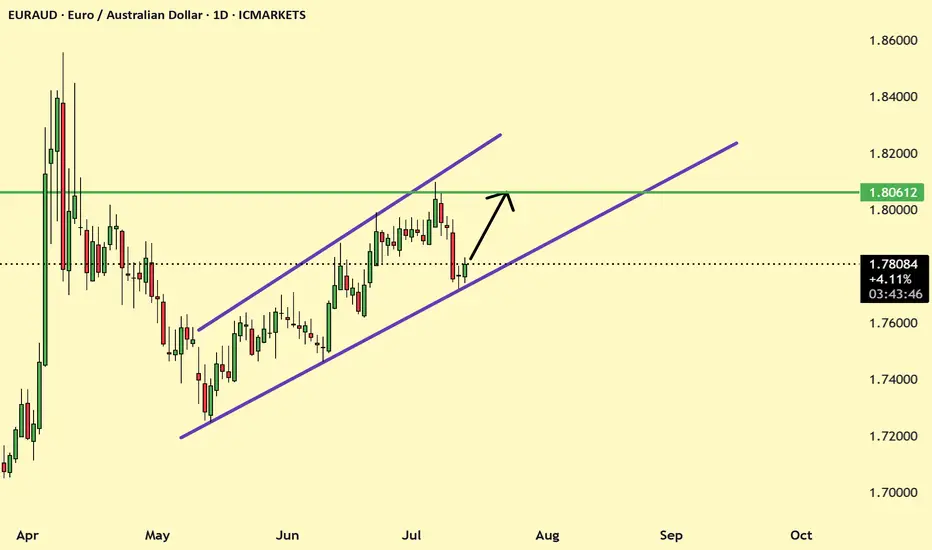
7.16 EUR/AUD LIVE TRADE UPDATE DAY 2We took this trade on Tuesday morning and we are now waiting for price action to move down. It tested the Support and resistance levels and got rejected which is a good sign that it should be heading back down.

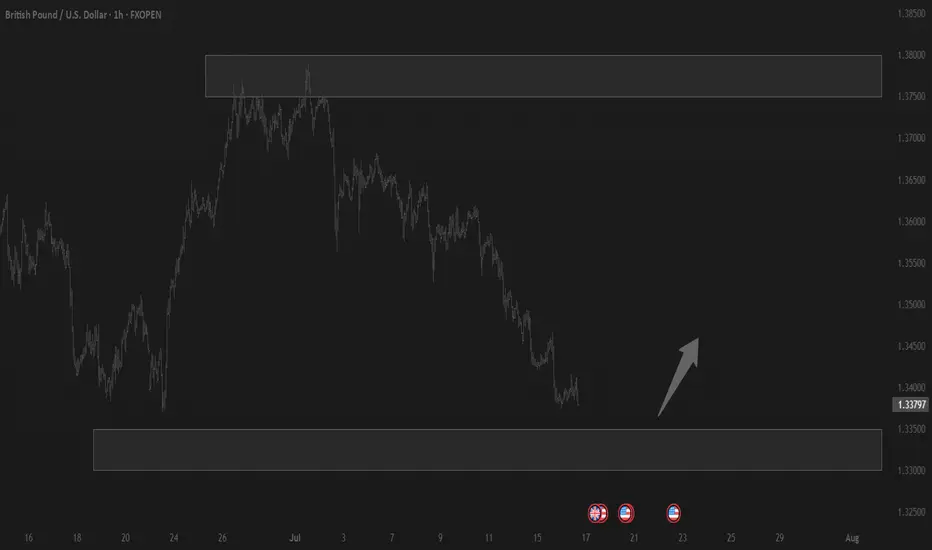
EURAUD at Trendline support EURAUD is Trading in Channel pattern and looks like the price has rebound form the recent trendline support and is likely to go up.
CADCHF possible Bearish Scenario The CADCHf is bearish mode and recently forming a symmetrical triangle like pattern and Within this also forming another sub triangle. let us see how it behaves to these trendlines.

Signal-to-Noise Ratio: The Most Misunderstood Truth in Trading█ Signal-to-Noise Ratio: The Most Misunderstood Truth in Quant Trading
Most traders obsess over indicators, signals, models, and strategies.
But few ask the one question that defines whether any of it actually works:
❝ How strong is the signal — compared to the noise? ❞
Welcome to the concept of Signal-to-Noise Ratio (SNR) — the invisible force behind why some strategies succeed and most fail.
█ What Is Signal-to-Noise Ratio (SNR)?
⚪ In simple terms:
Signal = the real, meaningful, repeatable part of a price move
Noise = random fluctuations, market chaos, irrelevant variation
SNR = Signal Strength / Noise Level
If your signal is weak and noise is high, your edge gets buried.
If your signal is strong and noise is low, you can extract alpha with confidence.
In trading, SNR is like trying to hear a whisper in a hurricane. The whisper is your alpha. The hurricane is the market.
█ Why SNR Matters (More Than Sharpe, More Than Accuracy)
Most strategies die not because they’re logically flawed — but because they’re trying to extract signal in a low SNR environment.
Financial markets are dominated by noise.
The real edge (if it exists) is usually tiny and fleeting.
Even strong-looking backtests can be false positives created by fitting noise.
Every quant failure story you’ve ever heard — overfitting, false discoveries, bad AI models — starts with misunderstanding the signal-to-noise ratio.
█ SNR in the Age of AI
Machine learning struggles in markets because:
Most market data has very low SNR
The signal changes over time (nonstationarity)
AI is powerful enough to learn anything — including pure noise
This means unless you’re careful, your AI will confidently “discover” patterns that have no predictive value whatsoever.
Smart quants don’t just train models. They fight for SNR — every input, feature, and label is scrutinized through this lens.
█ How to Measure It (Sharpe, t-stat, IC)
You can estimate a strategy’s SNR with:
Sharpe Ratio: Signal = mean return, Noise = volatility
t-Statistic: Measures how confident you are that signal ≠ 0
Information Coefficient (IC): Correlation between forecast and realized return
👉 A high Sharpe or t-stat suggests strong signal vs noise
👉 A low value means your “edge” might just be noise in disguise
█ Real-World SNR: Why It's So Low in Markets
The average daily return of SPX is ~0.03%
The daily standard deviation is ~1%
That's signal-to-noise of 1:30 — and that's for the entire market, not a niche alpha.
Now imagine what it looks like for your scalping strategy, your RSI tweak, or your AI momentum model.
This is why most trading signals don’t survive live markets — the noise is just too loud.
█ How to Build Strategies With Higher SNR
To survive as a trader, you must engineer around low SNR. Here's how:
1. Combine signals
One weak signal = low SNR
100 uncorrelated weak signals = high aggregate SNR
2. Filter noise before acting
Use volatility filters, regime detection, thresholds
Trade only when signal strength exceeds noise level
3. Test over longer horizons
Short-term = more noise
Long-term = signal has more time to emerge
4. Avoid excessive optimization
Every parameter you tweak risks modeling noise
Simpler systems = less overfit = better SNR integrity
5. Validate rigorously
Walk-forward, OOS testing, bootstrapping — treat your model like it’s guilty until proven innocent
█ Low SNR = High Uncertainty
In low-SNR environments:
Alpha takes years to confirm (t-stat grows slowly)
Backtests are unreliable (lucky noise often looks like skill)
Drawdowns happen randomly (even good strategies get wrecked short-term)
This is why experience, skepticism, and humility matter more than flashy charts.
If your signal isn’t strong enough to consistently rise above noise, it doesn’t matter how elegant it looks.
█ Overfitting Is What Happens When You Fit the Noise
If you’ve read Why Your Backtest Lies , you already know the dangers of overfitting — when a strategy is tuned too perfectly to historical data and fails the moment it meets reality.
⚪ Here’s the deeper truth:
Overfitting is the natural consequence of working in a low signal-to-noise environment.
When markets are 95% noise and you optimize until everything looks perfect?
You're not discovering a signal. You're just fitting past randomness — noise that will never repeat the same way again.
❝ The more you optimize in a low-SNR environment, the more confident you become in something that isn’t real. ❞
This is why so many “flawless” backtests collapse in live trading. Because they never captured signal — they captured noise.
█ Final Word
Quant trading isn’t about who can code the most indicators or build the deepest neural nets.
It’s about who truly understands this:
❝ In a world full of noise, only the most disciplined signal survives. ❞
Before you build your next model, launch your next strategy, or chase your next setup…
Ask this:
❝ Am I trading signal — or am I trading noise? ❞
If you don’t know the answer, you're probably doing the latter.
-----------------
Disclaimer
The content provided in my scripts, indicators, ideas, algorithms, and systems is for educational and informational purposes only. It does not constitute financial advice, investment recommendations, or a solicitation to buy or sell any financial instruments. I will not accept liability for any loss or damage, including without limitation any loss of profit, which may arise directly or indirectly from the use of or reliance on such information.
All investments involve risk, and the past performance of a security, industry, sector, market, financial product, trading strategy, backtest, or individual's trading does not guarantee future results or returns. Investors are fully responsible for any investment decisions they make. Such decisions should be based solely on an evaluation of their financial circumstances, investment objectives, risk tolerance, and liquidity needs.

USDCHF TRADE IDEA Just like on GBPCHF, we seem to be pulling back to our Fibonacci level for a continuation move to the downside on USDCHF.
Let's see what the market does and how it unfolds.