21.07.25 Morning ForecastPairs on Watch -
FX:GBPAUD
FX:EURUSD
FX:AUDUSD
OANDA:XAUUSD
A short overview of the instruments I am looking at for today, multi-timeframe analysis down to what I will be looking at for an entry. Enjoy!
Forex market

GBPJPY - Trading The Range!Hello TradingView Family / Fellow Traders. This is Richard, also known as theSignalyst.
📈GBPJPY has been hovering within a big range.
This week, GBPJPY is retesting the upper bound of the range and $200 round number.
As long as the resistance holds, we will be looking for shorts on lower timeframes, targeting the lower bound of the range.
📚 Always follow your trading plan regarding entry, risk management, and trade management.
Good luck!
All Strategies Are Good; If Managed Properly!
~Rich
Disclosure: I am part of Trade Nation's Influencer program and receive a monthly fee for using their TradingView charts in my analysis.

This breakout confirms bullish momentum **we now have the green light to issue a new bullish signal**.

USDJPY H1 I Bearish Reversal off the 61.8%Based on the H1 chart, the price is rising toward our sell entry level at 147.90, a pullback resistance that aligns closely with the 61.8% Fib retracement.
Our take profit is set at 146.78 an overlap support.
The stop loss is set at 149.05, a swing high resistance.
High Risk Investment Warning
Trading Forex/CFDs on margin carries a high level of risk and may not be suitable for all investors. Leverage can work against you.
Stratos Markets Limited (tradu.com ):
CFDs are complex instruments and come with a high risk of losing money rapidly due to leverage. 66% of retail investor accounts lose money when trading CFDs with this provider. You should consider whether you understand how CFDs work and whether you can afford to take the high risk of losing your money.
Stratos Europe Ltd (tradu.com ):
CFDs are complex instruments and come with a high risk of losing money rapidly due to leverage. 66% of retail investor accounts lose money when trading CFDs with this provider. You should consider whether you understand how CFDs work and whether you can afford to take the high risk of losing your money.
Stratos Global LLC (tradu.com ):
Losses can exceed deposits.
Please be advised that the information presented on TradingView is provided to Tradu (‘Company’, ‘we’) by a third-party provider (‘TFA Global Pte Ltd’). Please be reminded that you are solely responsible for the trading decisions on your account. There is a very high degree of risk involved in trading. Any information and/or content is intended entirely for research, educational and informational purposes only and does not constitute investment or consultation advice or investment strategy. The information is not tailored to the investment needs of any specific person and therefore does not involve a consideration of any of the investment objectives, financial situation or needs of any viewer that may receive it. Kindly also note that past performance is not a reliable indicator of future results. Actual results may differ materially from those anticipated in forward-looking or past performance statements. We assume no liability as to the accuracy or completeness of any of the information and/or content provided herein and the Company cannot be held responsible for any omission, mistake nor for any loss or damage including without limitation to any loss of profit which may arise from reliance on any information supplied by TFA Global Pte Ltd.
The speaker(s) is neither an employee, agent nor representative of Tradu and is therefore acting independently. The opinions given are their own, constitute general market commentary, and do not constitute the opinion or advice of Tradu or any form of personal or investment advice. Tradu neither endorses nor guarantees offerings of third-party speakers, nor is Tradu responsible for the content, veracity or opinions of third-party speakers, presenters or participants.

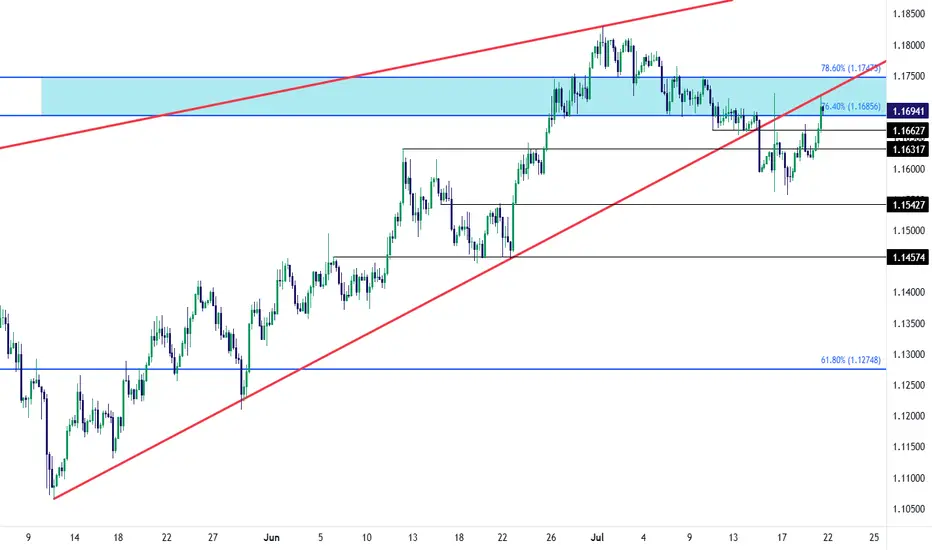
EUR/USD Recovery into Resistance TestEUR/USD bears had an open door to make a run last week and, so far, they've failed. The Wednesday turn around Trump's threat to fire Jerome Powell certainly made a mark, but the question now is whether the USD can respond to support at a longer-term trendline; and, in turn, EUR/USD is now testing in the zone between 76.4 and 78.6% Fibonacci retracements of the 2021-2022 major move.
There's also the underside of the falling wedge pattern that's now coming in as resistance as taken from prior support. The next resistance level overhead is the 1.1748 level, which is the 78.6% retracement that had offered both resistance and support with short-term price action in the pair. - js
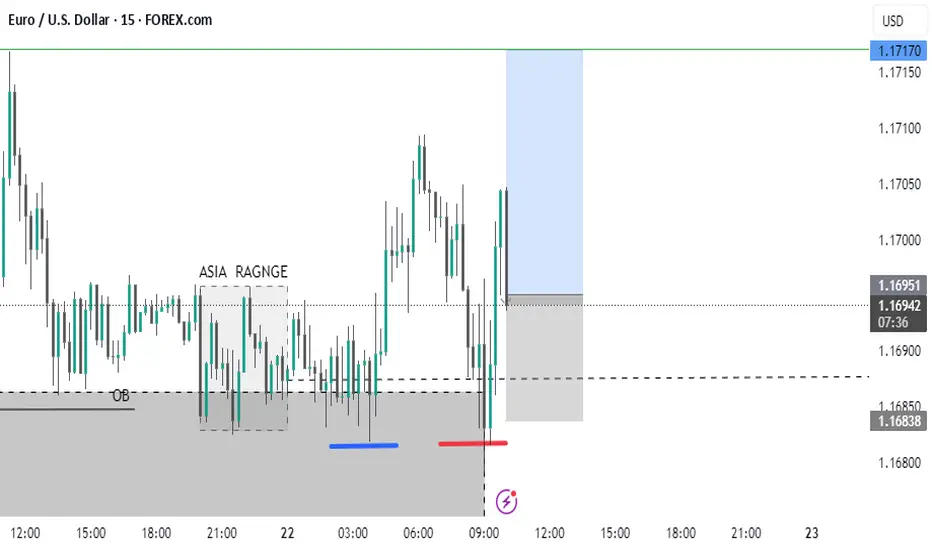
SELL EURUSDAfter todays buys hitting our target we are shifting to a sell play. Our entry is at 1.16878 and second entry at 1.17077. Our stop loss is at 1.17228 and target is at 1.16270. Use proper risk management and best of luck. Algounlocked
EURCAD Buyers In Panic! SELL!
My dear friends,
My technical analysis for EURCAD is below:
The market is trading on 1.6005 pivot level.
Bias - Bearish
Technical Indicators: Both Super Trend & Pivot HL indicate a highly probable Bearish continuation.
Target - 1.5956
About Used Indicators:
A pivot point is a technical analysis indicator, or calculations, used to determine the overall trend of the market over different time frames.
Disclosure: I am part of Trade Nation's Influencer program and receive a monthly fee for using their TradingView charts in my analysis.
———————————
WISH YOU ALL LUCK

GBP/USD TARGET1 - TARGET2target no. 1, then target no. 2, meaning continued weakening of the GBP against the USD.
Tools:
- real volume (proper interpretation)
- Fibonacci expansion ABC
- Fibonacci retracement
- volume support and resistance levels
- oversold/overbought index
- candlestick patterns

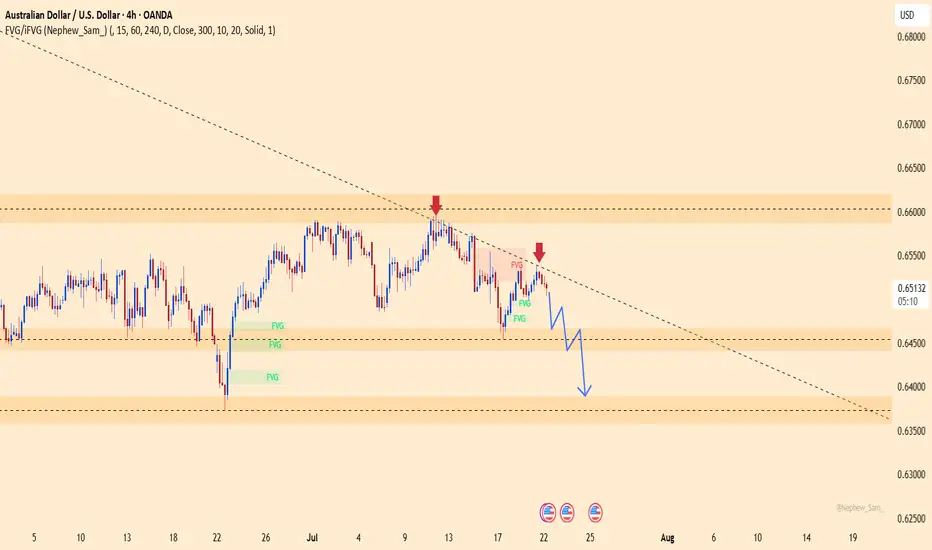
AUDUSD – Sellers taking over, the drop is on!This pair just got slapped hard at the descending trendline, right as it hit a familiar resistance zone. No more doubts – buyers are losing steam, and sellers are waiting to strike.
Market sentiment from Down Under is shaking, with weak economic signals piling up. Meanwhile, the mighty U.S. dollar is reclaiming the spotlight after gold’s flashy surge. The tide has turned!
Unless a miracle shows up, AUDUSD is set to dive deeper – and this is the perfect stage for traders who thrive on strong downtrends.
Sellers are in position – are you ready to join the ride?
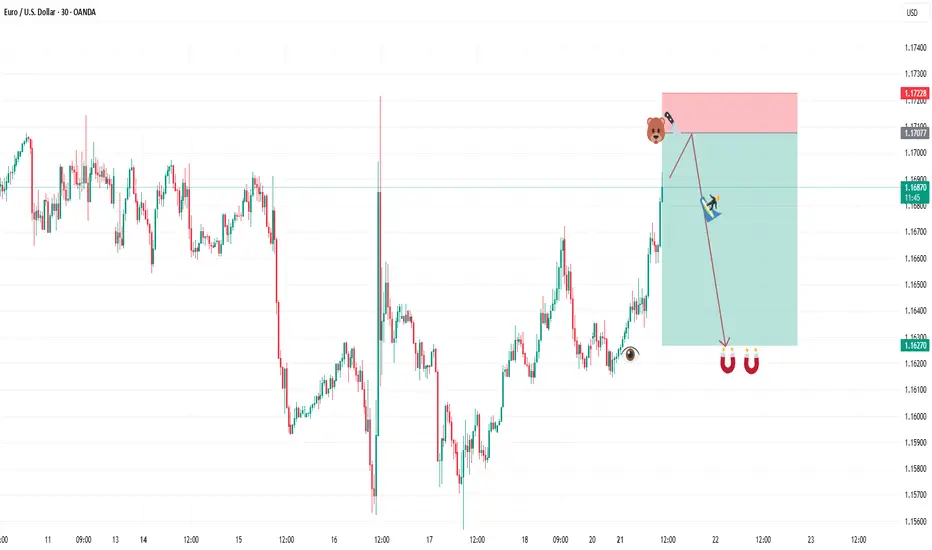
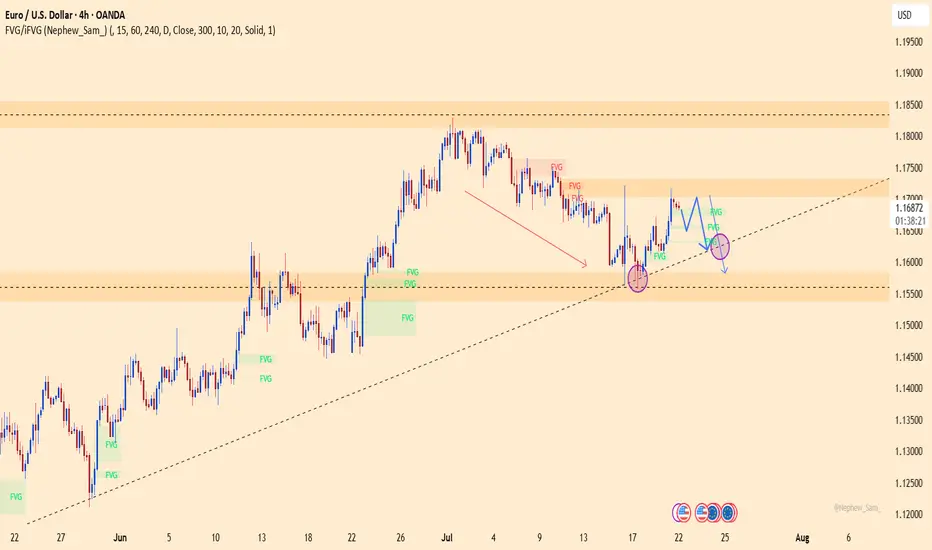
EURUSD – Is the rally over? Time for a collapse?The technical picture reveals that EURUSD is losing momentum after a brief rebound. The 1.1700 level stands as a key resistance – if bulls fail to break it, the bears will take the wheel! A clear scenario is forming: lower highs, FVGs filled, and a potential drop toward the 1.1580 support zone this week.
The bad news for the euro isn’t over: yesterday’s Eurozone PMI data disappointed heavily, signaling stagnating growth. Meanwhile, the USD is gaining traction from strong labor data and hawkish Fed remarks, putting EURUSD under double pressure.
If the ascending trendline breaks, EURUSD could plunge even further – get ready for a potential breakdown!
Suggested strategy: Prioritize SELL below 1.1700, with a short-term target at 1.1580.
Stop-loss: Above 1.1720 – a breakout here would invalidate the bearish setup.
USD/JPY Fibo Support Test NearbyUSD/JPY continues to brew traps on both sides of the pair as last week's push up to fresh three-month highs has been followed by a decisive snap back in the pair. The drive behind the move is also of interest, as Japanese election results over the weekend haven't been completely digested by Japanese markets, as they were closed on Monday for a public holiday. So the next 24 hours will be key for seeing the way that this theme gets priced-in.
In USD/JPY, there's a support level nearby in the form of the 61.8% retracement of the September-January move. Notably, this was the price that caught the low last Wednesday after the Trump-fueled sell-off took over in the USD, just after the threat to fire Jerome Powell.
Fears of a more dovish Fed make sense for USD-weakness as that could pressure further unwind of the carry trade. But with the LDP losing a majority in the upper chamber, it seems that greater political vulnerability would make for a more difficult road for the Bank of Japan to hike rates. Nonetheless, the response to support is what matters here, and there's quite a bit of structure lurking below the Fibonacci level, with 146.54 and 145.93 both of note, and that's before the 145.00 level comes back into play. - js

GBPUSDBias,to the upside on the CABLE, after,we broke to the upside clearing the Previous Monthly candle Open, price is expected to continue to the upside

GbpusdI’m looking for bearish movement in pound. It’s a contra trend trade, but I have the right movement in COT

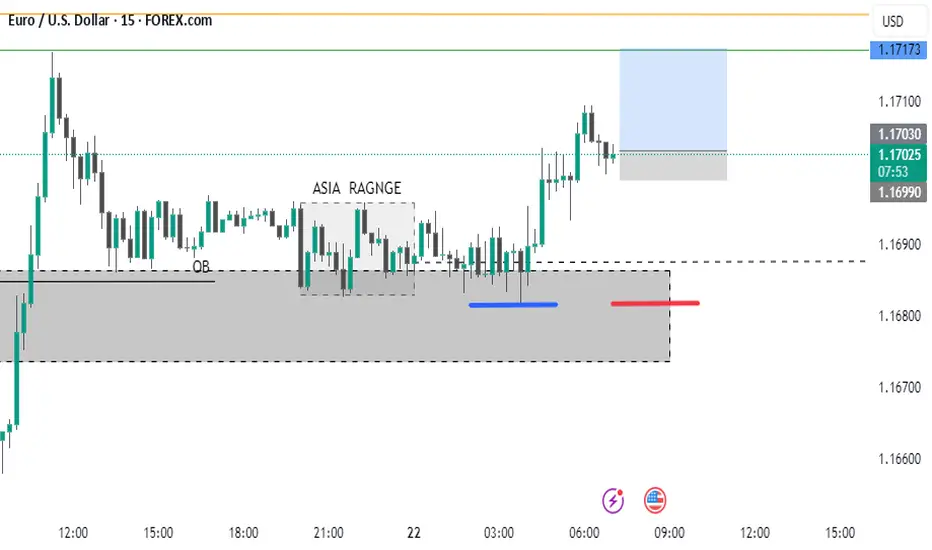
DeGRAM | EURUSD in the consolidation zone📊 Technical Analysis
● Price broke the month-long bearish channel and is now basing inside the 1.165-1.169 consolidation block; repeated intraday retests (blue zone) turn the former cap into fresh support.
● A steep hourly up-sloper is carving successive higher-lows; its width and the prior channel depth project follow-through toward 1.1745 (mid-July pivot) with room to the next swing line at 1.1800.
💡 Fundamental Analysis
● FXStreet highlights softer US PMIs and a pull-back in 2-yr yields, while ECB sources flag “data-dependent patience” rather than imminent cuts—narrowing the short-rate gap and favouring the euro.
✨ Summary
Long 1.1650-1.1680; hold above the blue base targets 1.1745 ➜ 1.1800. Long view void on an H1 close below 1.1615.
-------------------
Share your opinion in the comments and support the idea with a like. Thanks for your support!

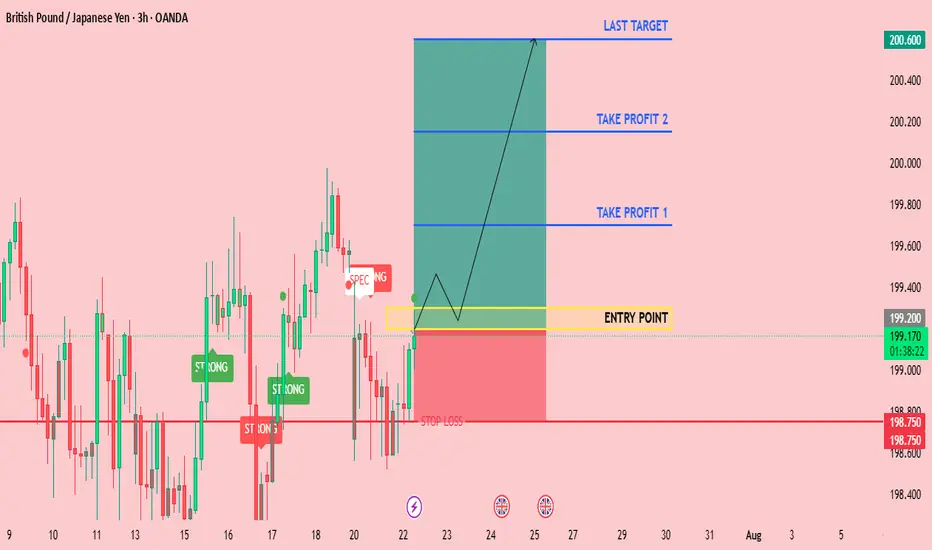
CHECK GBPJPY SIGNAL READ THE CAPTAINEntry Point: Around 199.300 199.200
Stop Loss: Around 198.750
🎯 Target Levels
Take Profit 1:
199.700
Take Profit 2:
200.150
last target
200.600
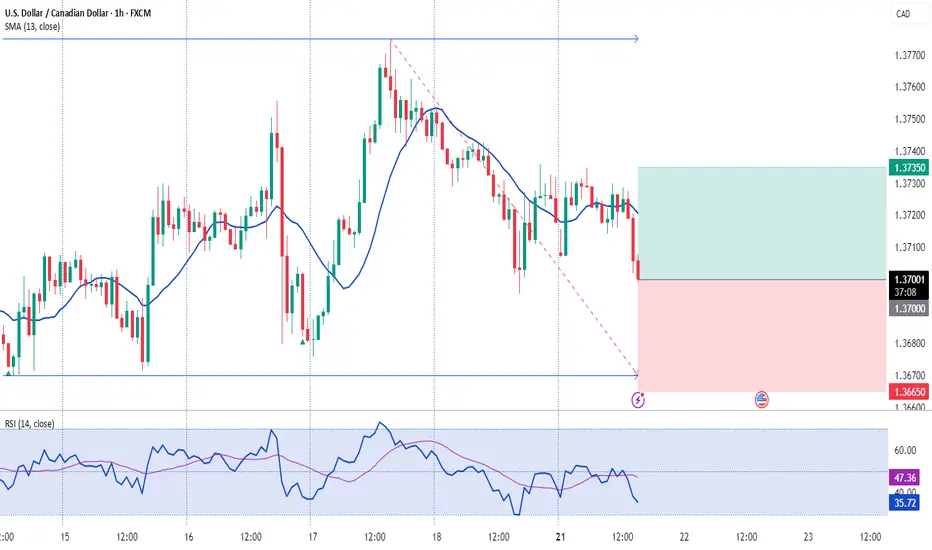
SELL CADCHF now for 4h time frame bearish trend continuationSELL CADCHF now for 4h time frame bearish trend continuation
SELL CADCHF now for a four hour time frame bearish trend continuation..........
STOP LOSS: 0.5845
This sell trade setup is based on hidden bearish divergence trend continuation trading pattern...
Always remember, the trend is your friend, so whenever you can get a signal that the trend will continue, then good for you to be part of it
TAKE PROFIT : take profit will be when the trend comes to an end, feel from to send me a direct DM if you have any question about take profit or anything.
Remember to risk only what you are comfortable with….....trading with the trend, patient and good risk management is the key to success here

"EUR/USD Technical Blueprint: Bullish Continuation EUR/USD Technical Blueprint: Bullish Continuation Patterns and Strategic Price Zones Explained
🔹 Market Structure & Trend
The chart shows a clear shift from a ranging phase into a bullish breakout:
Price previously consolidated in a broad horizontal channel, with a strong demand zone (support) established between 1.16000 – 1.16600.
Following a deep liquidity grab on July 17-18, the price bounced sharply from support, creating higher highs and higher lows – a classic bullish structure.
Current momentum shows bullish continuation, as the price broke above local resistance around 1.16645 and is now forming a potential bull flag or bullish pennant pattern.
🟢 Bullish Momentum Confirmation
Price is currently retesting the broken resistance (now acting as support at 1.16645).
If the support holds and bullish momentum continues, the measured move target projects a price move toward 1.17331, the next significant resistance level.
This is also supported by increased volume activity in the breakout zone, as seen on the VPVR.
📊 Key Technical Levels
Level Type Description
1.16000 Major Support Historical demand zone + liquidity grab
1.16645 Support Zone Previous resistance, now retest area
1.16926 Current Price Bullish consolidation forming
1.17331 Resistance Bullish target based on breakout projection
1.17700+ Extension Potential continuation level if momentum persists
🧠 Volume & Volatility Insight
Bollinger Bands are expanding post-breakout, indicating increasing volatility and a potential trend continuation.
VPVR shows a high-volume node around 1.166, confirming it as a strong demand zone.
🔎 Outlook & Strategy
✅ Bullish Bias
As long as the price remains above 1.16645, buying dips could be a favorable strategy.
A break above 1.17000 with strong volume could open a path toward 1.1733 and higher.
❌ Invalidation Level
A strong close below 1.16600 would invalidate the bullish setup and could return price to the lower support around 1.16000.
📌 Conclusion
EUR/USD is displaying strong bullish momentum after breaking a key resistance level and forming a solid support base. A breakout above 1.17000 may lead to a continuation toward 1.17331 and potentially higher. This setup favors bullish positioning with tight risk management.


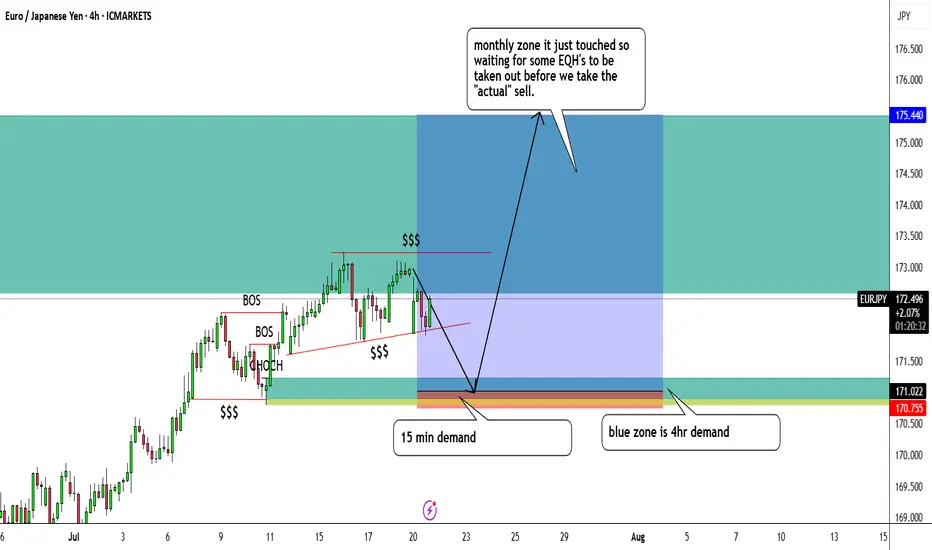
EURJPY buysHello everyone,
I am looking for eurjpy buys only because on the 15 min chart, price decided to take out EQL's to go long thus creating a big bullish move which has been marked in yellow and annotated.
Price than made this wedge liquidity zone where both EQL's and EQH's are present so we believe outside of this range is where the liquidity actually is.
4hr and 15 min demand zone is still untouched so we're looking for the buy around the 171.185 area to be precise.
I will be putting up screenshots as well so that it makes sense.
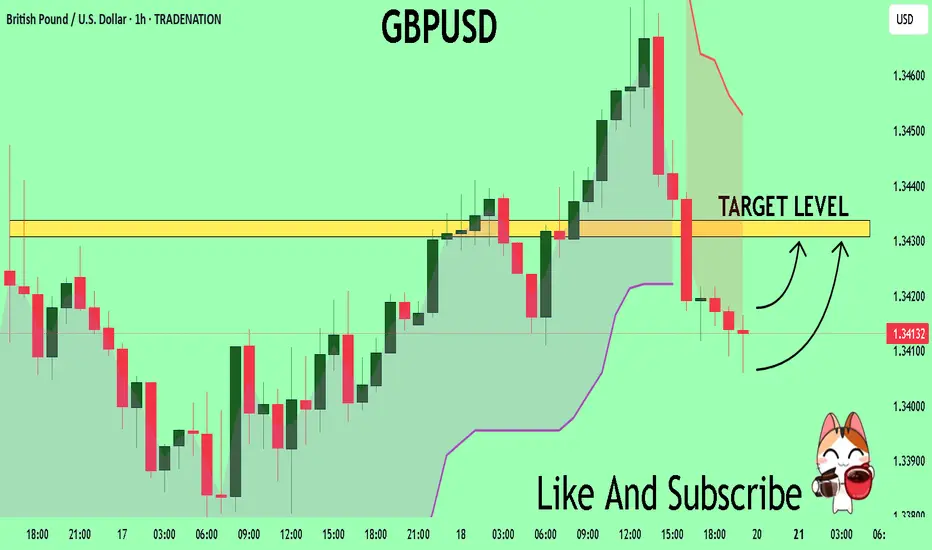
GBPUSD Expected Growth! BUY!
My dear followers,
I analysed this chart on GBPUSD and concluded the following:
The market is trading on 1.3413 pivot level.
Bias - Bullish
Technical Indicators: Both Super Trend & Pivot HL indicate a highly probable Bullish continuation.
Target - 1.3430
About Used Indicators:
A super-trend indicator is plotted on either above or below the closing price to signal a buy or sell. The indicator changes color, based on whether or not you should be buying. If the super-trend indicator moves below the closing price, the indicator turns green, and it signals an entry point or points to buy.
Disclosure: I am part of Trade Nation's Influencer program and receive a monthly fee for using their TradingView charts in my analysis.
———————————
WISH YOU ALL LUCK