Adding USDJPY SHORTS now !please take a look at the 30m chart. I am short at time of writing this post.
As usual, have a higher SL and watch your position sizing. Do not be greedy and stack up unnecessarily.
Please DYODD
Forex market

EURUSD Good buy opportunityTime to buy EURUSD with CPI
EURUSD has broken the Trend Line liquidity and is ready to continue the upward trend.

GBP/JPY H4 | Yen weakness to persist?GBP/JPY is falling towards a pullback support and could potentially bounce off this level to climb higher.
Buy entry is at 197.98 which is a pullback support that aligns with the 38.2% Fibonacci retracement.
Stop loss is at 196.68 which is a level that lies underneath a swing-low support and the 61.8% Fibonacci retracement.
Take profit is at 199.75 which is a swing-high resistance.
High Risk Investment Warning
Trading Forex/CFDs on margin carries a high level of risk and may not be suitable for all investors. Leverage can work against you.
Stratos Markets Limited (tradu.com ):
CFDs are complex instruments and come with a high risk of losing money rapidly due to leverage. 63% of retail investor accounts lose money when trading CFDs with this provider. You should consider whether you understand how CFDs work and whether you can afford to take the high risk of losing your money.
Stratos Europe Ltd (tradu.com ):
CFDs are complex instruments and come with a high risk of losing money rapidly due to leverage. 63% of retail investor accounts lose money when trading CFDs with this provider. You should consider whether you understand how CFDs work and whether you can afford to take the high risk of losing your money.
Stratos Global LLC (tradu.com ):
Losses can exceed deposits.
Please be advised that the information presented on TradingView is provided to Tradu (‘Company’, ‘we’) by a third-party provider (‘TFA Global Pte Ltd’). Please be reminded that you are solely responsible for the trading decisions on your account. There is a very high degree of risk involved in trading. Any information and/or content is intended entirely for research, educational and informational purposes only and does not constitute investment or consultation advice or investment strategy. The information is not tailored to the investment needs of any specific person and therefore does not involve a consideration of any of the investment objectives, financial situation or needs of any viewer that may receive it. Kindly also note that past performance is not a reliable indicator of future results. Actual results may differ materially from those anticipated in forward-looking or past performance statements. We assume no liability as to the accuracy or completeness of any of the information and/or content provided herein and the Company cannot be held responsible for any omission, mistake nor for any loss or damage including without limitation to any loss of profit which may arise from reliance on any information supplied by TFA Global Pte Ltd.
The speaker(s) is neither an employee, agent nor representative of Tradu and is therefore acting independently. The opinions given are their own, constitute general market commentary, and do not constitute the opinion or advice of Tradu or any form of personal or investment advice. Tradu neither endorses nor guarantees offerings of third-party speakers, nor is Tradu responsible for the content, veracity or opinions of third-party speakers, presenters or participants.

Bullish bounce?AUD/CAD is falling towards the support level which is an overlap support that aligns with the 71% Fibonacci retracement and could bounce from this level to our take profit.
Entry: 0.89106
Why we like it:
There is an overlap support that lines up with the 71% Fibonacci retracement.
Stop loss: 0.88668
Why we like it:
There is a pullback support.
Take profit: 0.90090
Why we like it:
There is a pullback resistance.
Enjoying your TradingView experience? Review us!
Please be advised that the information presented on TradingView is provided to Vantage (‘Vantage Global Limited’, ‘we’) by a third-party provider (‘Everest Fortune Group’). Please be reminded that you are solely responsible for the trading decisions on your account. There is a very high degree of risk involved in trading. Any information and/or content is intended entirely for research, educational and informational purposes only and does not constitute investment or consultation advice or investment strategy. The information is not tailored to the investment needs of any specific person and therefore does not involve a consideration of any of the investment objectives, financial situation or needs of any viewer that may receive it. Kindly also note that past performance is not a reliable indicator of future results. Actual results may differ materially from those anticipated in forward-looking or past performance statements. We assume no liability as to the accuracy or completeness of any of the information and/or content provided herein and the Company cannot be held responsible for any omission, mistake nor for any loss or damage including without limitation to any loss of profit which may arise from reliance on any information supplied by Everest Fortune Group.

USDZAR Support CallingUSDZAR will short towards the support area at 17,73. Currently price is showing strong bearish reversal signs. Sells active from 19,91 to 17,73

EUR-USD Will Keep Growing! Buy!
Hello,Traders!
EUR-USD keep trading in
An uptrend along the rising support
So as the pair is approaching
A the support we will be
Expecting a bullish rebound
And a move up on Monday
Buy!
Comment and subscribe to help us grow!
Check out other forecasts below too!
Disclosure: I am part of Trade Nation's Influencer program and receive a monthly fee for using their TradingView charts in my analysis.

USDJPYGiven the strong net long positioning on the U.S. Dollar (DXY) and the relatively weaker net positioning on the Japanese Yen (JPY) reflected in the latest COT report, we can anticipate a continued bullish outlook for USD/JPY.
GBPUSD RE-ACCUMULATION TYPESee the arrow on charts, I recommend on shorts at this level.
This is just an redistribute above again. but for now, I only share on short idea.
I will update once idea works.
This is not a financial advice.
Trade wisely.
follow for more.
ciaooo.

USDJPY - ShortLooking to short USDJPY. Limit order set for a 1:3RR. Nice liquidity taken out of the previous 4H candle on the left.

7.15 EUR/USD LIVE TRADE UPDATEWe took this trade yesterday based on the pullback followed by a strong engulfing candle. volume and momentum are strong. Currently looks like it is having a hard time getting out of the S/R zone which to me seems pretty strong. I still think this market is heading down. We will wait and let the market do it's thing.

EURUSD Remains Under Pressure Following CPIThis morning, after the US CPI report was released at 8:30 AM EDT, EUR/USD surged briefly due to a slightly weaker-than-expected inflation reading. Despite this, signs of rising inflation persisted, leading EUR/USD to rise sharply before quickly retreating.
EUR/USD has seen an intermediate top at 1.1830 since early July. The euro is under pressure due to looming US tariffs (30% on EU imports, effective August 1) and mixed economic signals, like Eurozone industrial production rising 1.7% in May (vs. 0.9% expected). The pound (GBP) and other currencies are also reacting to tariff concerns.
Taking a look at the 1hour chart, you can see we are still trading below a descending trendline. Taking everything into consideration, I'm positioning short sells whenever we get bounce higher.
That's it - That's all - Trade Safe
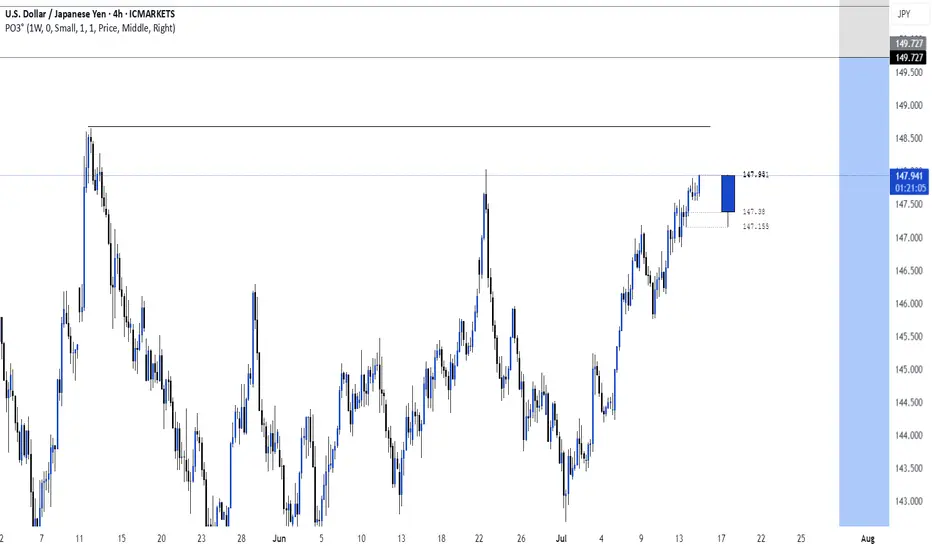
USDJPY Analysis : Bullish Channel Strategy & FMFR Zone Reaction🧩 Market Structure Overview
USDJPY has been in a strong bullish market structure, forming consistent higher highs and higher lows since the beginning of July. The pair recently created a rising ascending channel, where price action has respected both the upper and lower bounds with clean impulsive and corrective moves.
From the 11th to 15th July, USDJPY moved steadily within this bullish channel, forming minor consolidation zones and reacting to short-term supply-demand levels. However, on the 15th, we witnessed a pullback from the upper channel resistance, indicating short-term profit-taking or internal bearish liquidity sweep.
🧠 Current Price Action
Now, price is pulling back and approaching a high-confluence demand zone, marked as:
FMFR (Fair Market Fill Range): A zone where unfilled buy-side orders are likely resting.
SR Flip (Support-Resistance Interchange): A previous resistance zone, now turned into a potential support base.
This area (between 146.80 – 147.00) has multiple confirmations:
Past supply zone → broken and retested
Strong impulsive bullish move originated here
Mid-point of the current bullish channel
Psychological level (147.00 round number)
The market is now offering a potential buying opportunity from this zone, provided a bullish confirmation pattern is printed on lower timeframes (1H or 30M).
🔍 Key Technical Confluences
Bullish Ascending Channel:
Clearly respected — suggesting institutional accumulation. Price is now retesting mid-level or base structure of this channel.
FMFR Zone:
Typically used to spot unbalanced price areas where limit buy orders may rest. Smart money often returns to fill these zones before moving further.
SR Flip:
The prior supply zone from July 8–10 was broken decisively, and price is now using this same level as support.
Liquidity Sweep & Trap:
The current rejection from the channel top may have liquidated early longs. That opens room for a smart-money reversal from the deeper FMFR zone.
📌 Trading Plan (Execution-Based Strategy)
🔽 Entry Criteria:
Wait for a clear bullish reversal candle within the FMFR zone (e.g., bullish engulfing, pin bar, morning star).
Entry can be refined on the 1H or 30M timeframe using a BOS (Break of Structure) signal.
🟢 Buy Zone:
Between 146.80 – 147.00
🔴 Stop Loss:
Below 146.40, well below the FMFR zone and recent wick lows
🎯 Take Profits:
TP1: 148.20 – Retest of the central channel zone
TP2: 149.60 – Next Major Reversal Zone
TP3 (Optional): 150.00 psychological round level (if bullish continuation breaks structure)
⚠️ Risk Management Tips:
Wait for confirmation — don’t rush into the zone without candle proof.
Risk only 1-2% per trade idea.
Adjust lot size according to stop-loss distance.
Avoid chasing if price closes below 146.40 — structure will be invalid.
🔮 What Could Invalidate This Setup?
Clean break below 146.40 support with bearish structure forming (LL, LH)
Bearish fundamentals from USD side (e.g., CPI, FOMC impact)
A tight channel breakdown without bullish volume
📅 Fundamental Backdrop:
USD is currently reacting to macro data and rate expectations.
JPY remains weak structurally, unless BOJ introduces surprise tightening.
US CPI & Fed commentary may influence short-term volatility and liquidity grabs.
🧠 Conclusion:
USDJPY is presenting a high-probability buy setup as it revisits a strong confluence zone formed by FMFR + SR flip. Smart money often re-engages at these levels after liquidity hunts, especially within a bullish structure. Watch for confirmation on lower timeframes, and manage risk responsibly.
This trade idea is based on price action, structure, and institutional concepts, aiming for a trend continuation with clear invalidation levels.

GBPAUD Weekly Trade Setup–Parallel Channel Breakdown Opportunity1. Overview of GBPAUD Technical Setup
As of 15th July 2025, the GBPAUD 4-hour chart reflects a price currently positioned at a critical support level around 2.0470–2.0480, which has held multiple times since early April. The price action leading to this point has formed a classic descending parallel channel, with price making lower highs and testing horizontal support with increased frequency.
Key observations:
Price is well below the 200 EMA (currently around 2.0794), confirming a bearish long-term bias.
The resistance zone at 2.1070–2.1120 has proven strong over time, pushing back multiple rallies.
Price is compressing — getting squeezed into the lower boundary of the channel with shorter pullbacks, often a precursor to breakout.
The setup is aligning for a high-probability short trade, with a potential move toward the next major demand zone around 2.0100.
The Breakdown Thesis – What We See on the Chart
The current structure of GBPAUD tells a very clear story:
After a rally in early April, price has been trading within a consolidation range, failing to make higher highs.
The support around 2.0470 has now been tested repeatedly with lower bounces each time.
Price recently made a lower high and returned to support with momentum, increasing the probability of a breakdown.
We are expecting a bearish breakout of this support level, followed by a re-test of the broken zone, and then a strong downside continuation.
Risk Management Strategy
Every trade setup — no matter how technically perfect — must begin with a strong risk management plan.
For this GBPAUD setup:
Entry Trigger: Breakdown below 2.0470 and successful re-test rejection with bearish candle confirmation
Stop Loss: Above re-test high; ideally, just above 2.0530 (~66 pips risk)
Target 1: 2.0300 (170+ pips)
Target 2: 2.0200
Target 3 / Final: 2.0100 (potential 370+ pip move)
This gives us an excellent Risk:Reward ratio of ~1:5 or more, allowing traders to be wrong several times and still remain profitable over time.
Opportunities in the market don’t come from guessing — they come from waiting. The GBPAUD parallel channel setup is a brilliant example of structure-based trading that combines logic with discipline. Whether you're a full-time FX trader or a part-time swing participant, setups like these are where consistency is built.
Watch the breakdown. Wait for the re-test. Execute only when the market confirms your plan.
Happy Trading!
=================================================================
Disclosure: I am part of Trade Nation's Influencer program and receive a monthly fee for using their TradingView charts in my analysis.
=================================================================

EURUSD H1 I Bearish Reversal Based on the H1 chart analysis, we can see that the price is rising toward our sell entry at 1.1681, which is a pullback resistance.
Our take profit will be at .1642, an overlap support level.
The stop loss will be placed at 1.1714, a swing-high resistance level.
High Risk Investment Warning
Trading Forex/CFDs on margin carries a high level of risk and may not be suitable for all investors. Leverage can work against you.
Stratos Markets Limited (tradu.com ):
CFDs are complex instruments and come with a high risk of losing money rapidly due to leverage. 63% of retail investor accounts lose money when trading CFDs with this provider. You should consider whether you understand how CFDs work and whether you can afford to take the high risk of losing your money.
Stratos Europe Ltd (tradu.com ):
CFDs are complex instruments and come with a high risk of losing money rapidly due to leverage. 63% of retail investor accounts lose money when trading CFDs with this provider. You should consider whether you understand how CFDs work and whether you can afford to take the high risk of losing your money.
Stratos Global LLC (tradu.com ):
Losses can exceed deposits.
Please be advised that the information presented on TradingView is provided to Tradu (‘Company’, ‘we’) by a third-party provider (‘TFA Global Pte Ltd’). Please be reminded that you are solely responsible for the trading decisions on your account. There is a very high degree of risk involved in trading. Any information and/or content is intended entirely for research, educational and informational purposes only and does not constitute investment or consultation advice or investment strategy. The information is not tailored to the investment needs of any specific person and therefore does not involve a consideration of any of the investment objectives, financial situation or needs of any viewer that may receive it. Kindly also note that past performance is not a reliable indicator of future results. Actual results may differ materially from those anticipated in forward-looking or past performance statements. We assume no liability as to the accuracy or completeness of any of the information and/or content provided herein and the Company cannot be held responsible for any omission, mistake nor for any loss or damage including without limitation to any loss of profit which may arise from reliance on any information supplied by TFA Global Pte Ltd.
The speaker(s) is neither an employee, agent nor representative of Tradu and is therefore acting independently. The opinions given are their own, constitute general market commentary, and do not constitute the opinion or advice of Tradu or any form of personal or investment advice. Tradu neither endorses nor guarantees offerings of third-party speakers, nor is Tradu responsible for the content, veracity or opinions of third-party speakers, presenters or participants.

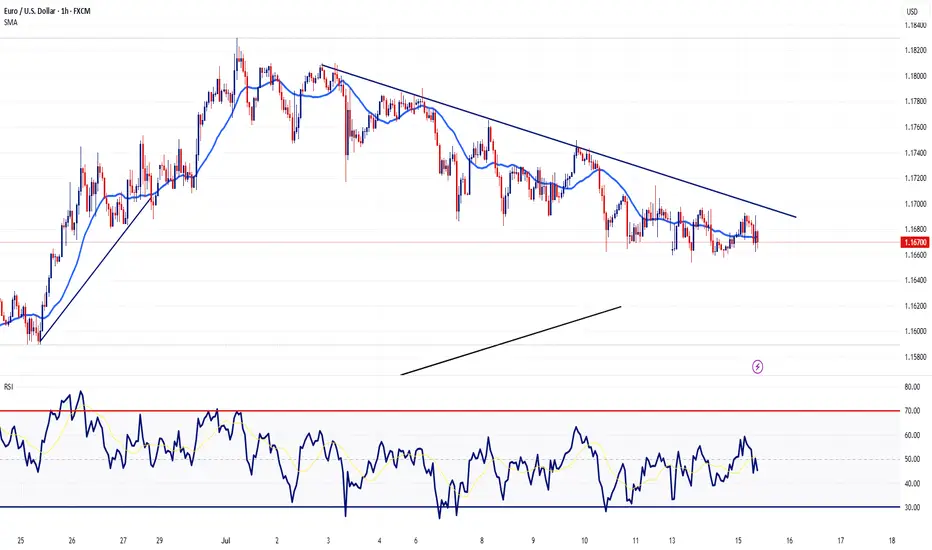
Eurousd techinical analysis.This chart displays the EUR/USD (Euro/US Dollar) currency pair on a 1-hour timeframe, with a technical analysis setup that includes:
1. Downward Trendline (Pink): This suggests a prevailing bearish trend, with price respecting lower highs.
2. Support and Resistance Zones (Purple Boxes):
Several horizontal purple rectangles highlight areas of previous support and resistance.
These zones represent price levels where buying or selling pressure has historically emerged.
3. Price Action & Pattern (Yellow Line):
A clear "M" shape or double-top pattern formed, indicating potential bearish reversal.
The pattern breaks down below a key support zone, suggesting a continuation to the downside.
4. Projection Arrow (Yellow Arrow):
The yellow arrow

Bearsih EurUsd!The fibre has begun its downward spiral. You can look for sell set-ups from now on; every time it buys, wait and look for sells. Unless of course you can trade both sides of the market. Price is aiming for 1.1060 level.
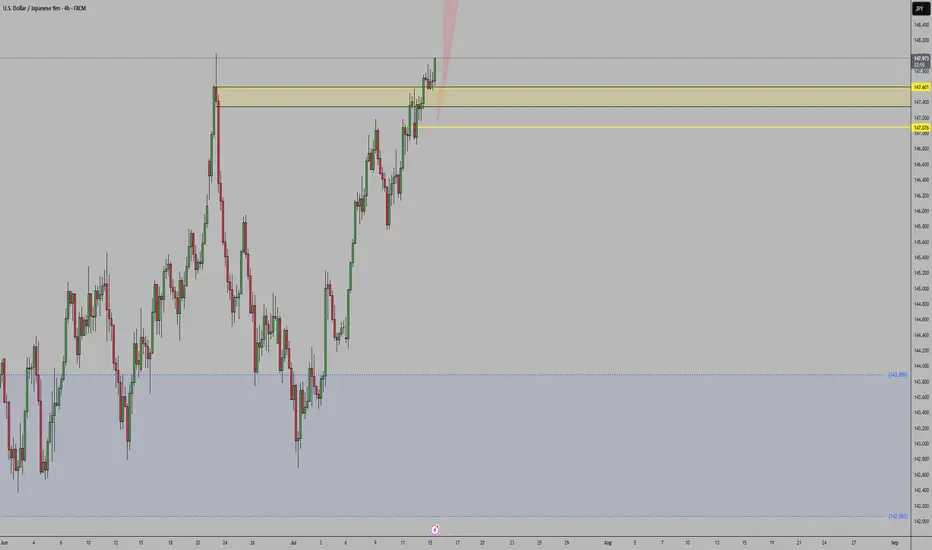
USD/JPY – Major Reversal Zone | Potential Top FormingUSD/JPY has entered a critical supply zone near 148.700 an area that has historically acted as strong resistance. The confluence of trendline rejection, overextended RSI, and multiple moving average rejections suggest a potential short-term top is forming.
🔍 Technical Breakdown:
Macro Pattern: Price is forming a broadening wedge with repeated rejections from the upper resistance trendline (multi-touch).
Supply Zone: The 148.400–148.700 range has acted as a liquidity grab zone historically — current reaction is showing early signs of exhaustion.
Bearish Confluence:
Price stalling below upper wedge resistance.
RSI sitting near overbought territory (68.75) with bearish divergence brewing.
200 SMA overhead and flattening, acting as dynamic resistance.
🎯 Trade Outlook (Short Bias):
Idea Triggered: If price fails to break and close above 148.700 with strong bullish volume, sellers are likely to step in.
Target 1: 144.200 (mid-wedge support)
Target 2: 139.000 (base of structure & ascending trendline)
Invalidation: Daily close above 148.70–149.00 — would indicate potential continuation to new highs.
🔔 Watch For:
Bearish engulfing or rising wedge breakdowns on lower timeframes (4H / 1H).
RSI divergence confirmation.
Volume drying out near resistance.
📌 Wright Way Insight:
This is a high-probability fade setup at a well-defined resistance zone. Unless bulls break structure convincingly, momentum is likely to shift down — favoring strategic short entries.
Let the chart speak. Don’t chase — trade the reversal, trade the Wright Way.

GBPCAD SHORT FORECAST Q3 D15 W29 Y25GBPCAD SHORT FORECAST Q3 D15 W29 Y25
Professional Risk Managers👋
Welcome back to another FRGNT chart update📈
Diving into some Forex setups using predominantly higher time frame order blocks alongside confirmation breaks of structure.
Let’s see what price action is telling us today! 👀
💡Here are some trade confluences📝
✅Daily Order block identified
✅4H Order Block identified
✅1H Order Block identified
🔑 Remember, to participate in trading comes always with a degree of risk, therefore as professional risk managers it remains vital that we stick to our risk management plan as well as our trading strategies.
📈The rest, we leave to the balance of probabilities.
💡Fail to plan. Plan to fail.
🏆It has always been that simple.
❤️Good luck with your trading journey, I shall see you at the very top.
🎯Trade consistent, FRGNT X

Eurousd techinical analysis.This chart shows the EUR/USD currency pair on a 1-hour timeframe. Here's a breakdown of the key technical elements:
Key Features:
1. Purple Zones (Rectangles):
Top Rectangle (~1.1695 - 1.1700): Resistance zone.
Bottom Rectangle (~1.1660): Support zone.
2. Pink Descending Trendline:
Represents a downtrend or dynamic resistance.
Price recently approached or tested this trendline from below.
3. Yellow Zigzag and Arrow:
Illustrates potential price movement—an anticipated rejection from the trendline and a move down toward support.
4. Current Price:
1.16858, sitting just below the trendline and within the resistance zone.
---
Interpretation:
Bearish Bias: The chart suggests a potential short opportunity if the price fails to break

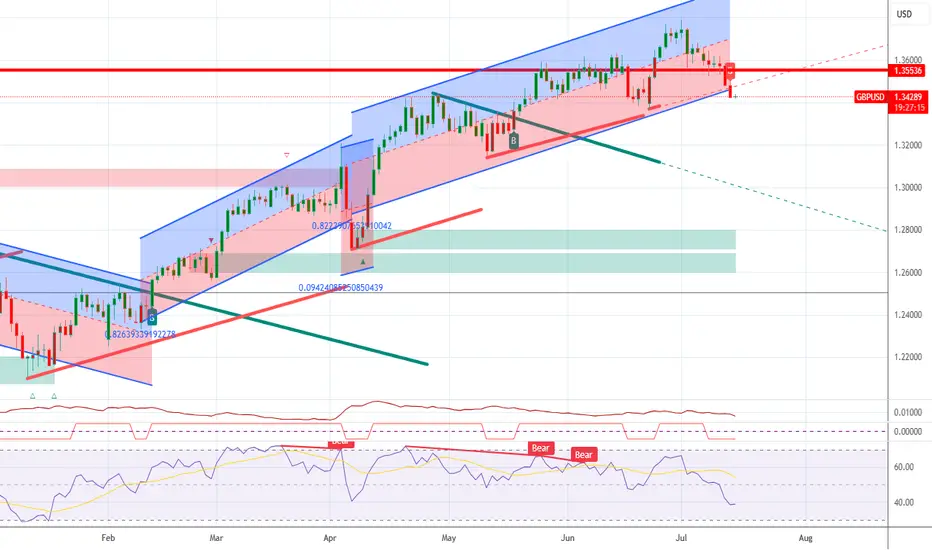
GBPUSD ShortGBPUSD is now net short on the regression break.
I am considering my EA options on this pair.
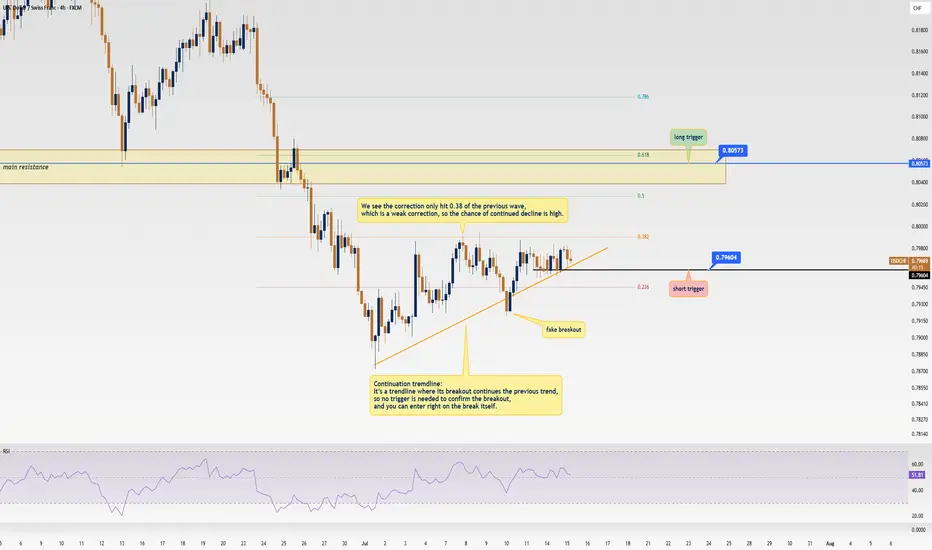
USD/CHF Update: Killer Short Trigger Ready to Pop!Welcome back, traders, it’s Skeptic from Skeptic Lab! 😎 We’ve got a juicy short trigger on USD/CHF that could deliver serious profits if it fires. Stay with me till the end to nail this trade! Let’s dive into the Daily and 4-hour timeframes for the full picture. Currently at $0.79671, here’s the play:
✔️ Daily Timeframe:
We’re in a rock-solid bearish major trend . After hitting a high of $ 0.84649 , we broke the key support at $ 0.80573 , resuming the bearish trend. A pullback to the broken $ 0.80573 level is likely, as it aligns with the 0.6 Fibonacci retracement from the prior 4-hour wave. Trading with the trend is smartest, so shorts are the focus. If you want to long, go with lower risk and close positions faster.
📊 4-Hour Timeframe (Futures Triggers):
Short Trigger: Two options here. Either enter on a trendline break (no extra trigger needed, as continuation trendlines mean the prior trend resumes on a break), or, for a safer play, short on a break of support at $ 0.79604 —this needs minimal confirmation.
Long Trigger: Wait for a break of the resistance zone at $ 0.80573 . Confirm with RSI entering overbought. Check my RSI guide ( link ) for how I use it differently—game-changing stuff!
📉 Key Insight: Stick to the bearish trend for higher-probability trades. Shorts at $0.79604 or on a trendline break are your best bet.
🔔Risk management is your lifeline—cap risk at max 1%–2% per trade to stay in the game.
I’ll catch you in the next analysis—good luck, fam! <3
💬 Let’s Talk!
Which USD/CHF trigger are you locked on? Hit the comments, and let’s crush it together! 😊 If this update lit your fire, smash that boost—it fuels my mission! ✌️
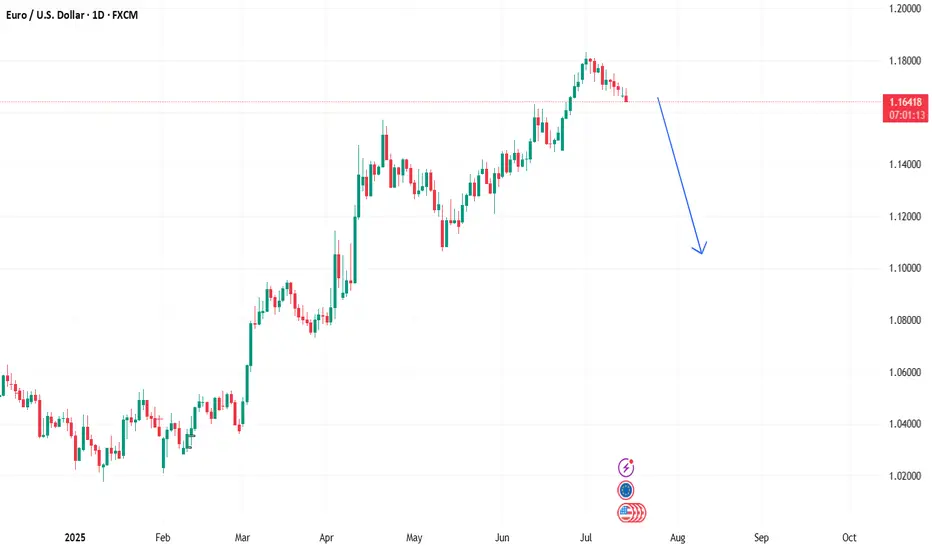
EUR/USD –Bullish Flag After Long Term Trend Shift: Is 1.20 Next?📌 In my previous EUR/USD analysis, I mentioned that the long-term trend likely reversed, and we could see a move toward the 1.23 zone in the medium to longer term.
That view is playing out.
Recently, the pair printed a new local high above 1.18, confirming the trend change.
📉 After this rise, EUR/USD pulled back –but the structure is clearly corrective: overlapping and a classic bullish flag formation.
What's next?
This correction looks close to completion, and bulls may soon return to push toward the key 1.20 level.
Trading Plan:
The 1.1620–1.1650 area stands out as a strong confluence zone – ideal for looking for buying opportunities.
The trend has changed. The setup is forming. Now it’s about timing.
Disclosure: I am part of TradeNation's Influencer program and receive a monthly fee for using their TradingView charts in my analyses and educational articles.
