GBPUSD - 15m - 95% PredictionGBPUSD - 15m
Bumping to 5 minutes order block and then dumping to create new lower low.
Forex market

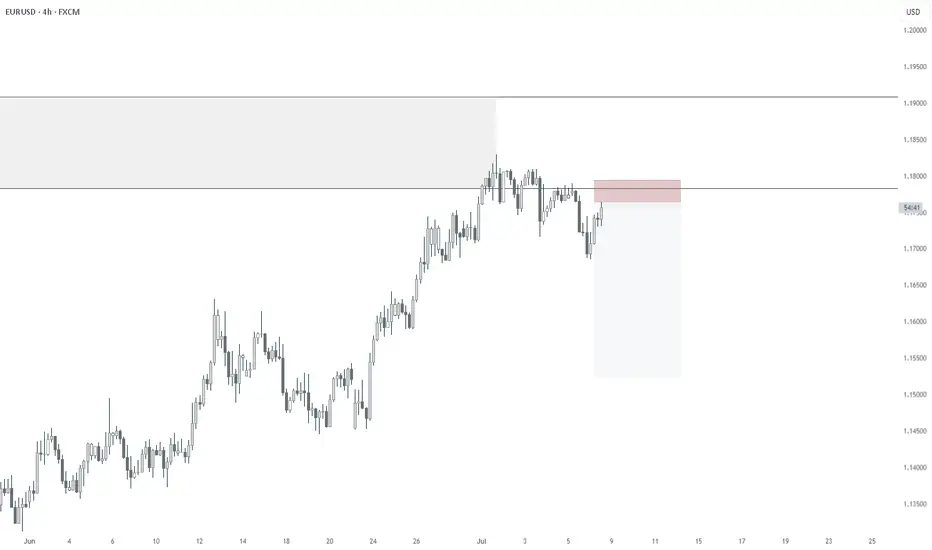
EURUSD PullbackYesterday, EURUSD continued its pullback, reaching 1,1660.
The next support levels to watch are 1,1636 and 1,1591.
Keep an eye on price action around those support levels for potential buying opportunities.
At the current levels, there’s no reason to enter a trade yet!

EURUSD : taking profit and BUYINGWhile the overall trend is DOWN, sometimes we need to know when to take some profit and buy a bit.
Those who are good play both ways.
Good luck.

GBPJPY is in the Down Trend From Resistance LevelHello Traders
In This Chart GBPJPY HOURLY Forex Forecast By FOREX PLANET
today GBPJPY analysis 👆
🟢This Chart includes_ (GBPJPY market update)
🟢What is The Next Opportunity on GBPJPY Market
🟢how to Enter to the Valid Entry With Assurance Profit
This CHART is For Trader's that Want to Improve Their Technical Analysis Skills and Their Trading By Understanding How To Analyze The Market Using Multiple Timeframes and Understanding The Bigger Picture on the Charts

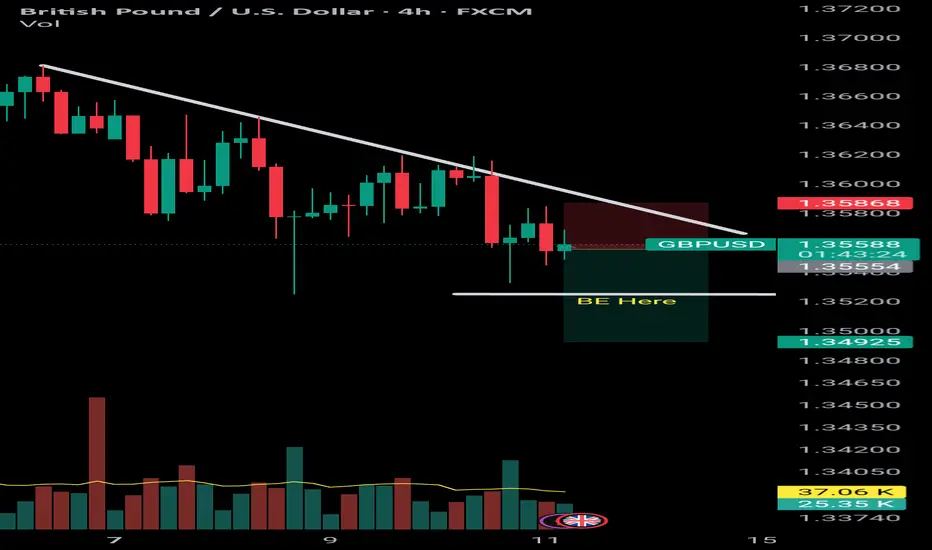
GBPUSD Bearish Bias Expected till 1.35250Little bit sign of strength observed by the lower wicks rejections but each price price shows no real intention to upside yet. We can expect atleast for the short term toward sell side min 1.35250, if hold and reverse we can move trade to Breakeven, otherwise our main target will be near 1.35300 area.

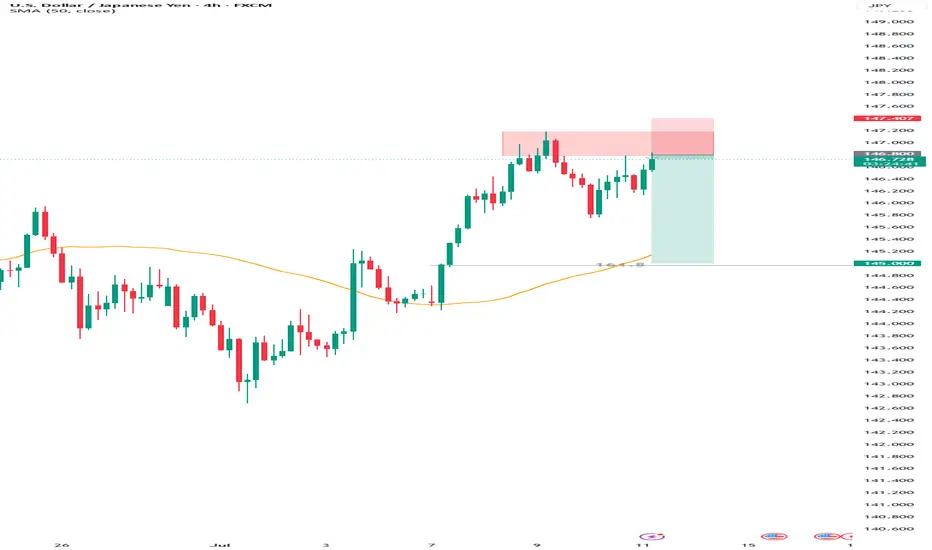
USDJPY Sell Idea Looking to sell between 146.800–147.180, targeting a move down to 145.000 with a stop loss at 147.400 to manage risk. This setup aims to catch a pullback from resistance after the recent rally, expecting the price to drop toward lower support.
As always, watch for bearish confirmation around the entry zone and trade with discipline.
Entry: 146.800 - 147.180
SL: 147.400
TP: 145.000
AUD/USD💰Symbol: { AUD/USD }
🟩Price: { 0.65569 }
🟥Stop: { 0.65850 }
1️⃣profit: { 0.65244 }
2️⃣profit: { 0.64888 }
3️⃣profit: { 0.64528 }
4️⃣profit: { 0.64093 }
📊Check your chart before entering.
🚨Check before use to make sure there is no important news.🚨

EUR/AUD💰Symbol: { EUR/AUD }
🟩Price: { 1.78851 }
🟥Stop: { 1.78304 }
1️⃣profit: { 1.79232 }
2️⃣profit: { 1.79632 }
3️⃣profit: { 1.80184 }
4️⃣profit: { 1.80898 }
📊Check your chart before entering.
🚨Check before use to make sure there is no important news.🚨

NZDJPY Strong Breakout!
HI,Traders !
NZDJPY is trading in an
Uptrend and the pair has
Made a bullish breakout of
The key horizontal level
Of 87.394 and the breakout
Is confirmed so we are
Bullish biased and we
Will be expecting a further
Bullish move up !
Comment and subscribe to help us grow !

Bullish bounce off 50% Fibonacci support?USD/CHF is falling towards the support level which is an overlap support that aligns with the 50% Fibonacci retracement and could bounce from this level to our take profit.
Entry: 0.7950
Why we like it:
There is an overlap support level that lines up with the 50% Fibonacci retracement.
Stop loss: 0.7924
Why we like it:
There is a pullback support.
Take profit: 0.7986
Why we like it:
There is a pullback resistance.
Enjoying your TradingView experience? Review us!
Please be advised that the information presented on TradingView is provided to Vantage (‘Vantage Global Limited’, ‘we’) by a third-party provider (‘Everest Fortune Group’). Please be reminded that you are solely responsible for the trading decisions on your account. There is a very high degree of risk involved in trading. Any information and/or content is intended entirely for research, educational and informational purposes only and does not constitute investment or consultation advice or investment strategy. The information is not tailored to the investment needs of any specific person and therefore does not involve a consideration of any of the investment objectives, financial situation or needs of any viewer that may receive it. Kindly also note that past performance is not a reliable indicator of future results. Actual results may differ materially from those anticipated in forward-looking or past performance statements. We assume no liability as to the accuracy or completeness of any of the information and/or content provided herein and the Company cannot be held responsible for any omission, mistake nor for any loss or damage including without limitation to any loss of profit which may arise from reliance on any information supplied by Everest Fortune Group.

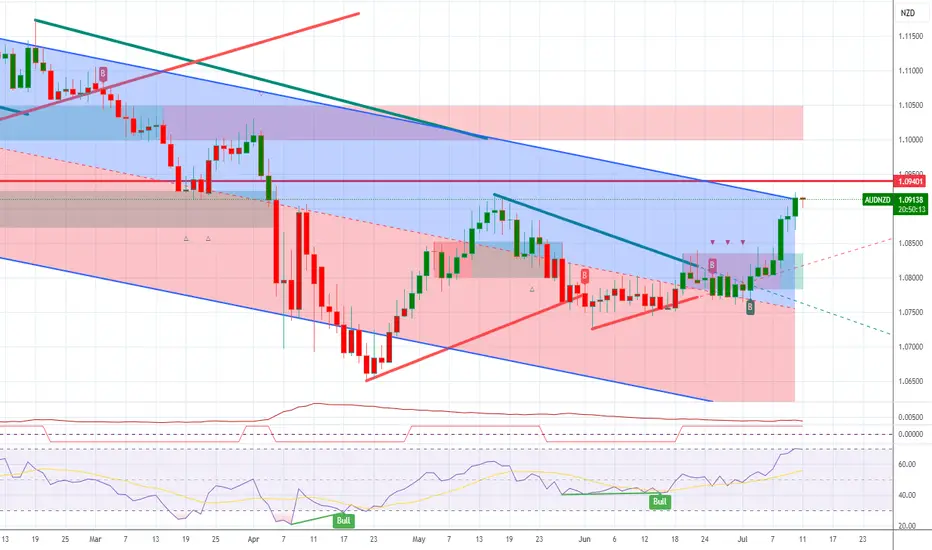
AUDNZD LongAUDNZD is now net long, and this is it's first break in months.
I am reviewing all AUD pairs.
ABC Correction EURAUDSell: 1.79675
Set up: B wave in conjunction with 0.618 Fib retracement
Sl: 1.81566
TP:1.72980

U.K. GDP Report: What It Means for GBPUSD CMCMARKETS:GBPUSD
Today, the U.K. Office for National Statistics (ONS) 📊 will release its monthly Gross Domestic Product (GDP) report 🗓️ at 6:00 a.m. UTC ⏰, likely impacting the British Pound (GBP) and GBP pairs globally 🌍.
🧐 What is GDP, and why does it matter?
GDP (Gross Domestic Product) 💡 measures the total value of all goods and services produced within a country’s economy over a specific period. It is a key indicator of economic health 🏥, influencing central bank decisions, investor sentiment, and currency valuations.
A higher-than-expected GDP 🆙 suggests a strong economy, which can support the currency 💪, while a lower-than-expected GDP 🆘 indicates weakness, often pressuring the currency lower 🔻.
📈 Market Expectations:
The market forecasts UK GDP growth to rise by 0.1% for May 🗓️, but we anticipate the increase may be smaller than expected 📉, implying a potential bearish surprise for GBPUSD.
⚡️ Trade Setup:
🔻 SELL Stop: 1.35330
❌ Stop Loss: 1.35714
✅ Take Profit: 1.34946
Risk-reward ratio: 1:1 ⚖️
🚨 Why Sell Here?
🔸 A weaker-than-expected GDP could lead to a pullback in GBPUSD below 1.3500 🚦.
🔸 Technical levels align with potential downside opportunities.
🔸 Volatility expected during and after the data release — manage risk carefully! ⚠️
📌 Stay tuned for live updates and analysis following the data release!
💬 Support this post if it helps your trading decisions! 🔔

NZD-CHF Broken Wedge Pattern! Buy!
Hello,Traders!
NZD-CHF was trading in a
Narrowing bullish wedge pattern
And now we are finally seeing
A bullish breakout so we are
Bullish biased now and we
Will be expecting a further
Bullish move up after a
Local correction
Buy!
Comment and subscribe to help us grow!
Check out other forecasts below too!
Disclosure: I am part of Trade Nation's Influencer program and receive a monthly fee for using their TradingView charts in my analysis.

USDCADThis is a technical scenario, not a guaranteed prediction. The zone is becoming a key area of interest. No confirmation, no trade.
If confirmed breakout and retest occur, I’ll look to trade in alignment with the new structure.

GBPUSD📌 GBPUSD – Scenario-Based Plan
The first level I’ve marked is a short-term zone.
If we get a strong buy signal there with good R/R, I’ll enter and trail aggressively.
The second level is a stronger demand zone and a better area for potential long setups.
❗️Remember: These are just scenarios — not predictions.
We stay ready for whatever the market delivers.

07/08/2025 - EURUSD - HEDGE SHORTHedge Short for FX:GBPUSD
COT Retailer still extended
We are on the higher timeframe weekly zone
Substructure is already confirmed bearish
EURGBP SHORT DAILY FORECAST Q3 D11 W28 Y25EURGBP SHORT DAILY FORECAST Q3 D11 W28 Y25
It’s Fun Coupon Friday! 💸🔥
Professional Risk Managers👋
Welcome back to another FRGNT chart update📈
Diving into some Forex setups using predominantly higher time frame order blocks alongside confirmation breaks of structure.
Let’s see what price action is telling us today! 👀
💡Here are some trade confluences📝
✅Daily Order block identified
✅4H Order Block identified
✅1H Order Block identified
🔑 Remember, to participate in trading comes always with a degree of risk, therefore as professional risk managers it remains vital that we stick to our risk management plan as well as our trading strategies.
📈The rest, we leave to the balance of probabilities.
💡Fail to plan. Plan to fail.
🏆It has always been that simple.
❤️Good luck with your trading journey, I shall see you at the very top.
🎯Trade consistent, FRGNT X

GBPJPY – Correction Pressure Is Building UpGBPJPY is still trading within a well-defined ascending channel on the H4 chart. However, recent signals suggest a potential short-term correction. The price has repeatedly rejected the upper boundary of the channel and is now forming a distribution pattern with lower highs. The FVG zone near 200.400 may act as a short-term take-profit area before price pulls back toward the support zone around 198.400, which also aligns with the lower trendline.
Additionally, the upcoming UK GDP data this week could strongly impact GBP. If the data comes in weaker than expected, downside pressure may intensify and reinforce the developing correction scenario. Traders should monitor price action around 198.400 for confirmation of the pullback.

GBPNZD to find buyers at current market price?GBPNZD - 24h expiry
The medium term bias remains bullish.
We look for a temporary move lower. Preferred trade is to buy on dips.
Bespoke support is located at 2.2485.
Risk/Reward is ample to buy at market.
We look to Buy at 2.2485 (stop at 2.2430)
Our profit targets will be 2.2705 and 2.2730
Resistance: 2.2650 / 2.2740 / 2.2790
Support: 2.2500 / 2.2450 / 2.2410
Risk Disclaimer
The trade ideas beyond this page are for informational purposes only and do not constitute investment advice or a solicitation to trade. This information is provided by Signal Centre, a third-party unaffiliated with OANDA, and is intended for general circulation only. OANDA does not guarantee the accuracy of this information and assumes no responsibilities for the information provided by the third party. The information does not take into account the specific investment objectives, financial situation, or particular needs of any particular person. You should take into account your specific investment objectives, financial situation, and particular needs before making a commitment to trade, including seeking advice from an independent financial adviser regarding the suitability of the investment, under a separate engagement, as you deem fit.
You accept that you assume all risks in independently viewing the contents and selecting a chosen strategy.
Where the research is distributed in Singapore to a person who is not an Accredited Investor, Expert Investor or an Institutional Investor, Oanda Asia Pacific Pte Ltd (“OAP“) accepts legal responsibility for the contents of the report to such persons only to the extent required by law. Singapore customers should contact OAP at 6579 8289 for matters arising from, or in connection with, the information/research distributed.

USDCAD LONG DAILY FORECAST Q3 D11 W28 Y25USDCAD LONG DAILY FORECAST Q3 D11 W28 Y25
It’s Fun Coupon Friday! 💸🔥
Professional Risk Managers👋
Welcome back to another FRGNT chart update📈
Diving into some Forex setups using predominantly higher time frame order blocks alongside confirmation breaks of structure.
Let’s see what price action is telling us today! 👀
💡Here are some trade confluences📝
✅Daily Order block identified
✅4H Order Block identified
✅1H Order Block identified
🔑 Remember, to participate in trading comes always with a degree of risk, therefore as professional risk managers it remains vital that we stick to our risk management plan as well as our trading strategies.
📈The rest, we leave to the balance of probabilities.
💡Fail to plan. Plan to fail.
🏆It has always been that simple.
❤️Good luck with your trading journey, I shall see you at the very top.
🎯Trade consistent, FRGNT X
