GBP/USD: Path to 1.3200 on Policy DivergenceThis trade idea outlines a high-conviction bearish thesis for GBP/USD. The core of this analysis is a significant and growing divergence between the fundamental outlooks of the UK and US economies, which is now being confirmed by a bearish technical structure. We anticipate the upcoming UK economic data releases during the week of July 14-18 to act as a catalyst for the next leg down.
The Fundamental Why 📰
The primary driver for this trade is the widening policy and economic divergence. The UK is facing a triad of headwinds while the US economy exhibits greater resilience. This fundamental imbalance favors the US Dollar and is expected to intensify.
Dovish Bank of England: The BoE is clearly signaling a dovish pivot towards monetary easing in response to a weakening labor market and sluggish growth prospects. This contrasts with the Federal Reserve's more patient, data-dependent stance.
Widening Rate Differentials: The divergence in central bank policy is leading to a widening interest rate differential that favors the US Dollar.
Geopolitical Headwinds: Fiscal policy from the new UK government and ongoing trade tensions are creating additional headwinds for the Pound.
The Technical Picture 📊
Price action provides strong confirmation of the bearish fundamental thesis, showing a clear loss of upward momentum and the formation of a new downtrend.
📉 Death Cross: The 50-day moving average has crossed below the 200-day moving average, forming a "death cross," which is a strong bearish indicator.
📉 Key Level Lost: The price has recently broken and is holding below the critical 200-day moving average, a classic bearish signal.
📉 Bearish Momentum: Both the RSI (below 50) and the MACD (below its signal line and zero) indicate that bearish momentum is in control.
The Trade Setup 📉
👉 Entry: 1.3540 - 1.3610
🎯 Take Profit: 1.3200
⛔️ Stop Loss: 1.3665
Forex market

NZD/USD showing a potential bullish setupNZDUSD 4H Trade Breakdown – Bullish Reversal in Play 🔥📈
This setup is a textbook example of a smart money reversal backed by structure, market psychology, and clear technicals.
1. Change of Character (CHoCH):
- The market was previously in a downtrend.
- Price broke above the last lower high, signaling a CHoCH – the first sign that buyers are gaining control.
- This is a key point where many smart traders start paying attention.
2. Trendline & Channel Respect:
- Price tapped perfectly off the ascending trendline, confirming the long-term bullish channel.
- This adds confluence (multiple confirmations) to the bullish bias.
3. Market Structure Shift:
- After the CHoCH, price formed a higher low and started pushing up.
- This shows a shift to bullish structure (higher highs and higher lows).
4. Projected Move:
- The blue arrow shows a likely path: a bullish break, possible pullback to retest the broken structure, then continuation up.
- Targeting above 0.61200, with potential for further highs.
Why this trade stands out:
✅ Structure break (CHoCH)
✅ Strong support off trendline

NZDCAD Selling Trading IdeaHello Traders
In This Chart nzdcad HOURLY Forex Forecast By FOREX PLANET
today NZDCAD analysis 👆
🟢This Chart includes_ (NZDCAD market update)
🟢What is The Next Opportunity on NZDCAD Market
🟢how to Enter to the Valid Entry With Assurance Profit
This CHART is For Trader's that Want to Improve Their Technical Analysis Skills and Their Trading By Understanding How To Analyze The Market Using Multiple Timeframes and Understanding The Bigger Picture on the Charts

EURUSD is in a Downside DirectionHello Traders
In This Chart EURUSD HOURLY Forex Forecast By FOREX PLANET
today EURUSD analysis 👆
🟢This Chart includes_ (EURUSD market update)
🟢What is The Next Opportunity on EURUSD Market
🟢how to Enter to the Valid Entry With Assurance Profit
This CHART is For Trader's that Want to Improve Their Technical Analysis Skills and Their Trading By Understanding How To Analyze The Market Using Multiple Timeframes and Understanding The Bigger Picture on the Charts

GBPJPY is Holding above the SupportHello Traders
In This Chart GBPJPY HOURLY Forex Forecast By FOREX PLANET
today GBPJPY analysis 👆
🟢This Chart includes_ (GBPJPY market update)
🟢What is The Next Opportunity on GBPJPY Market
🟢how to Enter to the Valid Entry With Assurance Profit
This CHART is For Trader's that Want to Improve Their Technical Analysis Skills and Their Trading By Understanding How To Analyze The Market Using Multiple Timeframes and Understanding The Bigger Picture on the Charts

EURNZD is in the downtrend after breaking TrendlineHello Traders
In This Chart EURNZD 4 HOURLY Forex Forecast By FOREX PLANET
today EURNZD analysis 👆
🟢This Chart includes EURNZD market update)
🟢What is The Next Opportunity on EURNZD Market
🟢how to Enter to the Valid Entry With Assurance Profit
This CHART is For Trader's that Want to Improve Their Technical Analysis Skills and Their Trading By Understanding How To Analyze The Market Using Multiple Timeframes and Understanding The Bigger Picture on the Charts

USDJPY | Supply zone rejection 💣📉Price ran out internal liquidity, tapped into a refined supply zone, and showed early signs of distribution. Entry taken post-confirmation at the mitigation of the order block, with a clean R:R toward the next demand zone.
🔹 BOS + Liquidity Grab
🔹 Supply Zone Rejection
🔹 Premium Pricing Entry
🔹 Targeting unmitigated demand below (HTF imbalance)
Setup is built around smart money principles—waiting for price to deliver the sell-off. Clean and mechanical.
#SMC #USDJPY #SmartMoney #LiquiditySweep #FXTradingClub #MarketStructure

EURUSD Technical Analysis**Chart Overview:**
* **Pair:** EUR/USD
* **Timeframe:** 30-minute
* **Trend:** Bearish (Confirmed by lower highs, lower lows, and downward-sloping trendline)
---
🔍 **Technical Analysis :**
**1. Downtrend Structure**
* Price is consistently making **lower highs and lower lows**, confirming a **strong downtrend**.
* A clear **descending trendline** is respected multiple times as resistance.
**2. EMAs (7, 21, 50)**
* All EMAs (blue, purple, black) are sloping downward.
* Price is trading **below all EMAs**, signaling continued bearish momentum.
* EMA 50 (\~1.1716) acts as a **dynamic resistance** zone.
**3. Key Resistance Zones (Marked as R1 & R2)**
* **R1 Zone (\~1.1710–1.1720):** Previous support now turned resistance. Could see rejection here.
**R2 Zone (\~1.1730+):** Higher resistance, possibly tested if R1 breaks. Also aligns with EMA confluence.
**4. Volume Analysis**
* Volume shows **spikes on bearish candles**, which suggests **strong selling interest** at lower highs.
* No significant bullish volume breakout so far.
📈 **Price Projection Path (Red Arrows)**
* The red path illustrates a **bearish price projection**:
* Price may pull back into **R1 or R2**
* Likely to face **resistance & rejection** from those levels
* Expected to make **lower highs and resume downside movement**
* Potential drop toward **1.1670, 1.1650, and lower**
🟢 **Bullish Invalidator**
* If price **breaks and holds above R2 (\~1.1735+)** with volume, it may indicate a **trend reversal or bullish correction**.
---
**Summary:**
* **Bias:** Bearish
* **Resistance Zones to Watch:**
* R1: 1.1710–1.1720
* R2: 1.1730–1.1740
* **Targets on Downside:**
* 1.1670
* 1.1650 or lower
* **Confirmation Needed:** Bearish rejection candles or failure to break R1/R2

GBPCAD bearish for expect
OANDA:GBPCAD last 4 ideas on this pair attached, we are have one strong fall, price is make few pushes on sup zone (violet doted), which taking for legal zone, currently price in ASCENDING TRIANGL better visible on 15TF (will make in note), expecting break of same and higher bearish continuation.
SUP zone: 1.85750
RES zone: 1.84500

EURUSD AccumulationI am looking for some accumulation here. The model can already be complete, but i would only take it if it extends into a model 2 from extreme liquidity to create more liquidity for a reversal. The supply above, followed by the strong sell off lowers the quality of this model. A supply mitigation with a slow pullback into the POI would change that.
USDJPYUSDJPY ADVANCED OUTLOOK
US10Y=4.348% WEEKLY HIGH 4.436%
DXY=97.664$ weekly low 96.871
FED INTEREST RATE HELD STEADY LAST MEETING BY FOMC VOTE 4.25%-4.5%
Heads of the Federal Reserve (Fed) and Bank of Japan (BOJ)
Federal Reserve (Fed)
Chair: Jerome H. Powell
Term: Powell has served as Chair of the Board of Governors of the Federal Reserve System since February 5, 2018. He was reappointed for a second four-year term on May 23, 2022, which is set to run until May 2026.
Background: Powell is an American investment banker and lawyer, known for his consensus-building approach and steady leadership during periods of economic uncertainty. He has been a member of the Board of Governors since 2012.
Bank of Japan (BOJ)
Governor: Kazuo Ueda
Term: Kazuo Ueda has served as Governor of the Bank of Japan since April 2023. He is a distinguished academic with a PhD in economics from MIT and has guided the BOJ through its recent policy normalization and interest rate increases.
Key Executive: Koji Nakamura was appointed as the BOJ’s Executive Director overseeing monetary policy and financial markets in April 2025, supporting Governor Ueda in policy implementation.
BOJ ( BANK OF JAPAN) 10 year bond yield
JP10Y=1.491% HIGH FOR THE WEEK 1.515%
BOJ INTEREST RATE =0.5%
Interest Rate Differential:
US Federal Reserve rate: 4.25%–4.50%.- BOJ 0.5%=3.75%-4%
the interest rate differential favor USD LONG
Bank of Japan (BoJ) rate: 0.5% comes in higher giving yen a shot advantage ,on monthly TF USDJPY remains bearish.
10-Year Bond Yield Differential:
Us10y 4.35% -JP10Y 1.515%= 2.835%
The bond yield spread continues to favor the dollar, attracting capital to US assets.
Monetary Policy Outlook:
The BoJ remains cautious, signaling a slow pace of further tightening.
The Fed is expected to maintain higher rates in the near term, though some easing is anticipated later in 2025.
Technical and Fundamental Summary
Trend: USD/JPY remains in a bullish trend, we will have upside potential if US yields stay elevated and BoJ remains dovish.
the monthly TF remains bearish and its something to watch.
The USD/JPY pair is expected to remain supported above 145 as long as the interest rate and bond yield differentials favor the US.
Upside risks exist if US economic data outperforms or if the BoJ maintains its cautious stance.
Downside risks could emerge if the Fed signals faster rate cuts or if there is a significant shift in risk sentiment favoring the yen.
In summary:
USD/JPY is trading near 146.231, with the US dollar supported by higher interest rates and bond yields relative to Japan. The pair’s direction will remain sensitive to central bank policy signals and global risk sentiment in the coming weeks.
1. Uncovered Interest Rate Parity (UIP) –
Uncovered Interest Rate Parity (UIP) is a fundamental theory in international finance and foreign exchange markets. It states that the difference in interest rates between two countries should equal the expected change in their exchange rates over the same period. The concept assumes no arbitrage opportunities and that investors are risk-neutral.
Implication:
If one country has a higher interest rate, its currency is expected to depreciate by the same amount as the interest rate differential.
Carry Trade:
If UIP holds, there is no excess return from borrowing in a low-interest currency and investing in a high-interest one, as exchange rate movements offset the interest rate advantage.
Covered vs. Uncovered:
Covered Interest Rate Parity (CIP): Uses forward contracts to hedge exchange rate risk.
Uncovered Interest Rate Parity (UIP): No hedging; relies on expected spot rates.
Example:
If US rates are 4.5% and JPY rates are 0.5%, UIP predicts the US dollar will depreciate by 4% against the JAPANESE YEN over the period, making returns equal after accounting for currency changes.
Given the USD interest rate of 4.5% and the Bank of Japan (BOJ) interest rate of 0.5%, the Uncovered Interest Rate Parity (UIP) and Covered Interest Rate Parity (CIP) conditions is as follows:
1. Uncovered Interest Rate Parity (UIP)
UIP states that the expected change in the spot exchange rate between two currencies equals the interest rate differential between those countries. In other words, the currency with the higher interest rate is expected to depreciate relative to the currency with the lower interest rate by roughly the interest rate differential.
Interpretation:
Since the USD interest rate (4.5%) is higher than the BOJ rate (0.5%), UIP predicts that the USD will depreciate against the JPY by approximately the interest rate differential of 4.0% annually.
This means that although USD offers higher yields, investors expect the USD to weaken relative to JPY over the investment horizon, offsetting the higher interest return.
2. Covered Interest Rate Parity (CIP)
CIP states that the forward exchange rate should adjust to offset the interest rate differential, eliminating arbitrage opportunities by using forward contracts to hedge exchange rate risk.
With USD rates higher than JPY rates, the USD is expected to trade at a forward discount relative to JPY, meaning the forward USD/JPY rate will be lower than the spot rate to compensate for the higher USD interest rate.
This ensures no arbitrage profit from borrowing in JPY and investing in USD while hedging currency risk.
This implies the forward rate is about 151.82 USD/JPY, higher than the spot rate, indicating a forward premium on USD relative to JPY.
Note: This suggests USD is trading at a forward premium, which contradicts the earlier interpretation. This discrepancy arises because in USD/JPY quoting, USD is the base currency and JPY the quote currency. The direction of the interest rate differential effect depends on the quoting convention.
Important Clarification on Quoting Conventions:
USD/JPY is quoted as Japanese yen per 1 US dollar.
When the domestic currency is USD, and foreign currency is JPY, the formula applies as above.
Since USD interest rates are higher, the JPY is trading at a forward discount relative to USD, meaning the forward USD/JPY rate is higher than the spot rate (USD is expected to appreciate).
Summary:
Aspect Result / Interpretation
Interest Rate Differential USD 4.5% vs. JPY 0.5% → 4.0% differential
UIP Prediction USD expected to appreciate against JPY by ~4% (due to quoting)
CIP Forward Rate Forward USD/JPY rate > Spot rate (USD at forward premium)
Carry Trade Borrow in low-rate JPY, invest in high-rate USD to earn carry
Conclusion:
With USD interest rate at 4.5% and BOJ rate at 0.5%, the covered interest rate parity (CIP) implies the USD will trade at a forward premium against JPY, i.e., the forward USD/JPY rate will be higher than the spot rate by roughly the interest rate differential.
The uncovered interest rate parity (UIP) suggests that investors expect the USD to appreciate against JPY by about 4% over the investment horizon, compensating for the higher USD interest rate.
This supports typical carry trade strategies where investors borrow in low-yielding JPY and invest in high-yielding USD assets, profiting from the interest differential.
#usdjpy #dollar #yen #jpy

USD/JPY Possible Bear Scenario🔍 Analysis Summary:
USDJPY has failed to close above 146.1 on the weekly for the past 13 candles, showing clear signs of price exhaustion at this level. Price has also tapped into a marked 8HR bearish order block and printed a Daily Pin Bar — a strong reversal signal indicating potential downside.
📍Key Technicals:
• Resistance Holding: 146.1–146.6 zone
• Bearish Rejection: Pin Bar off resistance + order block
• Risk Area (Stop Zone): Above 147.16
• Target Zones: 144.2 (interim) → 142.4 (swing level)
🛠 Confluence:
• Order block rejection
• Multi-week resistance
• Clean structure with defined R:R
• Bearish candlestick confirmation
📊 Timeframe: 8HR
📉 Bias: Short
🔐 Risk Management: Proper stop loss in place above structure. Use personal risk limits.
⸻
⚠️ Disclaimer:
This setup is for educational and informational purposes only. It is not financial advice or a recommendation to trade. Always conduct your own analysis and use risk management based on your personal trading plan.

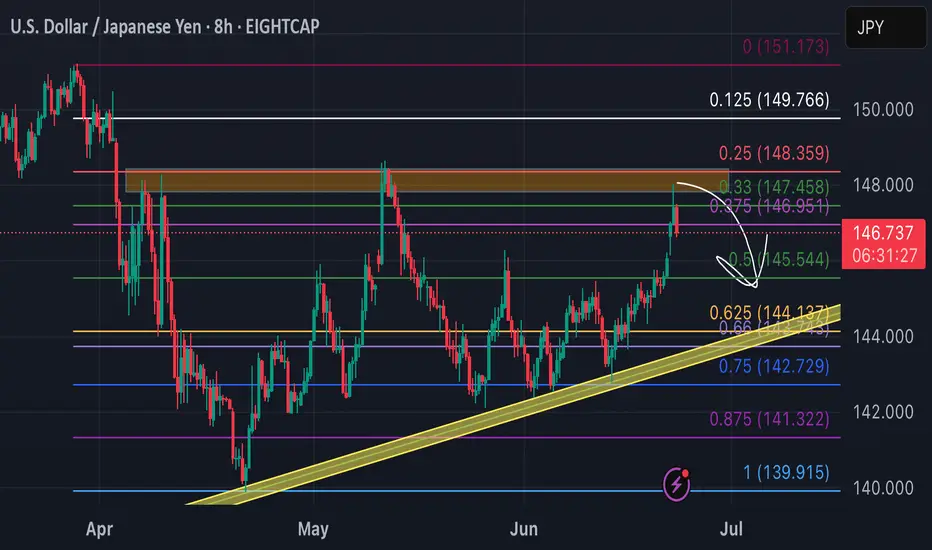
back to daily support USDJPY touched 148 this morning ahead of US PMI.
According to methodology
1. Resistance Zone:
• The 0.125 level (147.820) acted as a resistance point where selling pressure overwhelmed buying pressure, causing the price to reverse downward. Since the price reached 148.000 (just above 147.820), it tested and failed to sustain above this level, reinforcing its role as a barrier.
2. Daily Support
•The daily support trend line (yellow box) has been an area to watch as price continues to try and get over the 148 hump. Until then, this pair is going to wedge until a break confirmation.
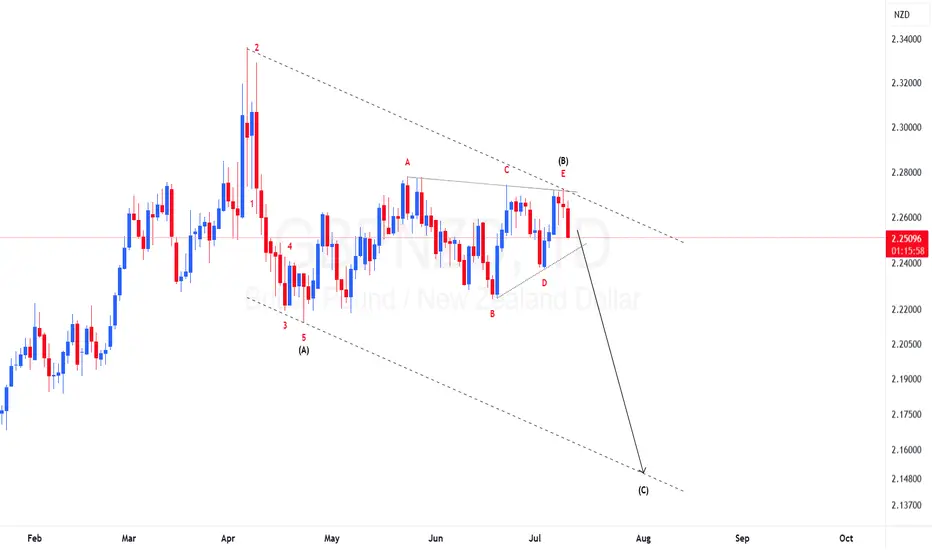
GBPNZD Elliot waves forecastPrice made impulsive move to the downside followed with a triangle correction, since triangles will only appear in 4th wave and as wave B or X in corrections then I am expecting price to continue to drop to complete this zigzag correction before resuming bullish momentum. To take advantage of the bearish move one should find area of resistance to short the market.
AUDCAD Holding at Support – Possible Move UpAUDCAD seems to be sitting on a strong support level. From this point, I think the price could start moving up. If buyers come in, we might see the market go higher in the next few days.

EUR/CAD Bears are getting strongerHI Traders.
I think when we develop more LTF correction there is a good chance that we will at least reach the buttom of the structure. I havent entered the posiition yet because i was already envolved in a EUR PAIR. But this is running in profit so i consider to enter one more when the setups plays out.

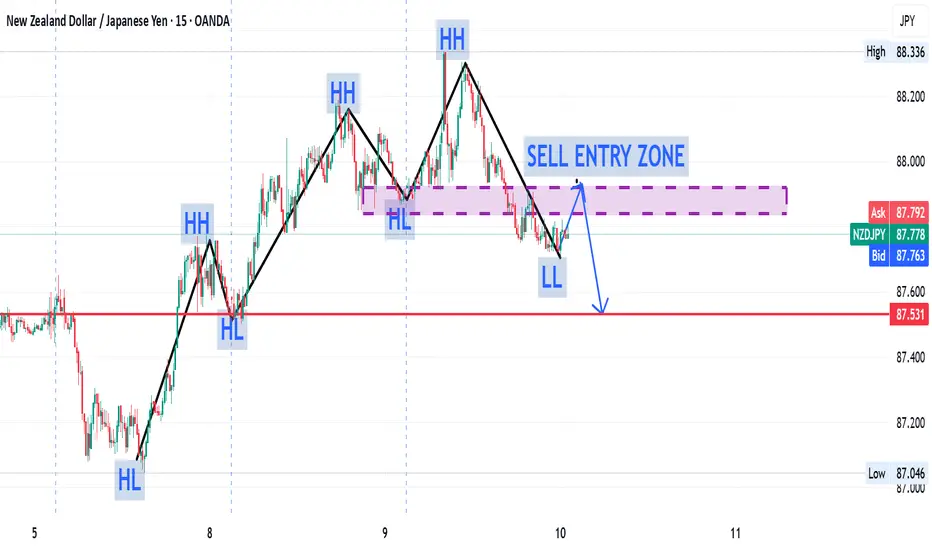
NZDJPY SELLDetailed NZD JPY forecast as well as a New Zealand Dollar Japanese Yen technical analysis through moving averages, buy/sell signals, and common chart
EUR/AUD Bearish Move confirmedHi Traders,
I already entered after the breakout
from the first correction but maybe if
some LTF Correction develops there is
more Opportunity to get into this Trade.

EURJPY–trend continuation, engulfing candle .. the week of 14/07Friday’s candle engulfed 2 previous days of price action. I interpret this as strongly bullish, especially since this happened in an already nicely bullish trend. However, the room to the upside it not unlimited - the ATH is at 175.421. We are likely to see sideways price action there due to some profit taking and maybe even some selling. IMO there are 2 possible options to get a 2R return:
- we may get a pullback before the bullish trend resumes.
- we drop down to the H1 chart and look for an opportunity to go long.
Either way, in my opinion, the trade should be closed before the ATH.
This is not a trade recommendation; it’s merely my own analysis. Trading carries a high level of risk so carefully managing your capital and risk is important. If you like my idea, please give a “boost” and follow me to get even more.

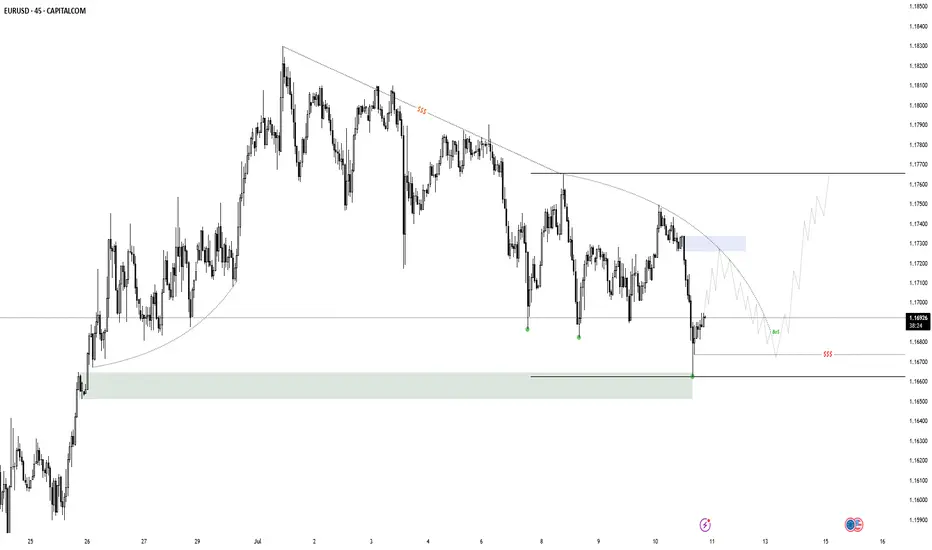
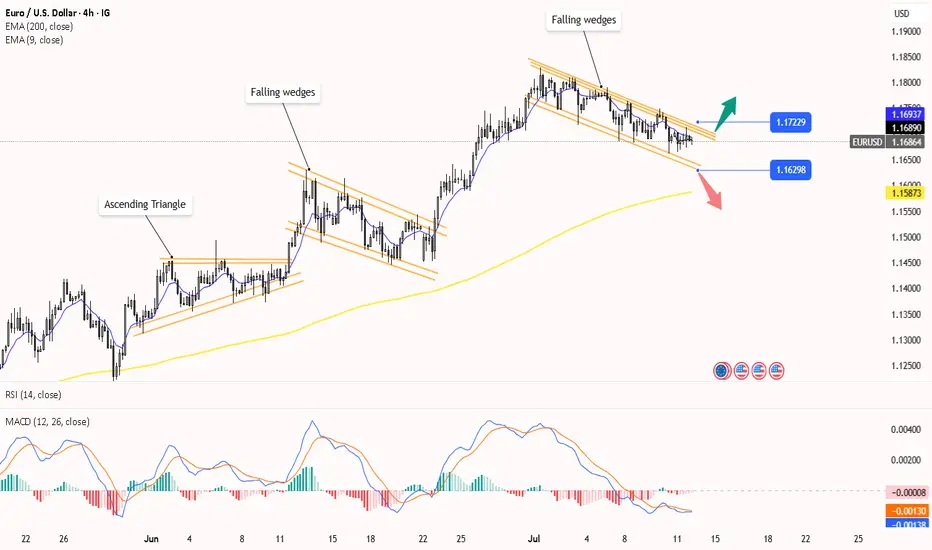
EUR/USD Falling Wedges Forming. Breakout Expected?Hello Traders,
Falling wedges can be seen in Eurusd chart and price is expected to breakout.
Wait for the price to break 1.17229 to go long or if it breaks below 1.1629 consider short.
This analysis is solely based on chart patterns and some indicators like MACD, RSI and Moving Averages.

EURAUD Weekly Trade Setup(14 to 18th July 2025) - Head&ShoulderThis week, EURAUD (Euro/Australian Dollar) has entered a critical price zone, providing a textbook technical opportunity for traders. A clear Head & Shoulders pattern has formed on the 4-hour chart, pointing toward a potential trend reversal from bullish to bearish.
Let’s explore how to trade this intelligently from both bullish and bearish perspectives.
1. Bearish Setup – Head & Shoulders Pattern Breakdown
This is the primary trade idea for the week.
✅ Trade Logic:
Price has completed a classic Left Shoulder → Head → Right Shoulder formation.
The neckline (support) will be tested.
The current price is will pulling back to retest the right shoulder resistance zone, offering an ideal short opportunity.
🔻 Entry Plan:
Wait for bearish reversal confirmation (candlestick rejection or bearish engulfing) on the 1H or 4H timeframe.
Enter short once confirmation appears near 1.7850–1.7900.
📉 Stop Loss:
Place SL above the right shoulder high, adjusting for volatility and swing high (around 1.7950).
🎯 Targets:
Target zone: 1.7450–1.7500 (profit booking zone marked on the chart)
Potential Risk/Reward Ratio: 1:2, 1:3, or even 1:4+
2. Alternative Bullish Setup – Reversal at Neckline (High Risk)
This setup is for experienced or aggressive traders who spot early reversals.
✅ Trade Logic:
Price may bounce from the neckline and 200 EMA support area.
If this happens, a temporary bullish reversal may push price back toward the right shoulder zone.
🔺 Entry Plan:
Wait for bullish confirmation (reversal candle) near the neckline and EMA support (around 1.7700).
🚨 Stop Loss:
SL must be below the neckline swing low (around 1.7650).
🎯 Targets:
Resistance zone (right shoulder): 1.7850–1.7900
R:R setups of 1:2 or 1:3 possible
⚠️ This is considered a counter-trend trade and should be traded with caution.
3. Technical Confluence and Indicators
Pattern: Head & Shoulders (bearish reversal)
EMA 200: Price reacting around the long-term trend line
Support/Resistance: Cleanly defined horizontal zones
Reversal zones: Highlighted in red (supply) and green (demand)
4. Final Thoughts
This week’s EURAUD setup is a strong example of structure-based trading. With a well-formed head and shoulders pattern and a clean neckline break, the market signals a shift in momentum.
Safe Approach: Trade the short side after resistance rejection.
Risky Approach: Try a long on neckline bounce with tight SL.
Always confirm with your system and maintain strict risk management. Trade what you see, not what you feel.
Ready to trade? Save this setup, monitor price action, and execute only with confirmation.
=================================================================
Disclosure: I am part of Trade Nation's Influencer program and receive a monthly fee for using their TradingView charts in my analysis.
=================================================================
