July 21 Special Update : Metals, SPY & More. What's Next.This special update is to highlight why I continue to believe traders should stay very cautious of this rally in the SPY/QQQ/BTCUSD.
Underlying economic data suggest that this is one big speculative rally following the April Tariff collapse.
And, the economic data I see from my custom indexes sugg
ETF market

Bearish DivergencesWe could be running out of steam here. This to me looks like the final leg of the grand supercycle in semis. Bearish divergences on the RSI and a final 5th wave move up. If we reach $300 I’d expect a rejection and possible roll over. Keep an eye on this, retail are loading up but the charts don’t su

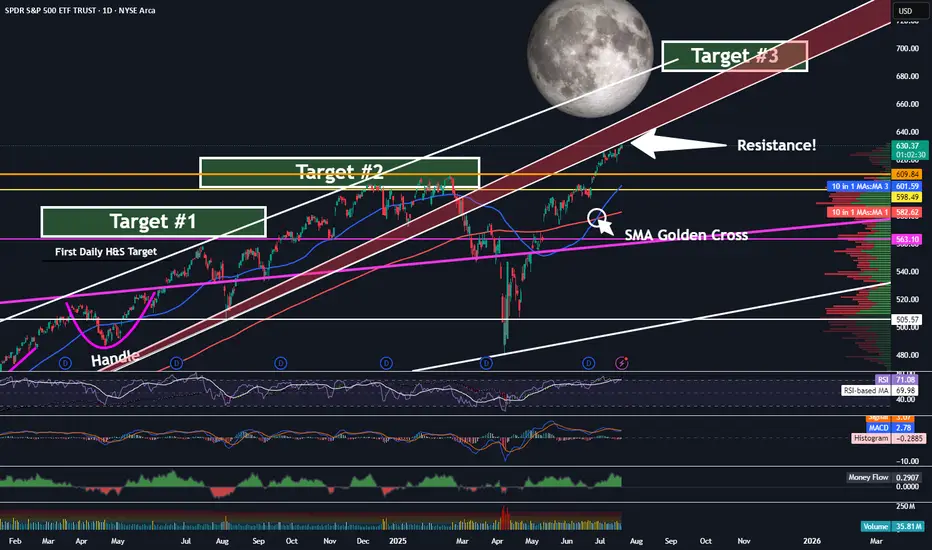
SPY - On Our Way To Target 3 ...But First?Trading Fam,
It's been a while since I updated you all on the SPY, which, as you know, we track closely to help us determine the overall market trend. Since we have now exceeded my Target #2, it's time for me to give you all another update. But first, a little context for my new readers which I hav
MSOS Long with 150% Upside - Cannabis Rescheduling Catalyst💠 Catalyst : Cannabis is currently classified as a schedule I drug alongside heroin, bath salts, and synthetic opioids that kill thousands every year — all while being safer than Tylenol and legal in over half the country. Cannabis is likely to be rescheduled to a schedule III drug soon after Terry

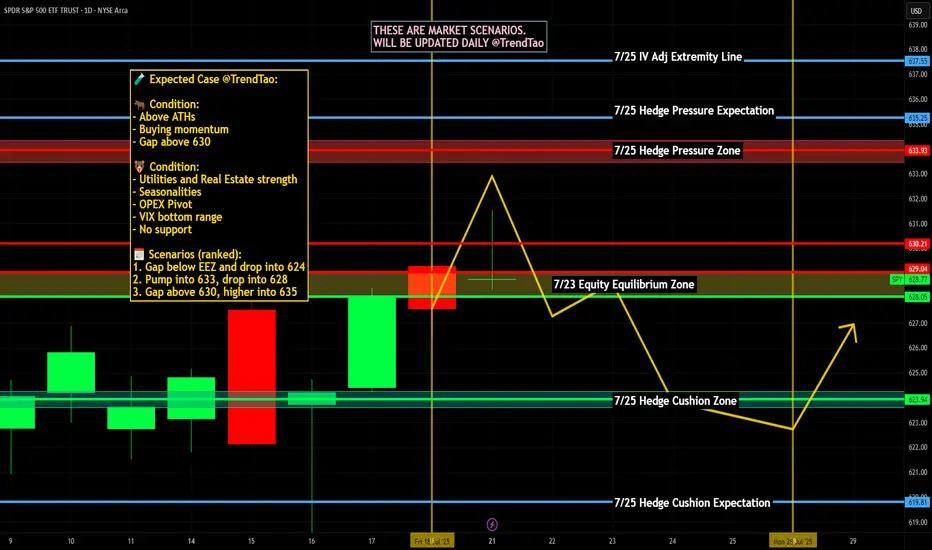
Nightly $SPY / $SPX Scenarios for July 22, 2025🔮 Nightly AMEX:SPY / SP:SPX Scenarios for July 22, 2025 🔮
🌍 Market-Moving News 🌍
🚀 Tech & EV Stocks in Focus Ahead of Earnings
Futures were quiet ahead of Tuesday’s open, but key movers included Astera Labs (+19%), Alphabet (+2.7%), Netflix +2%, and Robinhood –4.9% after being passed over for t
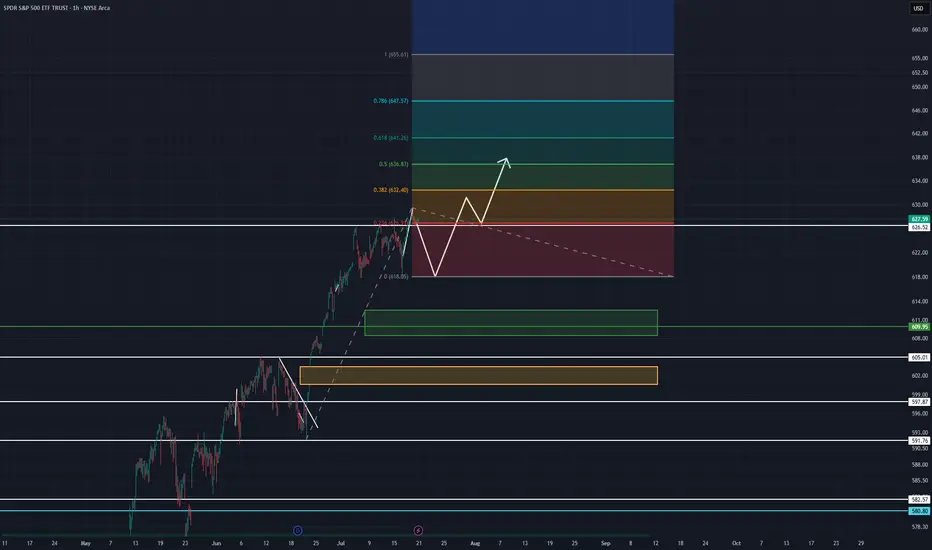
SPY July 21-25AMEX:SPY
Looking at the 4 hr. timeframe on SPY. Bearish divergence is signaling a need for some cool off. I assume this will happen almost immediately, Monday maybe into Tuesday. I expect to keep above strong support levels at 618 and 609.95. Drops below 609 will change my stance to a more beari
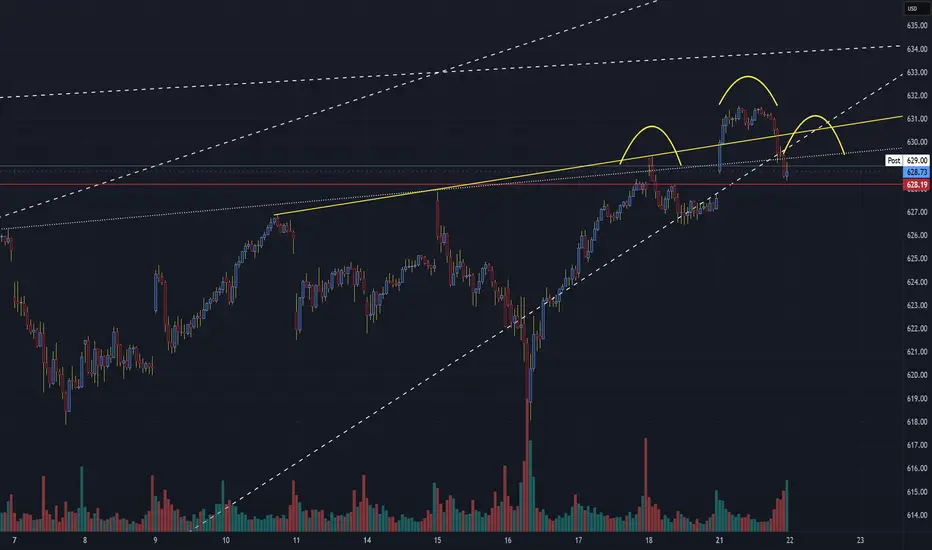
SPY Forming A Bearish Head and Shoulders PatternSPX Technical Update – Bearish Watch
Chart Focus: S&P 500 Index (30-Min Chart)
Date: July 21, 2025
🧠 Pattern Watch: Classic Head & Shoulders Formation
A clear head and shoulders pattern has emerged on the short-term 30-minute chart, signaling a potential bearish reversal after the recent uptrend.
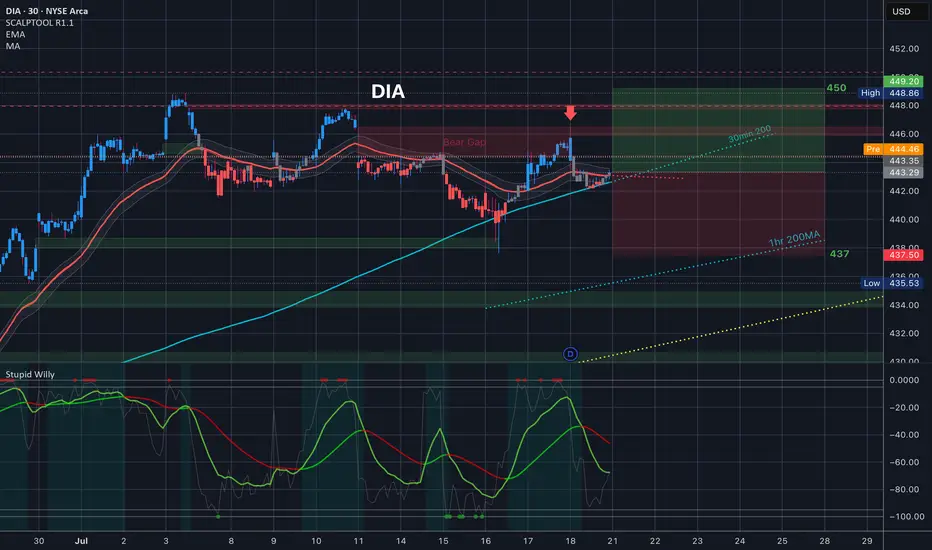
$DIA Trading Range for 7.21.25 and everything in itThis is the trading range for the week and everything in it. How are you playing it?
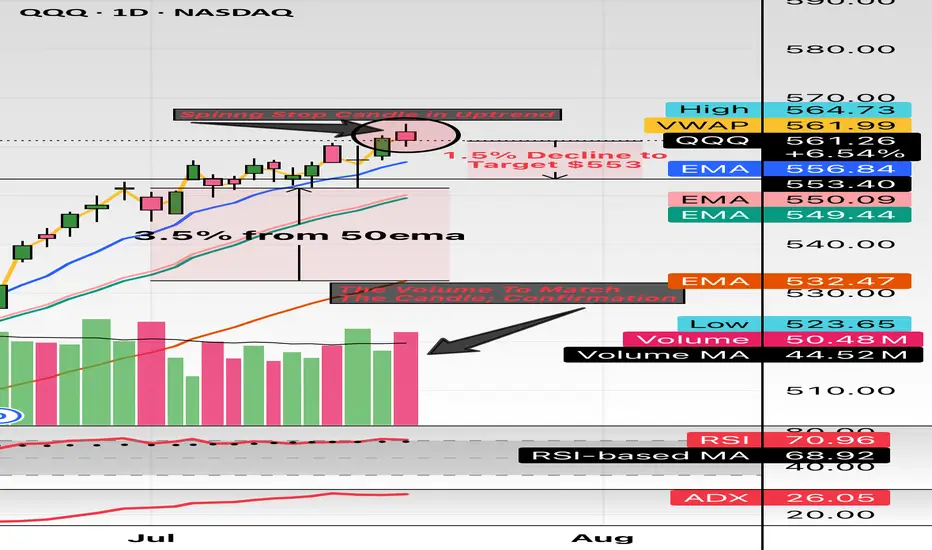
$QQQ this might the spot. Hello and good night, evening, afternoon, or morning wherever you may be. I have been looking at names all day and I wanted to check the indexes: NASDAQ:QQQ and $SPY.
Here we have the indexes up almost 30% from the April lows and sitting about 10% YTD. The candle highlighted is the spinning stop
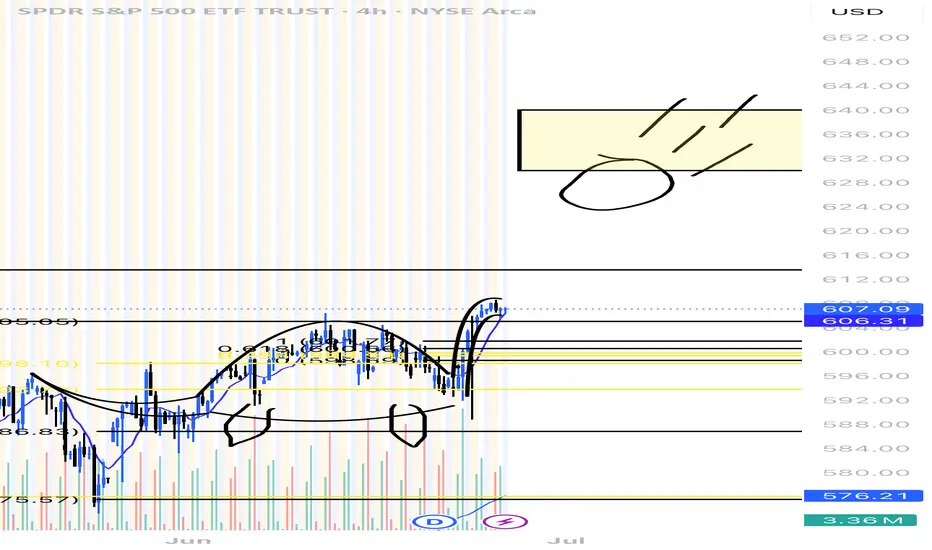
Dinosaur gets hit by a meteor We can see a clear breakout from previous lows only target left is that meteor at 630-640.
We will see this by the end of july!
See all popular ideas
Community trends
SymbolPrice & chgNAV total return 1Y
SymbolNAV total return 1Y / Price
SymbolPrice & chgDividend yield FWD
SymbolDividend yield FWD / Price
ETF collections
LargestHighest AUM growthHighest returnsBiggest losersEquityBitcoinEthereumGoldFixed incomeReal estateTotal marketCommoditiesAsset allocationInverseLeveragedMost tradedLargest inflowsLargest outflowsHighest discount to NAVHighest premium to NAVHighest yieldDividendMonthly distributionsHighest diversificationActively managedSectorHighest betaLowest betaNegative betaHighest expense ratioAll-time highAll-time low52-week high52-week lowETFs of the USAETFs of CanadaETFs of the United KingdomETFs of GermanyETFs of JapanETFs of AustraliaSee all