XLV BreakoutThe XLV is breaking out after testing the $147-$148 area as resistance since late February. It finally broke out recently and came back down to retest the area as support yesterday, successfully. 1st Upside target is $157, followed by $162 for a secondary target. As markets are falling this week, healthcare typically does well in a bear market, so this breakout makes sense. Also, volume has gone up with the breakout, confirming price action
ETF market

The Big Banks are in BIG TROUBLEAs you can see on this weekly chart, the XLF has been in this steady up trend since October 2023. It bounced off this upward slopping trendline 3 different times and then finally broke through it on the 4th hit, then came back up to test the underside of the trendline as resistance. It did get back above the trendline briefly last month, but it ended up being a bull trap as it fell back below the trendline and is now testing it as resistance once again and is currently being rejected. A Fibonacci retrace shows the 0.786 fib level also lines up with this area giving added confluence, as well as RSI divergence that I have highlighted. Massive Massive resistance in this area and so much room for potential downside. I see this trade as an extremely high probability of playing out. The options market agrees with me as well.

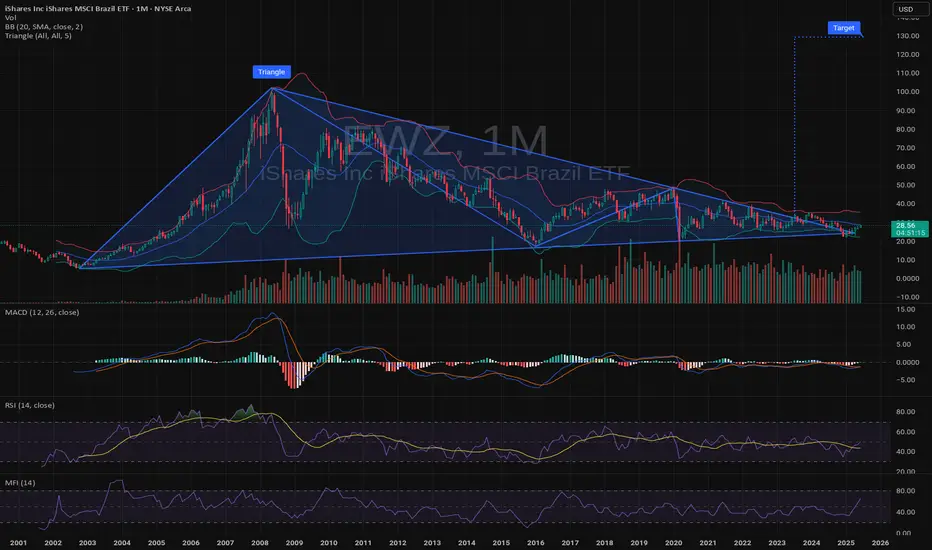
$EWZ LongAMEX:EWZ
I'm long on this. I'm long on international products in general.
I think their time is coming due.
NYSE:NU is a big component of $EWZ. So I get a bit of it as well as other parts.
Of course the charts are just Pictures and may or may not go in the direction as intended.
cheers
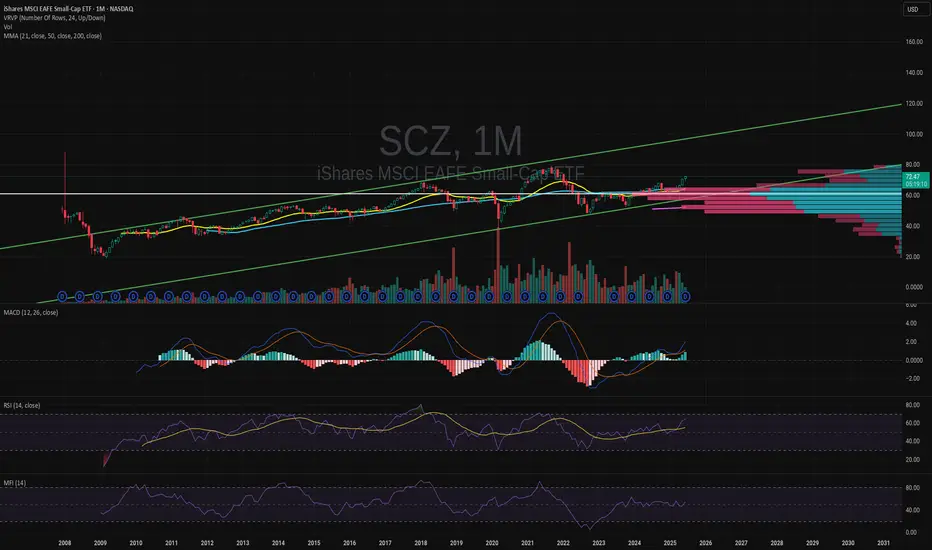
$SCZ Looking good. LongNASDAQ:SCZ
With it's relatively strong outlook, it would suggest good investment opportunities in foreign Small Caps. I like this as I think there is a lot of growth potential outside of the USA.
I don't have this yet. But I'll try to acquire.
cheers.
just my $0.00002
Preponderance of (or Preposterous?) Evidence
I was just proposing yesterday staying neutral in SPY (the S&P 500 ETF). The FOMC meeting today (Jun 18th) was a big-nothing burger (so far), which supports my (non)position, but we'll see. I will update that post when the time is right (ATH, 200dma, or bust).
Today, though, the IWM (the Russell 2000 Small Cap Index ETF) and, surprisingly, a potential short position.
First, the IWM (see below) is overbought on a weekly chart, with the Stochastics being above 80 (more on Stochastics and weekly charts at a later date). For now, let's go with IWM being a little overbought, in the longer-term view.
Now, let's switch to the big daily chart at the top and look at the evidence for going short;
- IWM never really got above it's 200-day moving average (purple line),
- That same level was consistent with a lot of resistance ~213 (yellow circles),
- IWM has trailed this whole rally.
- It has broken and somewhat retested a trendline (light blue) from this most recent rally,
- It bounced off it's 61.8% Fibonacci level (orange line, not my favorite indicator for ETFs, but I often sneak a peek),
- It's at its previous resistance high around 209 (blue circles).
On the not-bearish side;
- The daily chart is less overbought (this has to happen on weakness, though),
- There's (a little) support at 199 but not really again until 172,
- I still feel like the All-Time-High (ATH) is a magnet for the S&P (but IWM has trailed).
That's (a lot) more (and better) points for being bearish.
I'll go short (via a ~90 day ITM put position*) if IWM breaks below 207.50, between that and 202. If it opens lower than 202, I'll wait for a pull-up.
The stop will be a close above the 200 day.
The target is 172 (the previous tariff low), but I will lighten/tighten up (by selling OTM puts* and/or moving stop down) as IWM drops (if it drops).
It may seem a bit duplicitous to be neutral on SPY while being bearish on IWM.
But sometimes you have to go with the Preponderance of Evidence (or will it prove Preposterous Evidence?)
An update will be coming.
*Sorry for bringing up options. One can just go short IWM. I will explain my option choice one day.
My ideas here on TradingView are for educational purposes only. It is NOT trading advice. I often lose money and you would be a fool to follow me blindly.

SPY/QQQ Plan Your Trade For 6-30-25 : Gap Potential PatternToday's pattern suggests the SPY will attempt to create a GAP at the open. It looks like the markets may attempt to move higher as the SPY is already nearly 0.35% higher as I type.
Last week was very exciting as we watched the QQQ and the SPY break into new All-Time Highs.
I suspect the markets will continue a bit of a rally into the early Q2 earnings season where retail traders attempt to prepare for the strong technology/innovation/AI earnings data (like last quarter).
I do believe this rally is due for a pullback. I've highlighted this many times in the past. Typically, price does not go straight up or straight down. There are usually multiple pullbacks in a trend.
So, at this point, the markets are BULLISH, but I still want to warn you to stay somewhat cautious of a pullback in the near future (maybe something news-related).
Gold and Silver should start to move higher over the next 5-10+ days, with gold trying to rally back above $3450. I see Gold in a solid FLAGGING formation that is moving closer to the APEX pattern.
Bitcoin is nearing a make-or-break volatility point. I see BTCUSD breaking downward, but it could break into a very volatile phase where it attempts to rally (with the QQQ through earnings), then collapse later in July. We'll see how things play out.
Remember, tomorrow morning I have a doctor's appointment. So I may or may not get a morning video done. FYI.
Get some today.

Market Update - 6/29/2025- Strong close on Friday especially in consumer related names
- Most excited about retail/consumer/DTC names, especialy NASDAQ:ODD , NASDAQ:NAGE , $YSG.
- AI names are back on the radar, and quantum computing has been for a while -> speculation money is back
- Breadth and market in general looks very constructive, so we will likely continue going higher
- Been very protective with my account, keeping losses below 0.1% as the market has been choppy since May 12
- However, if we start another leg higher, I'll go much more aggressive, maybe 0.5-1% of my account in strong names

Market BreadthMarkets are still in 'Bull' mode going into the 4th. Keeping a eye on the 9-EMA which I use as a trailing stop on my long positions. Not likely to pick up any new positions for now.

SPY Rejected at Gamma Wall–Watch $610 Breakdown or $615 Reclaim🧠 GEX-Based Options Sentiment:
SPY closed Friday with a rejection off the Highest Positive Net GEX / Gamma Wall at $615, with sellers defending the upper structure near the 2nd Call Wall at $620.
Support now lies in the $608–$604 range, with $605.54 and $604.45 aligning with GEX magnets and prior structure. Below that, there’s a gap to the HVL zone near $599, and the gamma floor starts deep around $591, which is also defended by the 2nd and 3rd PUT Walls.
Implied Volatility Rank is 12.2, with IVX below average. This implies premium selling could be dominant unless we break key levels. Meanwhile, PUT flow dominates at 31.9%, showing a clear defensive posture by institutions.
🔧 Options Trade Setup (for Monday–Wednesday):
Bearish Setup:
If SPY confirms under $610, especially during the first hour Monday, it could trigger a fade toward $605 or even $599 HVL.
Consider a PUT debit spread like 610p/600p (Jul 3).
Stop out if price reclaims $613.50–$615 cleanly.
Bullish Setup:
If SPY holds $610 and reclaims $615 with force, it can squeeze into the GEX void toward $620–$622.
Consider a CALL debit spread like 615c/620c (Jul 3).
Stop if price breaks back under $610 with volume.
📉 Intraday Technical Breakdown (1H Chart):
We now have back-to-back CHoCHs printed below rising wedge structure, followed by a failed retest at the top. This is a textbook sign of exhaustion. The final BOS and CHoCH from Friday confirmed that buyers lost short-term control.
The current structure is rolling over with lower highs, and SPY is now trading inside a descending micro-channel after rejection at $615.
Volume picked up on the Thursday/Friday rejection, which adds weight to the downside scenario unless we open strong Monday.
📌 Key Levels to Watch:
$617.00 – Upper Gamma ceiling
$615.00 – Gamma Wall & recent supply zone
$613.50 – Mid-level rejection pivot
$610.00 – Structure support now under threat
$608.48 – Intraday gamma magnet
$605.54 / $604.45 – Strong confluence support zone
$599.49 – HVL target zone
$591.90 – Gamma floor if broader selloff triggers
✅ Thoughts and Monday Game Plan:
SPY looks vulnerable under $610 — this is the most important level to watch. If that breaks and holds below in the first 30–60 minutes, we likely fade to $605 or lower.
The ideal trade setup would be to short the retest of $610 from below, or buy PUTs on confirmed weakness into the gamma air pocket. Alternatively, wait for a high-volume reclaim of $615 to trade with the bulls, but until then, the path of least resistance is down.
Macro catalysts are light, but pre-holiday positioning could bring volatility — stay nimble.
Disclaimer:
This analysis is for educational purposes only and not financial advice. Always use proper risk management and trade with a plan.

Weekly $SPY / $SPX Scenarios for June 30 – July 3, 2025🔮 Weekly AMEX:SPY / SP:SPX Scenarios for June 30 – July 3, 2025 🔮
🌍 Market-Moving News 🌍
📈 US Stocks Rally to Record Highs
Following a volatile first half, U.S. equities surged into record territory in late June on a combination of easing Middle East tensions, cooling inflation data, and the 90-day tariff pause
💵 Dollar Weakens on Fed and Trade Uncertainty
The U.S. dollar fell to a 3½-year low, pressured by persistent speculations over President Trump replacing Fed Chair Powell and extending rate-cut expectations, as well as progress in U.S.-Canada trade talks
🇨🇦 U.S.–Canada Trade Talks Lift Sentiment
Canada temporarily repealed its digital services tax to facilitate talks seeking a broader trade agreement by July 21, boosting U.S. equity futures
🛢️ Oil Prices Stabilize
After spiking on geopolitical fears, oil traders settled between $65–78/bbl amid supply relief following ceasefire developments and easing Middle East risks
⚠️ July Risks Loom
The coming week will spotlight:
July 4 deadline for Trump’s tax bill
Expiry of the tariff pause on July 9
U.S. Nonfarm Payrolls on July 3
Each poses potential for increased volatility if outcomes disappoint
📊 Key Data Releases & Events 📊
📅 Monday, June 30
9:45 AM ET – Chicago PMI (June): Gauge of Midwestern factory activity
📅 Tuesday, July 1
U.S. markets open, watch trade developments
📅 Wednesday, July 2
Global PMI readings released
📅 Thursday, July 3 (Early close ahead of Independence Day)
8:30 AM ET – Nonfarm Payrolls (June)
8:30 AM ET – Unemployment Rate (June)
8:30 AM ET – Average Hourly Earnings (June)
These labor metrics will be critical for Fed rate outlooking
⚠️ Disclaimer:
This information is for educational and informational purposes only and should not be construed as financial advice. Always consult a licensed financial advisor before making investment decisions.
📌 #trading #stockmarket #economy #jobs #Fed #oil #trade #technicalanalysis

~ June 19th 2025 - S&P 500 SPY ...new all time high ...S&P 500 SPY broke recent resistance 604.45 & closed above Feb 19th/ 25 all time high of 613.23 on Friday. Will be watching the open on Monday .... specifically Friday's all time high closing number 614.91

IBIT: End of June/Beginning of July Weekly idea for IBIT.
BTC and this market as a whole is an interesting character.
The indicies and many other things, such as BTC, AMD etc. are all throwing top signals, specifically mean reverting signals (when using Pairs / Cointegration and Time series).
They have been for the last 1.5 weeks.
These signals have yet to be invalidated, they are only invalidated once they stop signaling or flip to bullish. So we are lingering on a potential for a larger pullback from where we are, and that extends to indicies such as NDX, SPX and BTC itself.
That said, its a bit trickier when we push into extreme greed where the market currently rests.
For IBIT and BTC, the outlook is on the bearish side; however, with some bullish continuation patterns (on the smaller timeframes) that bring us to some more immediate upside into Monday.
The expectation here is a move up to around 61. From there, if we see rejection we should be heading down to around 58.57.
The downside and upside targets are listed in the chart.
Its hard to play the PA in this market because its extreme greed that has a hallmark of random impulse selling and random rug pulls out of nowhere that complete in a day and lead to aggressive gapping up the next day. Its hard to really offer much insight in a safe fashion in this type of market.
However, the general "how its sposta work" is if we break over 61 and hold, we should be heading up to 63 ish range. Vs a 61 rejection or just hitting shy of 61 will bring us down to that 58 zone.
Not advice, its impossible to offer advice in these conditions anyway haha.
Safe trades!

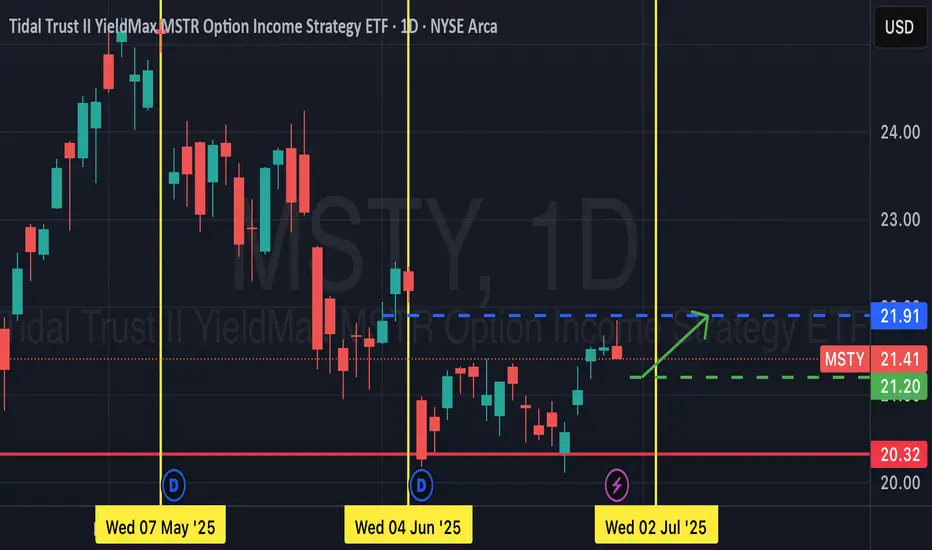
Msty pull back/ dipMsty has a monthly dividend noted by the yellow vertical line. The ex dividend date typically drops, so buying at a favorable price before that ex date is crucial. The chart shows a double bottom followed by a strong bullish movement. This coming week will give a small pullback for a great buying opportunity prior to the dividend announcement ex date.
SPY Technical Analysis! SELL!
My dear followers,
I analysed this chart on SPY and concluded the following:
The market is trading on 614.85 pivot level.
Bias - Bearish
Technical Indicators: Both Super Trend & Pivot HL indicate a highly probable Bearish continuation.
Target - 586.37
Safe Stop Loss - 631.68
About Used Indicators:
A super-trend indicator is plotted on either above or below the closing price to signal a buy or sell. The indicator changes color, based on whether or not you should be buying. If the super-trend indicator moves below the closing price, the indicator turns green, and it signals an entry point or points to buy.
Disclosure: I am part of Trade Nation's Influencer program and receive a monthly fee for using their TradingView charts in my analysis.
———————————
WISH YOU ALL LUCK

Weekly review of SPY, QQQ, GC, CL, ETH, BTC, UBER, TOAST, TKO, Weekly review of SPY, QQQ, GC, CL, ETH, BTC, UBER, TOAST, TKO, XLE -- June 6/30/25

$SpySo I just wanted to focus on the next 2weeks of trading..
To summarize what I think will happened
We make another high around 620 by End of this week. That high will most likely coincide either the Bill passing through senate or and the Non farm payroll coming out Thursday.
Summer melt up seasonality is in progress.
Historically the week of July 4th trades with really thin volume. Thin volume is hurts bears more than it does bulls. Imagine spy breaking back below 600 with only 50% of its normal volume (Won't happen).
The week after this is the break between this quarter and the next Q3.. this is when I expect a corrective pullback to the 20sma or 605, they'll probably blame it on some Tariff July 9th related catalyst.
2nd week of July begins Q3 and the market will move up or down or earnings. From my experience, you rarely see Armageddon in the market before big tech earnings.
So basically 620 this week at some point , 605 next week and from there Earnings season starts off with big banks.
Some more trading advice I'd give is becareful with too far OTM weekly options, I expect at least 2 of these days will be terribly choppy.
One of the main reasons I believe the market will now go higher is because of the index moves... of course you saw the how spy and Qqq made a V shape recovery, well the Dow jones and IWM are now catching up with their own V
So if the Dow has 2-3% left to pump the Spy will atleast match that pump. This move could come next week or wait until the pullback and finish during earnings but it will come.
I'll do a bigger picture and out look after next week's move.
Some trade ideas I'll post here
First one is NASDAQ:GOOGL
Channel trade here..
I think early in the week googl heads to 181.50. If market melts up later in the week then googl could see 185.00.. but like I said this is a channel trade and the ultimate tgt is 190 ish .
2nd trade
Tsla
I think it's headed back to 300.00 or 200ema
From there we will either bounce and make a Pennant or double top lower .. if you look, you'll see price has been bouncing of its 50sma for 2weeks now, so the short entry is below that
Lastly, there is not enough volume to pump all stocks this week, so some will be red and some will be green.. to avoid longing or shorting the wrong one, have patience and wait 30min-1hour after the open for true direction before you trade ..
Good luck

Fear and greed vs SPYWhen VIX crosses over SPY rapidly, it’s usually a reliable sell signal. USD and GLD added for additional fear signals as well as inflation measures.
VIX falling to baseline and SVIX returning to previous value indicates regained stability or growth for SPY (entry point)

Small SLV positionTaking a small position in SLV here.
Long term looking at the gold to silver ratio trading around 90 If gold holds its grounds and silver plays catch up to a ratio of 70 even 60. I will be playing this position less about price and more about the ratio. If slv breaks all time high I will start selling regardless of price 20% week unless price is parabolic. Then selling will be 50% per week.

Stock Market Forecast | TSLA NVDA AAPL AMZN META MSFTStock Market Forecast | CME_MINI:NQ1! CME_MINI:ES1! QQQ SPY
Mag 7 Forecast | CBOE:MAGS NASDAQ:TSLA NVDA AAPL AMZN META MSFT

SPY ATH TARGET 650Trend: Strong bullish continuation. Price just broke above the key 610 level, entering a momentum phase toward the projected 650 target.
Structure: SPY is trading inside a rising channel. The upper bound aligns with the 650 level, suggesting this is the next liquidity zone.
Support Zones:
610: Now a critical support. If it holds, buyers remain in control.
580–560: First unfilled gap — a likely magnet if price dips.
540–530: Second unfilled gap — stronger support on deeper pullback.
500–480: Major demand block — structural bottom of the current rally.
Moving Average (EMA): Price is trading above its EMA, confirming bullish momentum.
Gaps: Two visible gaps remain open below, both likely to act as magnets if bulls lose momentum.
📈 Expected Range:
Above 610 → Target: 650
Below 610 → Watch for gap fills at 580 and 540

TLT is currently in the Wyckoff accumulation phaseBased on the provided weekly and daily charts for the iShares 20+ Year Treasury Bond ETF (TLT), here is a Wyckoff analysis and a potential trading strategy using a diagonal option spread.
### **Wyckoff Analysis of TLT**
**Weekly Chart:**
The weekly chart for TLT appears to be in the early stages of a potential **accumulation phase**. Here's a breakdown of the key price action in the context of Wyckoff principles:
* **Selling Climax (SC):** The sharp sell-off culminating in the low around $83.30 can be interpreted as a Selling Climax. This is where the downward momentum peaks as panicked investors sell heavily.
* **Automatic Rally (AR):** Following the SC, the price bounced to form a high. This rally is largely technical in nature as short-covering and bargain hunting come into the market. This helps to define the upper boundary of a potential trading range.
* **Secondary Test (ST):** The subsequent decline from the AR to retest the area of the SC low is a Secondary Test. Ideally, this test occurs on lower volume than the SC, which would indicate diminishing selling pressure. From the chart, it appears there was a retest of the lows.
Currently, the price action on the weekly chart suggests that TLT is in **Phase B** of accumulation. This phase is characterized by the "building of a cause" where the "smart money" is accumulating positions. Price action in Phase B can be volatile as it moves between the support established by the SC and the resistance of the AR.
**Daily Chart:**
The daily chart provides a more granular view and supports the accumulation thesis from the weekly chart. The recent price action on the daily chart shows a series of higher highs and higher lows, which can be interpreted as a **Sign of Strength (SOS)** within the larger accumulation structure. This suggests that demand is starting to overcome supply.
### **Trading TLT with a Bullish Diagonal Call Spread**
Given the analysis that TLT is in a potential accumulation phase, a bullish long-term outlook is appropriate. A bullish diagonal call spread is a suitable strategy to capitalize on a potential gradual price increase while also benefiting from time decay.
This strategy is also known as a "Poor Man's Covered Call" and involves:
* **Buying a longer-dated, in-the-money (ITM) or at-the-money (ATM) call option.** This acts as a surrogate for owning the underlying ETF.
* **Selling a shorter-dated, out-of-the-money (OTM) call option.** The premium received from selling this call reduces the cost of the long call and generates income.
**How to structure the trade:**
1. **Long Call Selection:**
* **Expiration:** Choose a longer-dated expiration, for instance, 4-6 months out, to give the accumulation and subsequent markup phase time to develop.
* **Strike Price:** Select a strike price that is in-the-money or close to the current price of TLT (around $87.39). An ITM call will have a higher delta, meaning it will move more in line with the price of TLT.
2. **Short Call Selection:**
* **Expiration:** Select a shorter-dated expiration, typically 30-45 days out. This allows for more frequent income generation as you can "roll" the short call to the next month as it expires.
* **Strike Price:** Choose a strike price that is out-of-the-money. A good starting point would be a strike near a resistance level. Looking at the daily chart, a potential near-term resistance level might be around the $90-$92 area.
**Example Trade (Illustrative Purposes Only):**
* **Buy to open:** 1 TLT call option with an expiration 6 months from now and a strike price of $85.
* **Sell to open:** 1 TLT call option with an expiration in 30 days and a strike price of $90.
**Trade Management:**
* **If TLT rallies towards the short call strike ($90):** You can choose to close the entire spread for a profit or roll the short call up and out to a higher strike and a later expiration to continue collecting premium.
* **If TLT trades sideways:** The short call will lose value due to time decay (theta), and you can potentially buy it back for a lower price than you sold it for, or let it expire worthless. You can then sell another short call for the following month.
* **If TLT declines:** The value of your long call will decrease, but this will be partially offset by the premium received from the short call. The risk is limited to the initial net debit paid to establish the position.
> **Disclaimer:** This information is for educational purposes only and should not be considered financial advice. Options trading involves significant risk and is not suitable for all investors. It is crucial to conduct your own thorough research and consult with a qualified financial advisor before making any investment decisions.

SPY: Bearish Continuation is Expected! Here is Why:
Looking at the chart of SPY right now we are seeing some interesting price action on the lower timeframes. Thus a local move down seems to be quite likely.
Disclosure: I am part of Trade Nation's Influencer program and receive a monthly fee for using their TradingView charts in my analysis.
❤️ Please, support our work with like & comment! ❤️

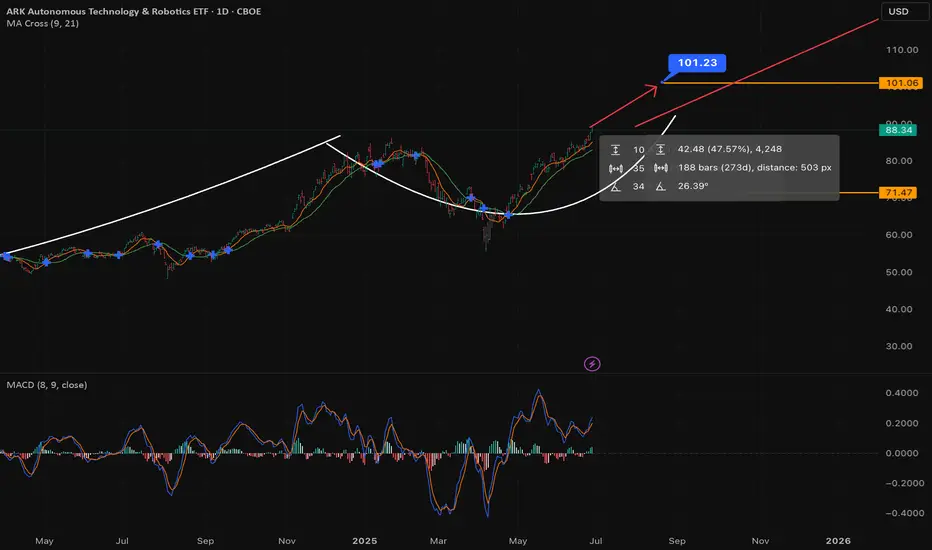
101 Next stop - ARKQ Cathy is HappyLet's analyze the ARK Autonomous Technology & Robotics ETF (ARKQ) with a focus on a "giant cup and handle" pattern and the MACD (8,13).
As of Friday, June 27, 2025, at 10:26:18 PM PDT, here's a breakdown of ARKQ:
**Current Price & Performance:**
* **Last Price:** $88.34 (as of 4:00 PM ET on June 27, 2025)
* **Today's Change:** Up $0.55 (0.63%)
* **Previous Close:** $87.79
* **Today's Range:** $87.59 - $89.15
* **52-Week Range:** $48.25 - $89.15 (Today's high is the 52-week high for ARKQ, indicating a strong recent upward movement.)
---
### **Giant Cup and Handle Forming**
A "Cup and Handle" is a bullish continuation pattern that typically forms over several months to over a year, making a "giant" one a long-term pattern.
* **The "Cup":** A "U" shaped formation where the price declines, bottoms out, and then rises back to approximately the original level. The ideal cup has a smooth, rounded bottom (not a sharp "V").
* **The "Handle":** A smaller, shorter consolidation pattern that forms on the right side of the cup, typically with a slight downward drift, often resembling a flag or pennant. It should generally form in the top half of the cup.
* **Breakout:** A decisive move above the resistance level created by the top of the cup and handle, on increased volume, confirms the pattern.
**ARKQ and the Giant Cup and Handle:**
ARKQ, like many growth and tech-focused ETFs, experienced a significant bull run into late 2021/early 2022, followed by a substantial pullback throughout 2022. It then began a recovery phase in late 2022/early 2023.
* **The "Cup":** This pattern would likely be formed by ARKQ's peak in late 2021/early 2022 (around $90-$100), the subsequent decline through 2022 to its lows (around $30-$40), and the long, sustained recovery back towards its previous highs. This entire multi-year U-shaped recovery would constitute the "giant cup." Its recent move to a 52-week high of $89.15 suggests it has almost completed the right side of this cup, nearing the "rim" or previous high.
* **The "Handle":** The "handle" would be a more recent, shorter consolidation that forms as ARKQ approaches that previous high. If ARKQ has been consolidating sideways or with a slight downward drift in the last few weeks or months (e.g., after hitting highs in the $80s and pulling back slightly before pushing higher again today), that could be the "handle" in formation.
**Confirmation:**
For this "giant cup and handle" to be confirmed, ARKQ would need to:
1. **Clearly form a handle:** A distinct period of consolidation (a few weeks to a few months) following the completion of the cup's right side, typically with decreasing volume.
2. **Breakout:** A decisive move above the "rim" of the cup (the previous high, which is also the 52-week high of $89.15, or even higher, if considering a very long-term cup from earlier all-time highs), on strong, increasing volume.
**Significance:** A giant cup and handle, when confirmed, is a powerful bullish continuation pattern. The price target is typically measured by the depth of the cup projected upwards from the breakout point. Given the depth of ARKQ's potential cup (from highs around $90-$100 to lows around $30-$40), the projected upside could be substantial, potentially indicating new all-time highs well beyond its current range.
---
### **MACD (Moving Average Convergence Divergence) (8,13)**
You've requested custom MACD settings (8,13). This makes the indicator more sensitive to recent price movements compared to the standard (12,26) settings.
* **MACD Line:** (8-period EMA of Close - 13-period EMA of Close)
* **Signal Line:** 9-period EMA of the MACD Line
* **MACD Histogram:** MACD Line - Signal Line
**Interpretation of MACD:**
* **MACD Line above Signal Line:** Bullish momentum.
* **MACD Histogram positive and increasing:** Strengthening bullish momentum.
* **MACD Line below Signal Line:** Bearish momentum.
* **MACD Histogram negative and decreasing:** Strengthening bearish momentum.
**Current ARKQ MACD (8,13) State:**
ARKQ has recently reached a new 52-week high, indicative of strong upward momentum.
* It's highly probable that the **MACD Line (8,13) is currently above its Signal Line**. This indicates **bullish momentum**.
* The **MACD Histogram is likely positive**, and given today's slight gain to a new 52-week high, it might still be increasing or holding strong, showing sustained buying pressure.
**Confluence:**
A strong, positive MACD (8,13) would provide bullish confirmation for the potential cup and handle pattern. If the MACD maintains its bullish stance as the handle forms (perhaps showing a slight cooling during the handle's drift but staying positive), and then accelerates again on a breakout, it would be a very strong signal.
---
### **Overall Outlook for ARKQ:**
ARKQ is showing compelling technical formations.
* The **"giant cup and handle" pattern** appears to be in an advanced stage, with the ETF having completed much of the "cup" by nearing its previous multi-year highs. The formation of the "handle" now becomes critical. If it forms constructively and leads to a breakout, it signals a significant bullish continuation with substantial upside potential.
* The **MACD (8,13)** is likely confirming the recent bullish momentum, with the MACD line above its signal line and a positive histogram. This supports the idea that buying pressure remains strong.
**Considerations:**
* **ETF Holdings:** ARKQ is an actively managed ETF. Its performance is tied to the performance of its underlying holdings in autonomous technology and robotics. Understanding the outlook for these sectors is crucial.
* **Volume:** As with any chart pattern, volume confirmation is key. Strong volume on a breakout from the "handle" would lend significant credibility to the pattern.
* **Risk:** While the cup and handle is bullish, no pattern is guaranteed. Monitor for potential failures of the pattern (e.g., breakdown below the handle's support).
This analysis is based on your provided pattern and indicator, combined with current market data. It is not financial advice. Always conduct your own thorough fundamental and technical research and consult with a qualified financial advisor before making any investment decisions.