June 27th, 2025 - Morning BriefFriday, June 27, 2025. Markets are on the edge, and if you thought summer would bring calm, think again. Today’s script is pure adrenaline.
Overnight, the U.S. and China finally inked a trade deal that actually matters: tariffs are coming down, and rare earths are flowing again. Tech and manufacturing stocks are already celebrating, with SP:SPX and CME_MINI:NQ1! futures inching toward fresh record highs. NASDAQ:NVDA is still the market’s favorite lottery ticket, hitting another all-time high. Meanwhile, NYSE:NKE just spiked 10% premarket after beating earnings. Never mind the $1 billion tariff punch, they’ll “manage it.” Sure.
But the real show is the May PCE inflation data dropping this morning. The Fed’s favorite gauge is expected to tick up to 2.3% year-over-year, with core PCE at 2.6%. If the numbers surprise, brace for whiplash in rates and risk assets. GDP’s third estimate confirmed a -0.5% contraction in Q1, so the “soft landing” crowd is sweating. Jobless claims and new home sales hit at 10:00 AM ET. Expect every algo on the Street to be watching.
Trump is making noise about firing Powell before 2026, which has traders betting on earlier rate cuts. If you’re looking for stability, you’re in the wrong casino.
Here’s where things stand:
- OANDA:XAUUSD : $3,280–$3,334/oz (slipping as risk appetite returns)
- BLACKBULL:WTI : $65.64–$65.82/barrel (steady, but one headline away from chaos)
- BINANCE:BTCUSDT : $107,215–$107,477 (down, but still a six-figure fever dream)
- CME_MINI:ES1! : Hovering just below the 6,144 record
Today’s takeaway: The market’s running on hope, caffeine, and denial. Stay sharp, one bad print and the rally could turn into a stampede for the exits. Welcome to the volatility vortex.
Been building something for US swing traders — if you’re one, I’d really appreciate your feedback. Free to test, link in Bio
ETF market

Nightly $SPY / $SPX Scenarios for June 27, 2025🔮 Nightly AMEX:SPY / SP:SPX Scenarios for June 27, 2025 🔮
🌍 Market-Moving News 🌍
📉 Global Markets Bet on Dovish Fed Pivot
Markets are pricing in more aggressive Federal Reserve rate cuts—approximately 125 bps by end-2026—due to speculation that President Trump may replace Chair Powell with a dovish successor. Investors caution excessive political influence could jeopardize Fed independence
🏦 Fed Governor Warns of Tariff Risks
Fed’s Michael Barr emphasized that tariffs could trigger inflation and unemployment, reinforcing the Fed’s wait‑and‑see approach. Expect modest rate cuts later this year, contingent on economic signals
📉 Q1 GDP Revised Sharply Lower
First-quarter U.S. GDP was downgraded to an annualized contraction of 0.5%, a deeper fall than previously reported. The revision underscores drag from weak consumer spending and trade disruptions
📃 Trade Deficit Widens in May
U.S. goods trade deficit expanded 11% to $96.6 billion, driven by a $9.7 billion drop in exports. Trade gap dynamics remain a headwind for growth projections
🐘 JPMorgan Sees Stagflation Risks
JPMorgan revised its U.S. GDP growth forecast down to 1.3%, warning that tariff-related “stagflationary impulse” is complicating growth and inflation outlooks—and making recession risks more real
📊 Key Data Releases 📊
📅 Friday, June 27:
8:30 AM ET – U. of Michigan Consumer Sentiment – June (Prelim.)
Expected to reflect growing economic caution. The index fell in May; traders will watch for further weakness.
10:00 AM ET – Fed Stress Test Results
Fed to release annual bank stress-test outcomes. Strong results support financial stability, while weak spots could unsettle markets
⚠️ Disclaimer:
This information is for educational and informational purposes only and should not be construed as financial advice. Always consult a licensed financial advisor before making investment decisions.
📌 #trading #stockmarket #economy #Fed #inflation #macro #charting #technicalanalysis

Chart Pattern Analysis Of MSTZ
From K1 to K3,
It is a bullish three soldiers advancing pattern,
But unfortunately, it still failed to close upon a nearest resistance.
K3 start with a bull gap and break up a downtrend line of a large scale consolidation range.
If the following candles break up the resistance or consolidate around it,
It will be a good place to buy it there.
On the other hand,
If the following candles successfully retest the downtrend line,
It is also a good place to buy it then.
Long-4.75/Stop-4.35/Target-10

SPY Prediction (with 10% conviction)Now that we are at ATH, whats going to happen next?
Superimposition of 2018 bear market over today's timeline shows we rally to $625 after which we get a correction to $573. Rally continues onwards until we get another plandemic🤞
In 2018 we had tariffs 1.0 in addition to FED QT. This time we have tariffs 2.0 (or do we?) and a confused FED which probably makes the case for the same level of FUD.
Economic and political environment changes but human behoviour does not change, altlest not like moores law.
Thank you for your attention to this matter!

Bear flag18 ema, looking to smash down ans invalidate a VIX breakout, if you bullish you want to see a bearish breakout from bear flag, if you bearish you want to see a vix breakout..
Stoch rsi showing overbought conditions with an apex around 330pm

Divergence FormingThe descending channel pattern is always my favorite. Mixed with RSI, channels aligning with gaps and volatility being at $20, its a good chemical mix.
AMEX:SOXS to $10 can happen quickly but I think the move will be sharp and quick. Long term bearish signals forming to.
Lets see where it goes!

SPYOf course when I get out of SPY it sky rockets... this has continuously happened to me while trying to build up my small account. I get in make about 5-10%, take profits, then it jumps in the direction I get into. Wild. Any suggestions?

SP500 short USD is losing its reserve currency status but I guess it is also loosing its measuring cup status as well.
While people are cheering for all time highs in USD, SP500 in CHF does not look good at all.


Triple Top on QQQAs I said some the same things for the S&P 500 . here we have QQQ . Repeating this pattern staying In this box for some time now. investment accounts , 401ks, real estate , etc etc. I see all accross the board people buying almost everything at very high prices. With no in dept look . lets try and make sense of this in market terms. The stock market is not in correlation with the economy say it with me 3 times please. now the level has been met since December 2024. and every single time we create a gap and fall from there now honestly I can see a wall of support is being built but after July please watch out from there. a lot of war money coming into the market

SPY . Market Corrections IncomingHey Guys it's been a long time but I'm going to be more consistent in publishing more. The S&P 500 has hit a level of resistance 4 times on the daily chart. which is very very telling. Yes I understand we have news and war being a major catalyst in the stock market rallying a lot lately but this is only temporary. This previous witching was last Friday if you weren't aware which also caused the small pull back. So for further bullishness to continue let's look at the earnings for the magnificent 7 and the rest of the tech sector. More war means more money for the market . we have the next witching in September . and so here are my projections. We take a step higher in July as we go into the peak of SOLAR Maximum . please do your research. and then after that by September we go into pull season . Happy trading

update on the Markets 6-26SPY may reverse today, I'm watching IWM for clues. Gold losing support as of now. Oil may come down more and then bounce again. NG is hard to read. BTC still holding below it's channel.

SPY soars to new all time highsThere has been a lot of speculation about where SPY is going next. I believe a significant correction will happen in the near future. However, today SPY is creeping back into the strong uptrend it once had. Looking at chart patterns, SPY is building momentum once more and will be hitting another yet another all time high.

What Is The Market Waiting For?Good Morning Trading Fam,
Our stock and crypto markets seem to have stalled. You may be wondering what they are waiting for. Quite simply, the S&P 500 has reached a double-top. That's all. There may be some more pause here for the next week or so. Barring any significant bearish geopolitical or other events, I expect us to move higher. Any FUD at all will send the market back down again. So yes, unfortunately, the next move(s) will be mostly predicated on news. Traders are rather fragile rn. Trade accordingly.
Best,
Stew

Nightly $SPY / $SPX Scenarios for June 26, 2025🔮 Nightly AMEX:SPY / SP:SPX Scenarios for June 26, 2025 🔮
🌍 Market-Moving News 🌍
💱 Dollar Mounts Decline on Fed Credibility Concerns
The U.S. dollar dropped to a 3½-year low against the euro after reports that President Trump is considering replacing Fed Chair Powell as early as September or October. The move fueled market concern about the Fed’s independence and prompted traders to raise the likelihood of a July rate cut to 25%, with nearly 64 bps of rate cuts priced in by year-end
📉 Markets Stay Cautious Ahead of Powell’s Testimony
Traders remain on edge as Fed Chair Powell’s Capitol Hill testimony continues. He reiterated caution, noting inflation risks tied to tariffs despite growing calls for easing, keeping interest-rate expectations in limbo .
📈 S&P 500 Nears All-Time Highs in Second-Biggest Bi‑Monthly Rally
The S&P 500 has notched its second-largest May–June rally on record (6.2% in May, further gains in June), bolstered by cooling inflation, easing Middle East tensions, and strong AI earnings momentum led by Nvidia. Bull-case scenarios could push the index to fresh highs
📊 Key Data Releases 📊
📅 Thursday, June 26:
(No major U.S. economic release—markets are focused on Powell’s remaining testimony and global risk dynamics.)
⚠️ Disclaimer:
This information is for educational and informational purposes only and should not be construed as financial advice. Always consult a licensed financial advisor before making investment decisions.
📌 #trading #stockmarket #economy #Fed #inflation #geopolitics #technicalanalysis

$IWM Look at that moveThe bottom of the implied move today was 212, and look where we closed? 211.97. That was beautiful.

Elliott Wave Insight: GDX Climbs Higher After Three Wave DeclineThe rally in the Gold Miners Junior ETF (GDX) from its December 30, 2024 low remains intact. This rally is unfolding as a five-wave impulse pattern, as observed on the 1-hour chart below. Wave (4) of this impulse concluded at $44.75, setting the stage for wave (5) higher. Wave (5) is currently progressing with its own impulsive subdivision. From the wave (4) low, wave ((i)) peaked at $46.70, followed by a pullback in wave ((ii)) to $45.19. The ETF then surged in wave ((iii)) to $54.62. Subsequent correction in wave ((iv)) ended at $51.12. The final leg, wave ((v)), completed at $54.73, marking the end of wave 1 in the higher degree.
Following this, GDX entered a corrective wave 2, characterized by a clear seven-swing corrective structure. From the wave 1 peak, wave ((w)) declined to $52.19. It was then followed by a recovery in wave ((x)) to $53.74. The subsequent wave ((y)) bottomed at $50.70, completing wave 2. The ETF has since bounced from the 100%–161.8% Fibonacci extension zone of $49.61–$51.18. Currently, GDX could either resume its rally to new highs or stage a three-wave bounce before a potential larger double correction. However, even if a deeper pullback occurs, the corrective nature of the decline from the wave 1 peak supports a bullish outlook, suggesting that any downturn is likely a temporary pause within an ongoing uptrend.

SP500 possible Turn Just a possibility - DJT and IWM have turned down, they often lead the moves. Gold at support and holding. Oil support is holding. Natural gas probably bounces here. BTC at channel resistance

The Ghost of 1986-1987 Stock Market Overlay onto $IWMThe 1986-1987 stock market advance was 48% as measured by the S&P500 Index SP:SPX from the low in late 1986 which peaked in August 1987 and crashed into October 19th's spectacular 20% decline in one day.
The advance in the Russell 2000 Index from the low in 2023 to the high in 2024 was 51%, topping the 48% gain in the SP:SPX and the meltdown wasn't as spectacular, but it was similar.
There were similar patterns in fears of trade wars, US dollar declines, new tax laws going into effect back then and tax laws sunsetting this time. Those you can go into by reviewing my other charts I have published over the years here.
I stretched the 1987 pattern to fit the low to the high, so it isn't "exactly" the same time day-to-day for this pattern.
I found it interesting because the chart of AMEX:IWM all by itself had the same "look" to me as the 1987 bull market and crash so I decided to put it together for you all here to see.
I would expect a choppy market from here on as people adjust to the new uncertainties. Sellers of this decline will be shy to reinvest anytime soon and buyers are likely afraid to step up and get aggressive with so much uncertainty.
Sentiment as measured by AAII shows an extremely fearful and reluctant investor class, which is typical to see at major market bottoms.
Wishing everyone peace and prosperity!
Tim West
11:17AM EST April 24, 2025

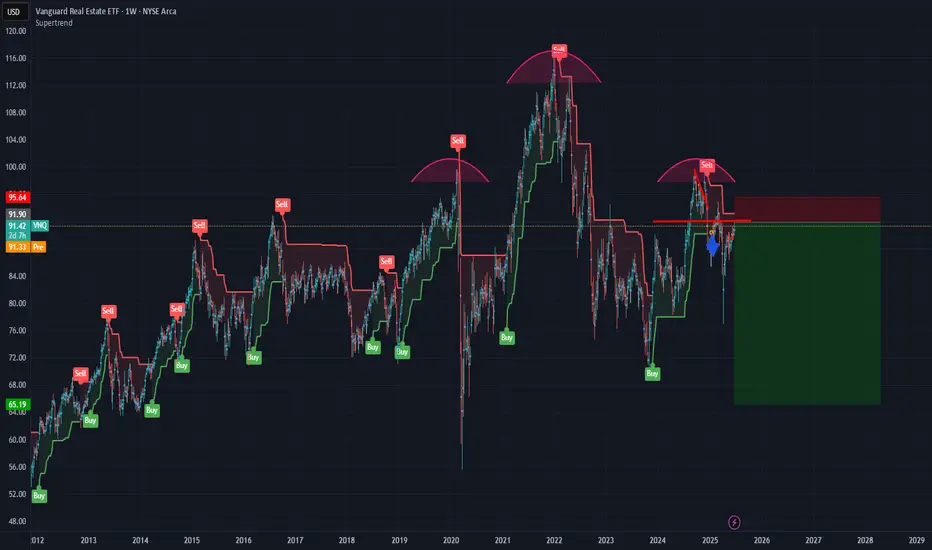
Adding DRV in this area. VNQ going downThe golden age is over. Actually I have no idea what I am doing other than throwing darts at the dart board. This trade may work, it may not.
RePOST - Weekly Technical Breakdown – Week of June 22, 2025
QQQ
Weekly Technical Breakdown – Week of June 22, 2025
After a strong rally earlier in June,
QQQ
printed a wide daily broadening formation on Friday with an outside day that expanded Thursday’s range. This pattern signals indecision and possible structural recalibration. The final minutes of trading saw significant volatility due to quad witching flows, as institutions unwound or rolled large options positions. Monday’s open will be critical to confirm whether bulls hold or if a breakdown unfolds. The short-term range is wide, with support at 525.89 and resistance near 533.66. A breakout above 533.66 opens the door to all-time highs around 536.78. On the downside, an unfilled fair value gap spans 522.70 to 520.69, which could attract price if weakness develops. Intraday traders should watch pivots at 525.89, 527.27, 528.61, and 530.45 for scalps and key reactions.
Technical Summary
• Structure: Outside day forming a wide daily broadening formation
• Friday Note: Quad witching flows in the final minutes caused order flow imbalances and aggressive re-hedging
• Daytrade Pivots: 525.89, 527.27, 528.61, and 530.45 remain active intraday reaction points
• Macro View: Clean daily close above 533.66 supports upside momentum and breakout potential
• Downside Risk: Unfilled fair value gap from 522.70 to 520.69; holding above 525.89 early week is critical
• Momentum Bias: Friday’s candle signals indecision; Monday likely to define near-term direction
Key Levels to Watch
🟢 Upside Resistance: 527.27 (reclaim level), 528.61 (mid-range pivot), 530.45 (resistance zone), 531.87 (continuation trigger), 533.66 (breakout confirmation), 536.78 (all-time high territory)
🔴 Downside Support: 525.89 (must hold early week), 524.02 (range low / breakdown trigger), 522.70 (FVG gap top), 520.69 (FVG gap bottom), 519.86 (trend support)
Trade Plan
• Hold above 525.89 to target 533+ early in the week
• Daily close above 533.66 signals potential breakout run
• Break below 524.02 shifts focus to gap fill 522.70–520.69
• Intraday scalps effective between 525.89 and 530.45
Decision Map
🟩 IF QQQ HOLDS ABOVE 525.89 → reclaim 527.27 / 528.61 → target 530.45 → 533.66 → breakout toward 536.78 (ATH)
🟥 IF QQQ BREAKS BELOW 525.89 → watch 524.02 (structure break) → target 522.70 → 520.69 (gap fill) → trend pivot 519.86
Primary Trade Zone: 525.89–530.45
Alert List for Key Levels
Set alerts above price: 527.27, 530.45, 533.66
Set alerts below price: 525.89, 524.02, 522.70, 520.69
This Week’s Key Catalysts for
QQQ
QQQ
’s price action this week will be influenced by a combination of major economic releases and Fed commentary, alongside ongoing macro and geopolitical factors impacting the tech sector.
• The most important catalyst is Fed Chair Jerome Powell’s testimony to the House Financial Services Committee on Tuesday, June 24. Powell’s remarks on the economic outlook and future rate policy could drive volatility and directional bias in
QQQ
, especially given market anticipation around possible rate cuts later this year.
• Additional Fed insights will come from Cleveland Fed President Beth Hammack’s speeches on Tuesday and Thursday, which could reinforce or add nuance to Powell’s tone.
• Inflation and economic data releases throughout the week—including durable goods orders, GDP revisions, consumer sentiment, and personal income/spending reports—will help shape market expectations for Fed policy, a major driver for growth stocks like those in $QQQ.
• The quad witching event last Friday increased short-term volatility and order flow imbalances, impacting the current technical setup.
• Longer-term geopolitical issues, including export restrictions on semiconductor technology and institutional buying trends, remain background factors but are less likely to move
QQQ
sharply this week absent new headlines.
Traders should monitor these catalysts closely and combine them with technical levels and price action to navigate the week effectively.

SPY/QQQ Plan Your Trade for 6-25 : Breakaway PatternToday's Breakaway pattern suggests the SPY/QQQ may attempt to move into another breakaway price move - very similar to yesterday's price move.
I will add that I believe the SPY cycle patterns have already moved through a breakaway phase with the ceasefire news early this week. I believe the gap and breakaway move yesterday may be the breakaway trend we are expecting today.
That would suggest the markets could pause and pullback a bit over the next few days.
Gold and Silver are trying to find a bottom after the brief selling that took place over the past few days. I really do believe Gold and Silver are poised to make a big move higher.
Bitcoin is on a terror to the upside. But be cautious of the downward cycle channel that may prompt a rollover in BTCUSD near the $107,500 level.
I spend a little time near the end of this video highlighting my work on the Tesla 3-6-9 price theory and going over a few examples for my new book on trading.
Enjoy the quick look at some of the more advanced techniques I'm working to unlock for all of you.
Get some.
#trading #research #investing #tradingalgos #tradingsignals #cycles #fibonacci #elliotwave #modelingsystems #stocks #bitcoin #btcusd #cryptos #spy #gold #nq #investing #trading #spytrading #spymarket #tradingmarket #stockmarket #silver

SPY GEX & Technical Setup – Aiming for Gamma Lift-Off?GEX Outlook (June 24, 2025):
SPY is sitting right on top of a major Gamma Wall at 607–610, with high net positive GEX and strong Call Wall stacking above. The 2nd Call Wall (609) and GEX10 (611) suggest bullish optionality remains intact if SPY can hold above 605.
* GEX Sentiment: 🟢🟢🟢🟢
* IVR: 13.7 (low implied volatility rank, bullish)
* IVx Avg: 16.7
* Put Walls: Strong support at 595 and 591
* Call Pressure: Builds up from 605 to 611
📌 This is a prime environment for long CALLs, especially for traders expecting momentum continuation through 607+.
Price Action (1H): Smart Money Concepts Perspective
* Break of Structure (BOS) confirmed at ~606
* Retest held strong near 600.15–604.45, validating support
* Clear bullish CHoCH and BOS sequence with strong volume
* Current candle consolidation inside a small supply zone near 607 (possible pause before continuation)
Support Zones:
* 604.45: First line of defense
* 600.15: Breaker block retest
* 591.90: Ultimate bear invalidation zone
Resistance Targets:
* 610: Next major target (2nd Call Wall)
* 611+: GEX10/extension zone for squeeze
🔍 Trade Idea (Scalp or Swing)
Bullish Scenario (CALLs setup):
* Entry: On retest of 604.5–605 zone
* Target: 610–611 (Gamma zone breakout)
* Stop: Below 600.15
* Options Play: Buy 610C 0DTE/1DTE if intraday bounce confirmed above 605 or breakout continuation above 607
Bearish Reversal?
* Only if SPY breaks below 600 with momentum + volume. Otherwise, dip = opportunity.
Summary:
SPY is riding a strong bullish structure with GEX favoring upward pressure. As long as 604–605 holds, dips are for buying. Watch 607–610 for breakout confirmation. Options market flow supports further upside if volatility remains controlled.
Disclaimer: This analysis is for educational purposes only and not financial advice. Always do your own due diligence before trading.
