SPY 500 BreadthCurrently see weakness on the breadth of the S&P500. We go back below the 9-EMA and could head back down to the gap-fill area. For now I'm working on my watchlist and looking for potential bounces on leading stocks.
ETF market

SPY: ASI DIMENTION SHIFT TRADESPY: ASI Dimension Shift Trade
Markets are no longer responding to human logic—they're reacting to macro compression and machine foresight.
This trade captures the inflection point where AI and capital collide.
📌 Watch:
AMEX:SPY holding above 532 = dimension support
Breakdown below 518 = confirmation of SMC exit
VolanX signal: “Shift registered. Volatility node expanding. Defensive alignment required.”
#SPY #VolanX #SMC #AITrading #ASIDimension #MacroBreakout #WaverVanir

579 spy incoming?I posted this a week or so ago. I think we are finally going to have the momentum, or lack thereof, to make it down to fill the rest of that gap. I have noticed that large gaps that leave a small gap below(you must adjust the indicator to show it) almost always get filled before continuing up. This 579 level also matches up perfectly with the 20ema on the weekly which should provide further support. I will be looking for this level all week while being aware of any short squeezes that could occur on the way down. Will definitely go long at this 579 level as I think we will have a very green July.

Weekly $SPY / $SPX Scenarios for June 23–27, 2025🔮 Weekly AMEX:SPY / SP:SPX Scenarios for June 23–27, 2025 🔮
🌍 Market-Moving News 🌍
🌐 Geopolitics Add to Risk Aversion
The S&P 500 is up about 0.9% so far in June, but analysts warn it’s facing a “precarious” phase amid renewed Middle East conflict and looming U.S. tariff deadlines in July–August. Elevated oil prices could fuel inflation, while fiscal and debt ceiling pressures weigh on sentiment
🎙️ Powell Heads to Capitol Hill
Fed Chair Powell will testify before Congress this week. His remarks on inflation and rate outlook—particularly regarding the Fed’s recent dot-plot revisions and monetary policy uncertainty—will be central to market direction
📈 Nike, FedEx & Micron Earnings Under Focus
Key corporate earnings (Nike, FedEx, Micron) could provide fresh insight into how tariffs and supply-chain disruptions are impacting major U.S. businesses
🛢️ Oil Prices Elevated
Oil remains range-bound at multi-week highs near $75–80/bbl following U.S.–Israel military action in Iran, which briefly spiked prices ~7–11%. Continued dependence on Middle Eastern supply may keep energy complex volatile
⚖️ NATO Summit Tightens Security Focus
NATO leaders meet in The Hague, marking an elevated global defense posture amid geopolitical uncertainty. Defense and aerospace stocks may remain pressured or volatile depending on summit outcomes
📊 Key Data Releases & Events 📊
📅 Monday, June 23
9:45 AM ET: S&P Global Flash U.S. Services & Manufacturing PMI (June)
10:00 AM ET: Existing Home Sales (May)
📅 Tuesday, June 24
10:00 AM ET: Consumer Confidence Index (June)
Testimony: Fed Chair Jerome Powell appears before Congress
📅 Wednesday, June 25
10:00 AM ET: New Home Sales (May)
📅 Thursday, June 26
8:30 AM ET: Advance Q1 GDP (Final Estimate)
📅 Friday, June 27
8:30 AM ET: Core PCE Price Index (May) — Fed’s preferred inflation gauge
⚠️ Disclaimer:
This is for educational and informational purposes only. It does not constitute financial advice. Always consult a licensed financial advisor before investing.
📌 #trading #stockmarket #economy #geopolitics #Fed #oil #charting #technicalanalysis

exposing the inner workings of the illusive 'black box'Black box reveal
I was debating whether i'd ever share this publicly, but i came to an agreement with myself and decided to share this out of commission model. With the knowledge that comes with understanding predictive quant models, I was able to derive patterns the had arisen in the market via matching algorithms which gave me the ability to predict where a market was likely to open, make a high, make a low, and close on any given day where no news was being priced in. I was always told to keep my findings private, but no one wins if I do that, so I decided to share and the individuals that have the ability and care to figure out the puzzle for themselves can do so with this as a starting point. Im writing this post in one take so I apologize for any grammatical errors. In tradingview's LEAP challenge i've kinda been blowing my account over the last week and have just under 80% profit and no open positions with a week to go before it ends, so this post is also for people to look back and see if intraday trading can catapult my account. Good luck to all the participants!

SPY At Risk as Geopolitical Tensions Rise Jun 23 — What Monday Holds for Bulls & Bears ⚔️📉
🔍 GEX & Options Sentiment Overview:
From the daily GEX chart:
* Key Gamma Levels:
* 📍Call Walls: 597 → 602 (supply zones), strong resistance.
* 📍Put Walls: 590 → 587 → 572, significant gamma exposure to the downside.
* High Volatility Zone (HVL) at 590 – a trigger level; under this, the market may accelerate downside toward 587 and even 572.
* GEX Summary:
* PUTS: 80.4% dominance
* GEX Net: 🔴 extremely negative
* IVR 23.3, still on the lower side but rising
* Implication: Dealers are hedging to the downside. Gamma exposure creates risk of accelerated selloff below 590.
📊 Technical Analysis – Daily (1D)
* Price: 594.28 (as of Friday close)
* Trend: Daily candle broke prior support; new lower high confirmed.
* Structure:
* Failed to reclaim 597, now acting as local resistance
* Next major demand zone: 587
* Trendline from the recent highs shows lower highs; bearish continuation forming.
* Volume: Bearish candle closed with strong volume — sign of institutional distribution.
⏱️ Intraday TA – 1H Chart
* CHoCH/BOS: Confirmed Break of Structure near 591, then a small rally attempt.
* Micro Supply Box: 596.5–597.5 — liquidity trap if SPY rallies into it.
* Support Zones:
* 593.35 / 594.00 – holding Friday’s bounce.
* If fails, expect sweep to 590 → 587.
* Trendline Pressure: Downward diagonal trendline rejecting every bounce. Unless a full candle close over 599.50, bias remains bearish.
⚠️ Geopolitical Risk – U.S. Bombs Iran
* News: U.S. launched targeted airstrikes on Iranian assets. Market now faces:
* Flight to safety: TLT, Gold, and USD may rise.
* Oil likely spikes — expect XLE and energy stocks to outperform.
* Tech and indexes may open with gap-down risk due to heightened geopolitical uncertainty.
* SPY Implications:
* Risk-off behavior could amplify sell-off under 590.
* Traders may hedge via VIX calls, gold futures, or SPY puts.
* Watch for VIX spikes or DXY rally as confirmation of sentiment shift.
🧠 Trade Scenarios – Monday June 24
🔻 Bearish Case (High-Probability if Geopolitical Escalates)
* Rejects at 596–597 zone (supply)
* Entry: ~595–596 rejection
* Targets: 590 → 587 → 572 (extreme GEX)
* Stop: 598.5–599.2 above supply box
🔼 Bullish Case (If Market Shakes Off Iran Tension)
* Breaks over 597.5, closes above 599.5 (CHoCH confirmation)
* Entry: 598–599 breakout
* Targets: 602 → 604.5 (2nd Call Wall)
* Stop: 596.5
📌 My Thoughts:
SPY is sitting on a knife’s edge. GEX is screaming downside, and now geopolitical risk adds another layer of pressure. Monday could open with volatility spikes, and if the market gaps down under 590, it might cascade to 587 fast.
Only a reclaim above 599.5 invalidates the bearish structure — and even then, macro headlines might limit upside. Stay nimble. Hedge if holding longs.
🧭 Action Plan for Monday:
* Scalpers: Watch the 596–597 rejection zone — quick puts may work well.
* Swing traders: Use HVL 590 as pivot. Lose it? Target 587.
* Hedgers: VIX calls or GLD may provide cushion.
* Macro watchers: Monitor oil (USO), DXY, and bonds (TLT) for risk-on/off cues.
⚠️ Disclaimer:
This analysis is for educational purposes only. It is not financial advice. Always do your own research and manage risk carefully.

Stock Market Forecast | TSLA NVDA AAPL AMZN META MSFTStock Market Forecast | !nq1! !es1! SPY QQQ
Mag 7 Forecast | NASDAQ:TSLA NASDAQ:NVDA AAPL AMZN META MSFT GOOG

SPY: Expecting Bullish Continuation! Here is Why:
Balance of buyers and sellers on the SPY pair, that is best felt when all the timeframes are analyzed properly is shifting in favor of the buyers, therefore is it only natural that we go long on the pair.
Disclosure: I am part of Trade Nation's Influencer program and receive a monthly fee for using their TradingView charts in my analysis.
❤️ Please, support our work with like & comment! ❤️

Uranium The Epic Explosion!Global uranium demand is up to rise about 28% by 2030, driven by clean-energy pushes, nuclear restarts (e.g., Japan), and advanced modular reactors
Kazakhstan’s largest producer, Kazatomprom, cut its 2025 production forecast by ~17% due to logistical hurdles and resource constraints
Iran signaled openness to discussions with European counterparts aimed at curbing its uranium enrichment levels. However, seasoned diplomacy and regional conflict issues complicate prospects for an agreement
Bottom line: Uranium markets are tightening due to production cuts and geopolitical risk, while long-range demand is gaining momentum thanks to nuclear expansion and emerging energy technologies.

Low frequency trading (LFT) vs HFTHey fellow tarders and financial mojol,
I've got some insider info that's going to blow your minds! 🤯
According to my top-secret sources (aka my pet parrot who squawks numbers at me), low-frequency trading algorithms have finally figured out the true fair price of the S&P 500. Drumroll, please... It's $550! That's right, folks, all those high-frequency trading bots are currently aiming for this magical number as we speak.
But wait, there's more! The next step in this thrilling financial adventure involves radiowaving all the way down to $400. Yes, you heard it here first. We're talking about some serious next-level trading strategies that involve actual radio waves. Who needs fiber optics when you've got good old-fashioned radio, right?
So, buckle up and get ready for the ride of your life. The market's about to take a trip back to the good old days when $550 was the dream and $400 was just a stone's throw away.
Happy trading, and remember, if your broker gives you weird looks, just tell them you're tuning into the market's frequency! 📡💸

long term short on QQQ level $501 and 465there some level i would like to to look for on QQQ$
Main target is level $465- 495 -$ 501
Disclaimer- it a opinion


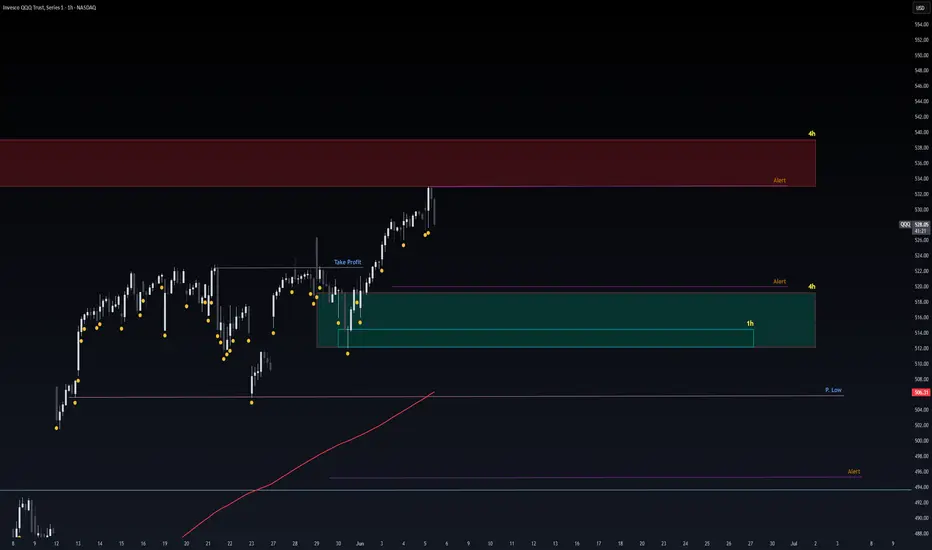
Safe Entry Zoneafter Rejection from the Resistance 4h Red Zone.
we have 4h and 1h Green Zone as Strong Support levels.
Note: Potentional of Strong Buying Zone:
We have two scenarios must happen at The Mentioned Zone:
Scenarios One: strong buying volume with reversal Candle.
Scenarios Two: Fake Break-Out of The Buying Zone.
Both indicate buyers stepping in strongly. NEVER Join in unless one showed up.
Friday updateSPY likely put in an ABC, I expect lower for most of today. Gold probably higher for now. Oil is just consolidating. NG looks like a buy. BTC i think will breakdown under 100k over the weekend.

bullish targets smashed ;)spy broke my bullish targets i posted when it was 500, now struggling with a lower high at resistance zone, push down to 572-580 or so is possible before they try to push for all time highs🚀
boost and follow for more 💖

SPY/QQQ Plan Your Trade For 6-20 : Pause Bar PatternToday's Pause Bar pattern suggests the SPY/QQQ will slide into a sideways type of PAUSE in price action today. I'm not expecting much to happen and if we do see any breakaway or breakdown trending it will likely be related to news.
While we have options expiration today and a host of other things that could drive the markets, I believe the markets are struggling to find direction right now. Thus, a pause in trading would be somewhat normal after a holiday-shortened trading week.
Gold and Silver are struggling after a brief rally last week. I believe this is fear related to the Israel/Iran conflict. Metals should continue to move higher.
BTCUSD is slightly higher (forgot to cover BTCUSD in the video), but not moving into a breakaway phase.
Overall, everything is very flat in early trading today. It may stay that way with my PAUSE BAR pattern.
Get some.
#trading #research #investing #tradingalgos #tradingsignals #cycles #fibonacci #elliotwave #modelingsystems #stocks #bitcoin #btcusd #cryptos #spy #gold #nq #investing #trading #spytrading #spymarket #tradingmarket #stockmarket #silver

18.35This channel is not providing individualized trading or investment advice, nor is it a banking service, brokerage service, trading service, investment service or money management service
Boil proved good 30%

Five investment in Fusion Energy EFT'sFusion generation is coming on line in the next five years. This is a list of ETF's which track the Fusion generation companies.

Nightly $SPY / $SPX Scenarios for June 20, 2025🔮 Nightly AMEX:SPY / SP:SPX Scenarios for June 20, 2025 🔮
🌍 Market-Moving News 🌍
🏦 Fed Holds Rates, Warns on Tariffs
Fed kept interest rates steady on June 19, cautioning that tariffs could stoke inflation and slow growth. Inflation projections were raised from 2.7% to 3.0%, while growth estimates were revised lower to 1.4%
🌍 Middle East Risk Drags Markets
Global stocks fell and safe-haven assets surged after U.S. futures weakened amid heightened tensions in the Israel–Iran conflict. Yields were mixed: gold weakened and bonds gained, while oil held steady near seven-week highs
📈 Treasury Yields Edge Higher
Despite safe-haven demand, U.S. 10‑year yields ticked up as markets absorbed the Fed’s updated rate outlook. The yield curve remains elevated ahead of next week’s $38 bn auction of long-dated notes
📊 Key Data Releases 📊
📅 Friday, June 20:
(No major U.S. economic reports)
Markets will be driven by Fed commentary follow-ups and geopolitical headlines over the weekend.
⚠️ Disclaimer:
This information is for educational and informational purposes only and should not be construed as financial advice. Always consult a licensed financial advisor before making investment decisions.
📌 #trading #stockmarket #economy #geopolitics #fixedincome #inflation #charting #technicalanalysis

WEAT on the move?Wheat futures (ZW) have cleared a zone of resistance with a 4.6% one day move. As tracked by the WEAT ETF, current price seems to be heading for a retest of the 200 Daily SMA (currently at $4.90). The 200 Daily SMA has reversed previous attempts to break out in October 2024 and February 2025. Will third time be different?
Note that this ETF reached a high over $12 in 2022 when the Russian/Ukrainian war started.

Choppy daySPX closed under the channel trendline which I think bodes well for bears. Gold looks like it's breaking down. Nat Gas looks strong. USOIL looks like it will go higher. BTC is at support.

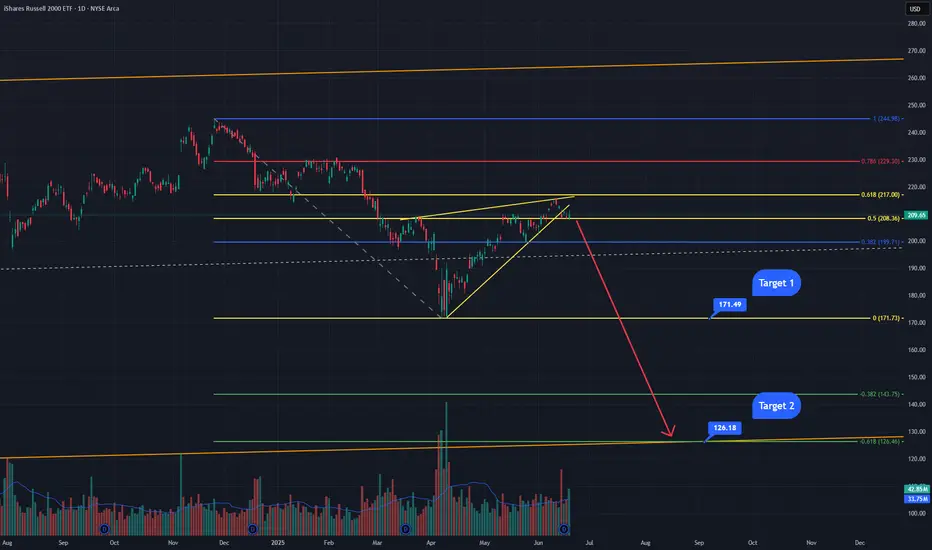
Small Caps about to get SlammedThe IWM has been trading inside this upward sloping wedge/bear flag for a few months. It just broke the bear flag this week and then tested the underside of it as resistance before getting rejected. This area also happens to be a golden pocket retracement zone from a Fibonacci I have drawn from the all-time highs made in November of last year to the lows made 2 months ago in April. The next probable move is back down to target 1 at the bottom of the Fibonacci retracement at $171. These golden pocket retracements have a very high probability of moving back down to the bottom of the retracement, sometimes breaking lower. This area at $171 has a lot of support but if it breaks, I expect it to come down to the orange line which is an upward sloping paralell channel that the IWM has been trading in since the financial crisis of 2008. The bottom of said channel connects the 2009 lows through the covid lows of 2020. This area also happens to be the -0.618 Fibonacci retracement area, it would be the 3rd hit of the bottom this major weekly channel and would very likely contain the lows for the current bear market.
SPY/QQQ Plan Your Trade For 6-19: GAP Reversal Counter TrendToday's pattern is a GAP Reversal in Counter Trend mode. I believe this could represent a breakdown in the ES/NQ as the US stock market is closed for the Juneteenth holiday.
Obviously, after the Fed comments yesterday (stating "uncertainty") and with the continued Israel/Iran conflict playing out, it makes sense to me that the US markets would move into a pre-weekend consolidation phase.
Even though the US stock market will be closed, the futures market will likely stay open and will carry some general market sentiment and reactions to news.
Watching Gold/Silver and Bitcoin should be very interesting today. I suspect the markets will continue to consolidate downward today - leading to a potential breakdown seeking support day on Friday.
Buckle up. We'll likely have 3-5+ days of news related to the Israel/Iran conflict and other issues over this weekend. It could be very interesting to see how the global markets move through this news.
Get some.
Happy Juneteenth
#trading #research #investing #tradingalgos #tradingsignals #cycles #fibonacci #elliotwave #modelingsystems #stocks #bitcoin #btcusd #cryptos #spy #gold #nq #investing #trading #spytrading #spymarket #tradingmarket #stockmarket #silver
