Stock Market Forecast | TSLA NVDA AAPL AMZN META MSFTStock Market Forecast | CME_MINI:NQ1! CME_MINI:ES1! QQQ AMEX:SPY
Mag 7 Forecast | NASDAQ:TSLA NASDAQ:NVDA AAPL AMZN META MSFT GOOG
ETF market

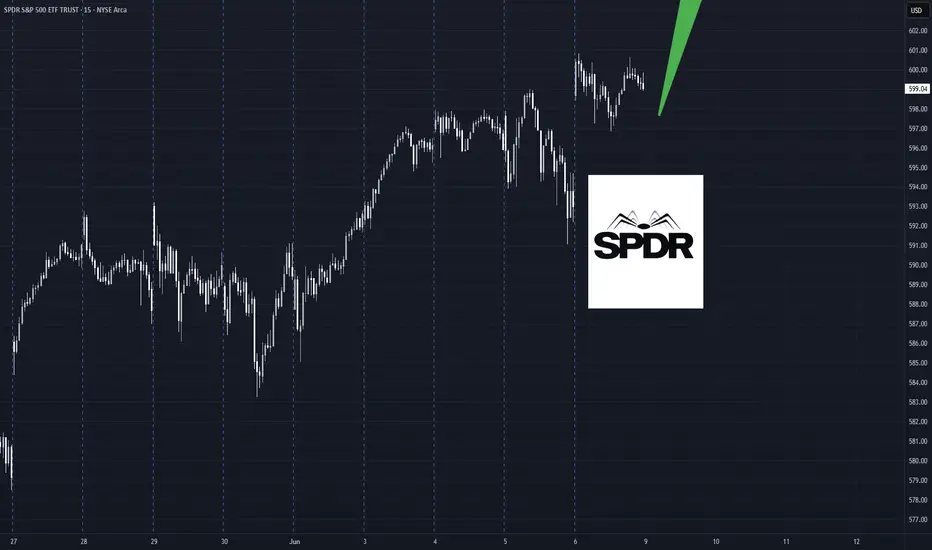
SPY Swing Trade Plan – 2025-06-06📈 SPY Swing Trade Plan – 2025-06-06
Bias: Moderately Bullish
Timeframe: 3–4 weeks
Catalysts: Strong institutional flows, trade talk optimism, solid jobs report
Trade Type: Long equity position
🧠 Model Summary Table
Model Bias Entry Stop Loss Take Profit Holding Period Confidence
DS Moderately Bullish $600.02 $595.54 $618.02 3 weeks 65%
LM Moderately Bullish $598.50 $586.70 $616–618 3–4 weeks 75%
GK Strongly Bullish $600.02 $592.00 $610.00 4 weeks 72%
GM Moderately Bullish ~$600.50 $587.50 $627.50 3–4 weeks 70%
CD Moderately Bullish $600–600.50 $585.00 $620 / $635 3–4 weeks 72%
✅ Consensus: SPY is in a bullish trend across timeframes
⚠️ Disagreements: MACD momentum and entry/pullback levels
🔍 Technical & Sentiment Summary
Trend: SPY above 10/50/200 EMAs on all models
RSI: 60–61 → bullish but not overbought
MACD: Mostly positive, DS cautious on daily histogram
Support Levels: $591.06, $595.54, $597.26
Resistance Zones: $600.83, $605.21, $610
VIX: 17.6 (declining), supports risk-on sentiment
News: Trade talk optimism and strong jobs data fueling momentum
✅ Final Trade Setup
Parameter Value
Instrument SPY
Strategy LONG
Entry Price $600.00
Stop Loss $588.00
Take Profit $625.00
Position Size 83 shares (1% risk on $100K)
Entry Timing At market open
Confidence 70%
💡 Rationale: Aligned bullish signals across timeframes, falling VIX, and strong macro sentiment favor a trend continuation move toward $625. Position sized for conservative risk management.
⚠️ Key Risks & Considerations
MACD divergence could signal near-term stall
Resistance zone at $605 may act as a cap
Macro volatility: Strong jobs could raise rate expectations
VIX Watch: A spike above 20 could reverse market trend
Exit Protocol: Consider closing if SPY closes below the 10-day EMA (~$591)
📊 TRADE DETAILS SNAPSHOT
🎯 Instrument: SPY
📈 Direction: LONG
💰 Entry Price: 600.0
🛑 Stop Loss: 588.0
🎯 Take Profit: 625.0
📊 Size: 83 shares
💪 Confidence: 70%
⏰ Entry Timing: Open
iBIT - Weekly Volatility Snapshot Good afternoon -- Here is my weekly perspective for NASDAQ:IBIT
IV (43.42%) entering the week sits in the 6th percentile for the year. HV10 (28.24%) has been lowering towards it's yearly lows of 23.43% showing a coiling of bi-weekly values at 95.19% from this -- and a divergence from IV of -15.81% . IV is chasing the sinking bi-weekly volatility trends. We generally could see a volatility bounce within this range or continue to grind to new volatility lows.
I always expect and prepare for both, Lewis Pastor once said, "in a scientific setting, chance favors the prepared mind". I hold that true in a lot of situational settings not just scientific, but find it to be very true with BITSTAMP:BTCUSD volatility and risk management.
Moving deeper into the week; what can we expect?
Well, I think that the final shakeout may be here as we consolidate more into the beginning of the week finalizing on Tuesday, June 3rd. I find significance on this date being the extension in time from selling off for 45 days after the initial 'W' distribution off the top -- potentially the start of the volatility swing back towards long-term trending means and maybe the start of another impulse run to track into..stay tuned to find out in observation.
If this week we find regression to HV63 (49.26%), it will be a swift and quick move showing lots of strength. The ability to capture premium between the difference of stated IV from lowering HV10 values to the volatility swing back up above IV to quarterly means, is what it is all about ! This capture can be upwards 5.84% as a volatility metric read and beyond, because when a volatility regression occurs, it moves past means until having to consolidate back downwards again. Rinse and repeat.
For those interested in volatility analysis and the application of weighted HV ranges to IV, I encourage you to BOOST and share this post, leave a comment, or follow me to join me on this journey.


S&P 500 in EUR - SHORT- in 15 days timeline
- broke the trendline that comes from 2020 to the downside
- retested and could not go above
- may try again and if fails again, then 25% correction likely

SPY: Swing Trading & Technical Analysis
Balance of buyers and sellers on the SPY pair, that is best felt when all the timeframes are analyzed properly is shifting in favor of the sellers, therefore is it only natural that we go short on the pair.
Disclosure: I am part of Trade Nation's Influencer program and receive a monthly fee for using their TradingView charts in my analysis.
❤️ Please, support our work with like & comment! ❤️

QQQ Will Collapse! SELL!
My dear friends,
QQQ looks like it will make a good move, and here are the details:
The market is trading on 529.85 pivot level.
Bias - Bearish
Technical Indicators: Supper Trend generates a clear short signal while Pivot Point HL is currently determining the overall Bearish trend of the market.
Goal - 521.53
About Used Indicators:
Pivot points are a great way to identify areas of support and resistance, but they work best when combined with other kinds of technical analysis
Disclosure: I am part of Trade Nation's Influencer program and receive a monthly fee for using their TradingView charts in my analysis.
———————————
WISH YOU ALL LUCK


Warren Buffett's Approach to Long-Term Wealth BuildingUnderstanding Value Investing: Warren Buffett's Educational Approach to Long-Term Wealth Building
Learn the educational principles behind value investing and dollar-cost averaging strategies, based on historical market data and Warren Buffett's documented investment philosophy.
---
Introduction: The Million-Dollar Question Every Investor Asks
Warren Buffett—the Oracle of Omaha—has consistently advocated that index fund investing provides a simple, educational approach to long-term wealth building for most investors.
His famous 2007 bet against hedge funds proved this principle in dramatic fashion: Buffett wagered $1 million that a basic S&P 500 index fund would outperform a collection of hedge funds over 10 years. He crushed them. The S&P 500 returned 7.1% annually while the hedge funds averaged just 2.2%.
Today, we'll explore the educational principles behind this approach—examining historical data, mathematical concepts, and implementation strategies for learning purposes.
---
Part 1: Understanding Value Investing for Modern Markets
Value investing isn't about finding the next GameStop or Tesla. It's about buying quality assets at attractive prices and holding them for compound growth .
For beginners, this translates to:
Broad Market Exposure: Own a cross-section of businesses through low-cost index funds
Long-term Perspective: Think decades, not months
Disciplined Approach: Systematic investing regardless of market noise
"Time is the friend of the wonderful business, the enemy of the mediocre." - Warren Buffett
Real-World Application:
Instead of trying to pick between NASDAQ:AAPL , NASDAQ:MSFT , or NASDAQ:GOOGL , you simply buy AMEX:SPY (SPDR S&P 500 ETF) and own pieces of all 500 companies automatically.
---
Part 2: Dollar-Cost Averaging - Your Secret Weapon Against Market Timing
The Problem: Everyone tries to time the market. Studies show that even professional investors get this wrong 70% of the time.
The Solution: Dollar-Cost Averaging (DCA) eliminates timing risk entirely.
How DCA Works:
Decide on your total investment amount (e.g., $24,000)
Split it into equal parts (e.g., 12 months = $2,000/month)
Invest the same amount on the same day each month
Ignore market fluctuations completely
DCA in Action - Real Example:
Let's say you started DCA into AMEX:SPY in January 2022 (right before the bear market):
January 2022: AMEX:SPY at $450 → You buy $1,000 worth (2.22 shares)
June 2022: AMEX:SPY at $380 → You buy $1,000 worth (2.63 shares)
December 2022: AMEX:SPY at $385 → You buy $1,000 worth (2.60 shares)
Result: Your average cost per share was $405, significantly better than the $450 you would have paid with a lump sum in January.
---
Part 3: The Mathematics of Wealth Creation
Here's where value investing gets exciting. Let's run the actual numbers using historical S&P 500 returns:
Historical Performance:
- Average Annual Return: 10.3% (1957-2023)
- Inflation-Adjusted: ~6-7% real returns
- Conservative Estimate: 8% for planning purposes
Scenario 1: The $24K Start
Initial Investment: $24,000 | Annual Addition: $2,400 | Return: 8%
Calculation Summary:
- Initial Investment: $24,000
- Annual Contribution: $2,400 ($200/month)
- Expected Return: 8%
- Time Period: 20 years
Results:
- Year 10 Balance: $86,581
- Year 20 Balance: $221,692
- Total Contributed: $72,000
- Investment Gains: $149,692
Scenario 2: The Aggressive Investor
Initial Investment: $60,000 | Annual Addition: $6,000 | Return: 10%
Historical example after 20 years: $747,300
- Total Contributed: $180,000
- Calculated Investment Gains: $567,300
Educational Insight on Compound Returns:
This historical example illustrates how 2% higher returns (10% vs 8%) could dramatically impact long-term outcomes. This is why even small differences in return rates can create life-changing wealth over decades. The mathematics of compound growth are both simple and incredibly powerful.
---
Part 4: Investing vs. Savings - The Shocking Truth
Let's compare the same contributions invested in stocks vs. a high-yield savings account:
20-Year Comparison:
- Stock Investment (8% return): $221,692
- High-Yield Savings (5% return): $143,037
- Difference: $78,655 (55% more wealth!)
"Compound interest is the eighth wonder of the world. He who understands it, earns it... he who doesn't, pays it." - Often attributed to Einstein
Key Insight: That extra 3% annual return created an additional $78,655 over 20 years. Over 30-40 years, this difference becomes truly life-changing.
📍 Global Savings Reality - The Investment Advantage Worldwide:
The power of index fund investing becomes even more dramatic when we examine savings rates around the world. Here's how the same $24K initial + $2,400 annual investment compares globally:
🇯🇵 Japan (0.5% savings):
- Stock Investment: $221,692
- Savings Account: $76,868
- Advantage: $144,824 (188% more wealth)
🇪🇺 Western Europe Average (3% savings):
- Stock Investment: $221,692
- Savings Account: $107,834
- Advantage: $113,858 (106% more wealth)
🇬🇷 Greece/Southern Europe (2% savings):
- Stock Investment: $221,692
- Savings Account: $93,975
- Advantage: $127,717 (136% more wealth)
🇰🇷 South Korea (2.5% savings):
- Stock Investment: $221,692
- Savings Account: $100,634
- Advantage: $121,058 (120% more wealth)
💡 The Global Lesson:
The lower your country's savings rates, the MORE dramatic the advantage of global index fund investing becomes. For investors in countries with minimal savings returns, staying in cash is essentially guaranteed wealth destruction when compared to broad market investing.
This is exactly why Warren Buffett's advice transcends borders - mathematical principles of compound growth work the same whether you're in New York, London, or Athens.
Note: Savings rates shown are approximate regional averages and may vary by institution and current market conditions. Always check current rates in your specific market for precise calculations.
---
Part 5: Building Your Value Investing Portfolio
Core Holdings (80% of portfolio):
AMEX:SPY - S&P 500 ETF (Large-cap US stocks)
AMEX:VTI - Total Stock Market ETF (Broader US exposure)
LSE:VUAA - S&P 500 UCITS Accumulating (Tax-efficient for international investors)
Satellite Holdings (20% of portfolio):
NASDAQ:QQQ - Technology-focused (Higher growth potential)
AMEX:VYM - Dividend-focused (Income generation)
NYSE:BRK.B - Berkshire Hathaway (Value investing & diversification)
---
Part 6: Implementation Strategy - Your Action Plan
Month 1: Foundation
Open a brokerage account (research low-cost brokers available in your region)
Set up automatic transfers from your bank
Buy your first AMEX:SPY shares
💡 Broker Selection Considerations:
Traditional Brokers: Interactive Brokers, Fidelity, Vanguard, Schwab
Digital Platforms: Revolut, Trading 212, eToro (check availability in your country)
Key Factors: Low fees, ETF access, automatic investing features, regulatory protection
Research: Compare costs and features for your specific location/needs
Month 2-12: Execution
Invest the same amount on the same day each month
Ignore market news and volatility
Track your progress in a simple spreadsheet
Year 2+: Optimization
Increase contributions with salary increases
Consider additional core holdings like LSE:VUAA for tax efficiency
Consider tax-loss harvesting opportunities
Visualizing Your DCA Strategy
Understanding DCA concepts is easier when you can visualize the results. TradingView offers various tools to help you understand investment strategies, including DCA tracking indicators like the DCA Investment Tracker Pro which help visualize long-term investment concepts.
🎯 Key Visualization Features:
These types of tools typically help visualize:
Historical Analysis: How your strategy would have performed using real market data
Growth Projections: Educational scenarios showing potential long-term outcomes
Performance Comparison: Comparing actual vs theoretical DCA performance
Volatility Understanding: How different stocks behave with DCA over time
📊 Real-World Examples from Live Users:
Stable Index Investing Success:
AMEX:SPY (S&P 500) Example: $60K initial + $500/month starting 2020. The indicator shows SPY's historical 10%+ returns, demonstrating how consistent broad market investing builds wealth over time. Notice the smooth theoretical growth line vs actual performance tracking.
Value Investing Approach:
NYSE:BRK.B (Berkshire Hathaway): Warren Buffett's legendary performance through DCA lens. The indicator demonstrates how quality value companies compound wealth over decades. Lower volatility = standard CAGR calculations used.
High-Volatility Stock Management:
NASDAQ:NVDA (NVIDIA): Shows smart volatility detection in action. NVIDIA's explosive AI boom creates extreme years that trigger automatic switch to "Median (High Vol): 50%" calculations for conservative projections, protecting against unrealistic future estimates.
Tech Stock Long-Term Analysis:
NASDAQ:META (Meta Platforms): Despite being a tech stock and experiencing the 2022 crash, META's 10-year history shows consistent enough performance (23.98% CAGR) that volatility detection doesn't trigger. Standard CAGR calculations demonstrate stable long-term growth.
⚡ Educational Application:
When using visualization tools on TradingView:
Select Your Asset: Choose the stock/ETF you want to analyze (like AMEX:SPY )
Input Parameters: Enter your investment amounts and time periods
Study Historical Data: See how your strategy would have performed in real markets
Understand Projections: Learn from educational growth scenarios
🎓 Educational Benefits:
This tool helps you understand:
- How compound growth actually works in real markets
- The difference between volatile and stable investment returns
- Why consistent DCA often outperforms timing strategies
- How your current performance compares to historical market patterns
- The visual power of long-term wealth building
As Warren Buffett said: "Someone's sitting in the shade today because someone planted a tree a long time ago." This tool helps you visualize your financial tree growing over time through actual market data and educational projections.
---
Part 7: Common Mistakes to Avoid
The "Perfect Timing" Trap
Waiting for the "perfect" entry point often means missing years of compound growth. Time in the market beats timing the market.
The "Hot Stock" Temptation
Chasing individual stocks like NASDAQ:NVDA or NASDAQ:TSLA might seem exciting, but it introduces unnecessary risk for beginners.
The "Market Crash" Panic
Every bear market feels like "this time is different." Historical data shows that patient investors who continued their DCA through 2008, 2020, and other crashes were handsomely rewarded.
---
Conclusion: Your Path to Financial Freedom
Value investing through broad index funds and dollar-cost averaging isn't glamorous. You won't get rich overnight, and you won't have exciting stories about your latest trade.
But here's what you will have:
Proven strategy backed by decades of data
Peace of mind during market volatility
Compound growth working in your favor 24/7
A realistic path to serious wealth creation
The Bottom Line: Warren Buffett's approach works because it's simple, sustainable, and based on fundamental economic principles. Start today, stay consistent, and let compound growth do the heavy lifting.
"Someone's sitting in the shade today because someone planted a tree a long time ago." - Warren Buffett
Educational Summary:
Understanding these principles provides a foundation for informed decision-making. As Warren Buffett noted: "The best time to plant a tree was 20 years ago. The second-best time is now" - emphasizing the educational value of understanding long-term investment principles early.
---
🙏 Personal Note & Acknowledgment
This article was not entirely my own work, but the result of artificial intelligence in-depth research and information gathering. I fine-tuned and brought it to my own vision and ideas. While working with AI, I found this research so valuable for myself that I could not avoid sharing it with all of you.
I hope this perspective gives you a different approach to long-term investing. It completely changed my style of thinking and my approach to the markets. As a father of 3 kids, I'm always seeking the best investment strategies for our future. While I was aware of the power of compound interest, I could never truly visualize its actual power.
That's exactly why I also created the open-source DCA Investment Tracker Pro indicator - so everyone can see and visualize the benefits of choosing a long, steady investment approach. Being able to see compound growth in action makes all the difference in staying committed to a strategy.
As someone truly said: compound interest is the 8th wonder of the world.
---
Disclaimer: This article is for educational purposes only and does not constitute financial advice. Past performance does not guarantee future results. Always consult with a qualified financial advisor before making investment decisions.

SOXX: Classic textbook movejust hitting resistance, nothing more for now.
That’s a clean trendline test on SOXX: strong bounce, but right at the line that’s been a ceiling since early 2024. Looks more like rejection than anything else. Price will sort it out soon.

No explanation put predictionas the header says; The market is likely to decline down to yesterday's low starting from right now

Update on the markets and what may come in June/JulySPY reached 90% of the down move from the top today, and that could be significant if we completed a larger B wave. Gold lost it's balance and probably goes lower. Oil is breaking up, as of now looks bullish. BTC had a nice pump but I think it will go lower.

MSTUMy original position, which I still have, was entered around $4.50, but well before the stock split. I bought some more after the peak, but before the dip after the dip. That's always the one that gets you. So that second position is a tad underwater, but hopefully not for long. If BTC can hold $100,000, that's nice to see. BTC can decide to do a massive inverse H&S off the top of the all-time BTC linear fib channel, which would take the price to $93,000. This would be totally fine. You just don't want to see that level fail.

SPY Macro Analysis: Premium-Discount Dynamics, Trade Setup etc..Macro Perspective:
The SPDR S&P 500 ETF Trust (SPY) is currently consolidating in a critical premium zone, with a tug-of-war between buyers and sellers. Economic uncertainty and broader market sentiment suggest a cautious approach, particularly with upcoming economic events (e.g., Fed policy updates, inflation data). The equilibrium level (~599) appears to be pivotal for directional bias.
Technical Breakdown
Premium Zone (599.80–606.19):
Price is testing key resistance levels near Fibonacci 0.886 and 2.618 extensions. A failure here could signal a bearish reversal.
A sustained breakout beyond 606.19 would open doors to higher targets (612–617.50).
Discount Zone (585–577):
A retracement into this zone could attract buyers looking for value entries.
Key support: 565.51 (swing low, potential liquidity grab).
Volume Dynamics:
Noticeable spikes at resistance levels, suggesting potential liquidity sweeps before a decisive move.
Trade Setup
Scenario 1: Bullish Continuation
Entry: Upon breakout and close above 606.19.
Stop-Loss: Below 604 (to avoid fakeouts).
Targets: 612 (initial), 617.50 (extended).
Risk-Reward: Maintain at least 1:3.
Scenario 2: Bearish Reversal
Entry: Upon rejection from the premium zone (~599–606).
Stop-Loss: Above 607.
Targets: 585 (initial), 577 (secondary).
Risk-Reward: At least 1:4.
Scenario 3: Discount Rebound
Entry: Bullish price action confirmation within the 585–577 range (e.g., engulfing candle, double bottom).
Stop-Loss: Below 575.
Targets: 599 (initial), 606.19 (secondary).
Risk-Reward: Adjust based on entry levels.
Risk Management
Position Sizing: Use no more than 2% of your account per trade.
Confirmation: Wait for clear price action signals or key volume levels to confirm entries.
Trailing Stop: Consider trailing stops to lock in profits during trending moves.
Macro Insights
Keep an eye on macroeconomic drivers like inflation data, job reports, and Federal Reserve commentary.
Correlation with bond yields and volatility (e.g., VIX) could provide additional cues for market sentiment.
💡 Pro Tip: Patience pays—let the price come to you. Always stick to your plan and maintain discipline in both entries and exits.

$AAPL 1 minute ago I PUBLISHED THIS SAME CHART BUT WITH NO INDICATORS. (NOW INDICATORS INCLUDED.
APPLE CONSOLIDATING LOOKING LIKE A POSSIBLE REVERSAL MAY HAPPEN SOON BUT
if the market becomes bearish and S&P break local key support we became bearish. APPL has been a late boomer, latest to give us a nice bounce to the upside ... if we break down from here we have either a fast liquidity grab or a slow leg down where I would surely add more.
See bothe trend support and indicators.
If you enjoy please let me know and I will start sharing more clean looking charts as this.

AAPL - AAPB ETF - NEUTRAL TURNING BULLISH APPLE CONSOLIDATING LOOKING LIKE A POSSIBLE REVERSAL MAY HAPPEN SOON BUT
if the market becomes bearish and S&P break local key support we became bearish. APPL has been a late boomer, latest to give us a nice bounce to the upside ... if we break down from here we have either a fast liquidity grab or a slow leg down where I would surely add more.
See bothe trend support and indicators.
If you enjoy please let me know and I will start sharing more clean looking charts as this.

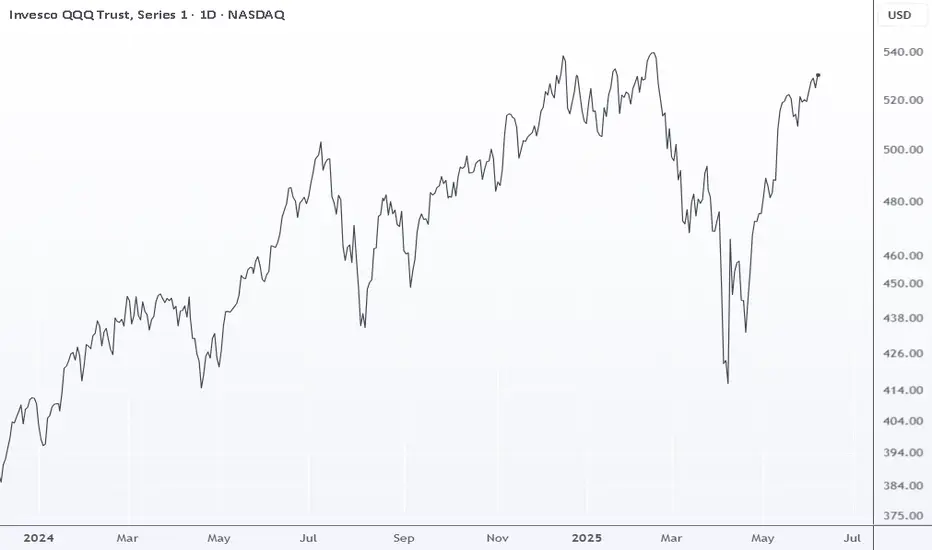
QQQ UPDATEQQQ is trading above the January open at 514.3; but given the high volatility seen in March and April, that’s not a positive setup. The bottom reversal from April already played out with 526 as the target. Taken together, these may be pointing to trouble ahead.
SPXL shortAfter SPY quick Up, there might be downside move.
Short entry 159
Stop 163,
Target 130, 100
Risk management is much more important than a good entry point.
I am not a PRO trader.
In my trading plan, the Max Risk of each short term trade should be less than 1% of an account.

Opening (IRA): SPY August 15th 502 Short Put... for a 5.10 credit.
Comments: Adding at a strike better than what I currently have on in August at the 535 strike, targeting the <16 delta paying around 1% of the strike price in credit.

SPY/QQQ Plan Your Trade For 6-6 : Inside-Breakaway Counter-TrendToday's pattern suggests the markets may attempt a Counter-trend type of Inside Breakaway pattern.
I read this as a downward price trend (counter to the current upward price trend).
The markets seem to have bounced overnight - prompting a potentially strong opening price level.
If my Inside-Breakaway shows up today, things could get very interesting if a breakdown in price sets up.
Many of you know I've been expecting a broader market breakdown to take place - sending the SPY/QQQ down about 7% to 13% or more.
It hasn't happened yet and the SPY/QQQ continue to try to push a bit higher - but, until we break to new highs, the breakdown event is still possible.
Let's see how things play out today. Platinum is showing that the global markets are entering an extreme speculative phase (very similar to 2000-2008). Transports are stalling, showing the US economy is expected to weaken over the next 3+ months.
Imagine that. Speculation is ramping up while the US market may move into a recession in H2:2025. Wow.
We certainly live in interesting times.
Get some.
#trading #research #investing #tradingalgos #tradingsignals #cycles #fibonacci #elliotwave #modelingsystems #stocks #bitcoin #btcusd #cryptos #spy #gold #nq #investing #trading #spytrading #spymarket #tradingmarket #stockmarket #silver

$QQQ // June 6 2025 // Analysis & Targets for Day TradersNASDAQ:QQQ // June 6 2025 // Analysis & Targets for Day Traders

BITx - Weekly Volatility SnapshotGood afternoon -- Here is my weekly perspective for CBOE:BITX
IV (86.99%) entering the week sits in the 3rd percentile for the year. HV10 (60.22%) has been lowering towards it's yearly lows of 47.87% showing a coiling of bi-weekly values at 87.65% from this -- and a divergence from IV of -26.77% . IV is chasing the sinking bi-weekly volatility trends. We generally could see a volatility bounce within this range or continue to grind to new volatility lows.
I always expect and prepare for both, Lewis Pastor once said, "in a scientific setting, chance favors the prepared mind". I hold that true in a lot of situational settings not just scientific, but find it to be very true with BITSTAMP:BTCUSD volatility and risk management.
Moving deeper into the week; what can we expect?
Well, I think that the final shakeout may be here as we consolidate more into the beginning of the week finalizing on Tuesday, June 3rd. I find significance on this date being the extension in time from selling off for 45 days after the initial 'W' distribution off the top -- potentially the start of the volatility swing back towards long-term trending means and maybe the start of another impulse run to track into..stay tuned to find out in observation.
If this week we find regression to HV63 (99.73%), it will be a swift and quick move showing lots of strength. The ability to capture premium between the difference of stated IV from lowering HV10 values to the volatility swing back up above IV to quarterly means, is what it is all about! This capture can be upwards 12.74% as a volatility metric read and beyond, because when a volatility regression occurs, it moves past means until having to consolidate back downwards again. Rinse and repeat.
For those interested in volatility analysis and the application of weighted HV ranges to IV, I encourage you to BOOST and share this post, leave a comment, or follow me to join me on this journey.

2X Levered TESLA TSLL: $7.23 level since 2023Since 2023, when TSLL 2X levered Tesla hit $7.23 it tend s to see significant upside. The chart show the peak profit levels from the $7.23 level. I am waiting for it to drop below and then buy when price rises above the level. The horizonal arrows at the top show how many days it takes to hit the peak in trade. The horizontal arrow on the bottom indicated the number of days it tool to fall from the peak to the next buying level.
