$SPY Leaning Bearish: Dipping out of Rising Pennant Looking at Key Ranges, Pivot Points, and MA's on multiple timeframes with the sum leaning more bearish for me.
Feel free to give your thoughts/perspectives!
ETF market

Nightly $SPY / $SPX Scenarios for June 6, 2025 🔮 Nightly AMEX:SPY / SP:SPX Scenarios for June 6, 2025 🔮
🌍 Market-Moving News 🌍
🇺🇸 U.S. Labor Market in Focus
Investors are closely watching the upcoming May employment report, which is expected to show a gain of 125,000 jobs, down from 177,000 in April. The unemployment rate is anticipated to remain steady at 4.2%. These figures will provide insights into the labor market's response to recent economic pressures, including tariff impacts .
🇮🇳 RBI Expected to Cut Rates Amid Low Inflation
The Reserve Bank of India (RBI) is anticipated to announce a 25 basis point cut in the repo rate on June 6, marking the third consecutive reduction. This move aims to support economic growth amid persistent low inflation and global uncertainties .
📊 Key Data Releases 📊
📅 Friday, June 6:
8:30 AM ET – U.S. Employment Report (May):
Analysts expect non-farm payrolls to increase by 125,000, with the unemployment rate holding at 4.2%. Average hourly earnings are projected to rise by 0.3% month-over-month. These figures will be critical in assessing the health of the labor market and potential Federal Reserve policy actions .
3:00 PM ET – U.S. Consumer Credit (April):
The Federal Reserve will release data on consumer credit, with forecasts predicting an increase of $10 billion. This report will shed light on consumer borrowing trends and financial health .
⚠️ Disclaimer:
This information is for educational and informational purposes only and should not be construed as financial advice. Always consult a licensed financial advisor before making investment decisions.
📌 #trading #stockmarket #economy #news #trendtao #charting #technicalanalysis

QQQ (Invesco QQQ Trust) – Premium Rejection & Gap Fill Probabili🕐 1H Chart | Smart Money Concepts | Volume: 362.69K
📍 Price: $525.82 (as of June 5, 2025)
📌 Market Context: Nasdaq-heavy ETF reacting near historical highs
🧠 Technical Outlook
🔴 Weak High formed at the Premium Zone around $530–533 — an area of prior liquidity hunts and seller reactivation
📉 BOS + CHoCH (Break of Structure + Change of Character) confirm potential short-term bearish rotation
📦 Multiple Inefficiencies / FVGs stacked below $520, with visible Gap Fill Zones targeting $510 → $490
⚖️ Equilibrium Area: $480–485, where institutional rebalancing may occur
📊 Risk Management Plan
Short Entry Zone: $526–530 (upon confirmation of weak high rejection)
Initial Target: $510 (gap fill)
Secondary Target: $485 (EQ zone)
Stop-Loss: Above $533 (invalidates the rejection thesis)
📌 Risk-Reward: Approx. 3.2R depending on entry
🔒 Position Sizing: Use no more than 1.5% of capital per trade due to macro catalysts (see below)
📈 Probabilistic Outcomes
🟢 Bearish Play (65% Probability): High likelihood of price returning to fill imbalance zones & tap EQ block
🟡 Sideways Chop (25%): If macro remains indecisive, range may form between $515–$530
🔵 Invalidation Bull Rally (10%): Break and hold above $533 invalidates this trade setup
🌐 Macro & Catalysts to Watch
📉 Semiconductor Drag: QQQ is heavily exposed to tech; semis are still underperforming YTD (–17.53%)
🛃 Trade Tensions: Rising tariffs and protectionism (China–US) may weigh on large-cap growth names
🧾 ETF Inflows: While QQQ saw +$571M inflows in early June, positioning could be crowded
💬 Upcoming Events:
FOMC rate decision (June 12)
NVDA + AAPL earnings over the next 10 trading days
🧠 Strategic Insight
Short-term liquidity has likely been swept at highs. Institutions could drive price lower to mitigate risk exposure ahead of major macro events. Expect volatility spikes near economic data releases.
🛡️ This is a tactical swing-to-intraday short opportunity with defined parameters. Trade the levels, not the hope.
#QQQ #SmartMoneyConcepts #GapFill #PremiumZone #RiskManagement #ETFStrategy #MacroTrading #LiquiditySweep #VolumeProfile #WaverVanirInternational

QQQ new lows incoming?QQQ has been consolidating in a massive rising wedge and looks set to break down from it.
Unless price can get back above previous highs, then new lows is the most likely outcome here.
I've marked off support levels on the downside that might be good opportunities to scale in on the long side.
Let's see how low we go.

$SPY bearish, to break April lows?Most people are thinking that we'll see a correction that goes back to the $560 area and then from there, we'll go to new highs. They also don't think it's likely that we'll retest the lows from April and think it's nearly impossible that we'll break the lows.
However, my base case is that we will break the lows. Yes, in the past, most dips like the one in April were good buying opportunities, but the chart looks different here.
You can see that ever since April, all we've done is consolidate up into a rising wedge.
We look set to break down from that in the coming days. If we do break down and are unable to reclaim the highs, then I think my base case will become the highest probability outcome.
I think it's likely that the move down will take us to the $424- 402 levels. Let's see what happens.

VXX LongAfter SPY quick UP, VIX is Low, there might be next SPY move to the downside.
Long entry 51.5
stop 50. buy Option, Max risk is same as stop 50.
Target 65
Risk management is much more important than a good entry point.
I am not a PRO trader.
In my trading plan, the Max Risk of each short term trade should be less than 1% of an account.

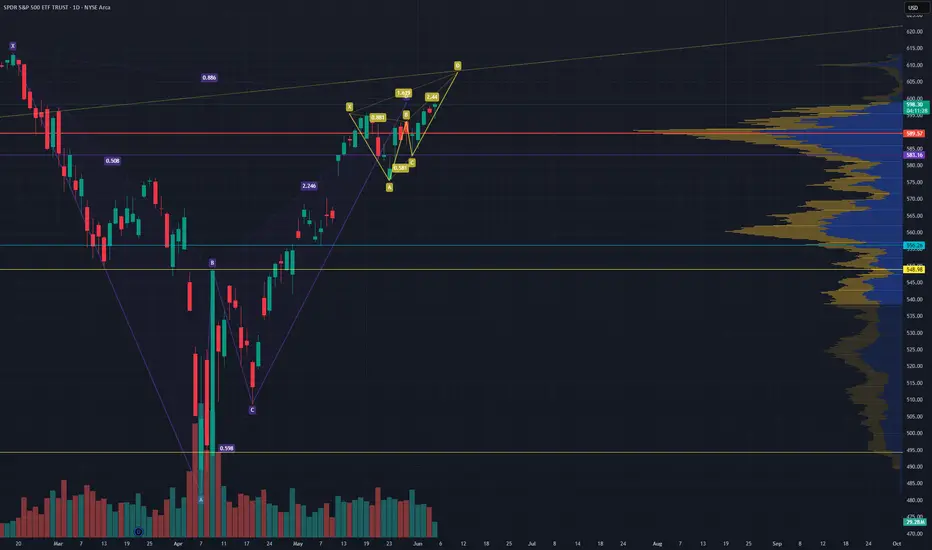
Big BAT Little Deep Crab on SPY WTF is going on with the marketI don't know what to make of this market but the BAT completed and what looked like a cup and handle is starting to look like a BAT and a deep crab. The deep Crab finishes right around a trendline I have that goes way back.
Publishing for tracking purposes
#SPY
SPY/QQQ Plan Your Trade For 6-5 : Inside BreakawayToday's SPY Cycle Pattern is an Inside Breakaway pattern - which indicates the markets want to try to break away from the sideways range I've been sharing with you.
Gold and Silver are making a very big move higher this morning - which may be indicative of some crisis or military conflict move throughout the world.
I see this move in Metals as a bit of a warning to the global markets. Metals hedge global risk levels. A rise in metals suggests traders fear some crisis event and are banking on Silver/Gold as an efficient hedge.
BTCUSD is still trading within the sideways channel as well. I see BTCUSD less as a hedge and more as a technology/Block-chain asset. No matter how you slice it, BTCUSD is not really an alternate currency, it is a Technology asset.
We could see some big moves over the next 2-5+ days because of how the markets are setting up and how Gold/Silver are reacting.
Buckle Up.
Get Some.
#trading #research #investing #tradingalgos #tradingsignals #cycles #fibonacci #elliotwave #modelingsystems #stocks #bitcoin #btcusd #cryptos #spy #gold #nq #investing #trading #spytrading #spymarket #tradingmarket #stockmarket #silver

Thesis on the SPY ETF being rigged (live demonstration 5/5/25)Worlds Saddest Story
I have an algorithm running to find order block's in the form of resistance in the market at any given time. Here I will show the power of computers and how they both effectively and unknowingly create a repeatable system than unfortunately rigs the market to act in predictable ways. This theory will be tested at open today and lucky souls who find this thesis before open will have a rare opportunity to witness these events unfold. The events I am referring to are the SPY ETF opening at or around 597.75~ and immediately creating the high point of the day and promptly descending to create a market drop that exceeds 1% by EOD. While it is rather unfortunate and unfair that the stock market, a once globally competitive market for people to fund ventures, has now turned into a profit making machine for math specialists who have an knack for understanding price movements that inevitably widens the wealth gap for the rich that can afford to invest in computer driven algorithms, while the working man must try to create their own system that CAN NEVER consistently beat the machine.
TL/DR: Bet on the SPY ETF making a high off open and plummeting over 1%

SILVER Multi year Breakout in the works. SLV /SIAMEX:SLV – Silver Setting Up for a Multi-Year Breakout
Silver is quietly coiling under a major 10+ year breakout level, and AMEX:SLV is right in the center of it — with a powerful setup developing.
🔹 Long-Term Breakout Level: $31.75
AMEX:SLV is pressing up against $31.75, a key breakout spot that hasn't been breached in over a decade.
We're currently printing two inside days following a power candle — classic tension-building price action.
🔹 Sector Tailwinds
Gold ( AMEX:GLD ) is up over 1% today — if silver catches up, AMEX:SLV could explode.
A green day here could confirm the strength we need to trigger a move through that decade-level resistance.
🔹 My Trade Plan:
1️⃣ Initial Entry: Looking to go red-to-green on today’s candle.
2️⃣ Add on Confirmation: Double up on a clean breakout over $31.75.
3️⃣ Execution: Using a mix of AMEX:SLV calls and /SI silver futures contracts to capture the move.
4️⃣ Stop: Below inside day lows or Friday’s low depending on the entry timing.
Why I Like This Setup:
Massive long-term breakout on deck = explosive potential.
Inside days = tight risk, big reward.
Sector momentum is lining up with a clean, tradable chart pattern.

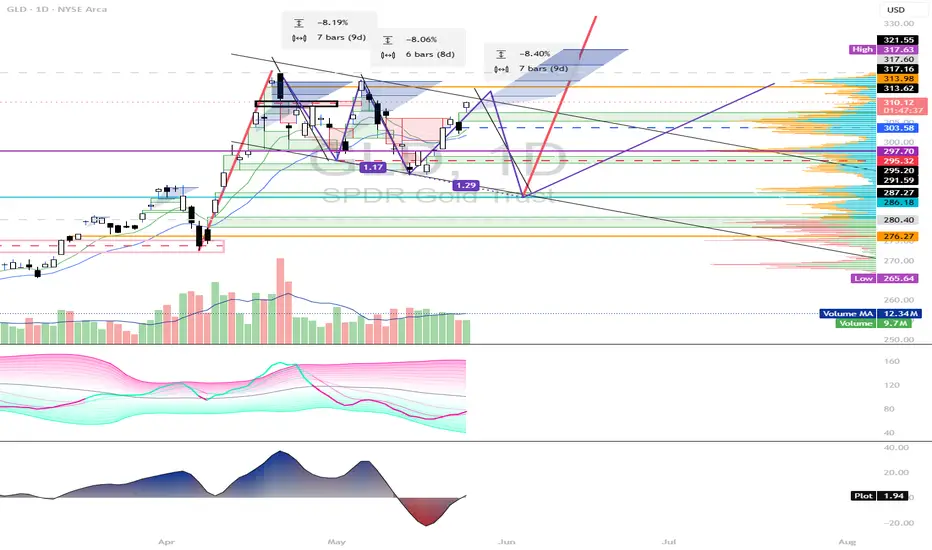
Three drive GLD setup, to simple?Gold is in a lot of media right now and everyone probably has some exposure, i myself am here and as are you. Im taking my chips and placing it on a short setup before a run if there is one. Three drives pattens on candles with bearish sentiment TA, LL, LH, opex is over, yada yada.
GL
$IWM Major bottormAs you can see the market has been slowing plattoing at this area, while AMEX:IWM has been underperforming AMEX:SPY and NASDAQ:QQQ , there are 2 different scenarios that can play out.
1. Either this will break the major lower grey trendline and look like HSI:HSI , which means that the whole US market will enter a massive long term recession.
2. Or market reneters an new era of this 3-4 year bull market where the AMEX:IWM severly outperfoms the MEGA 7.
Now why is 2. the most probable. Because of basic EW pattern , trendline major support , volume building and that all major index funds are in the process of breaking out.
Now the big question is whether this is the best price you will get , or more techincally, whether we are going to get another touch on the lower major support trendline before starting the new 5 wave pattern.
As you can see from the white paint on my chart(yes i am a painter), we can see that supports on that line only come on the major EW pattern, therefore the next lower high will not be on the lower trendline, but just one above as shown at the foreshadowing EW i have on the graph.
thanks for reading

Introduction to HFT Involvement in financial marketsIntroduction to HFT Involvement in financial markets
Market Making algorithms continuously post buy (bid) and sell (ask) limit orders, aiming to earn the bid- ask spread while providing liquidity. HFT market makers function much like traditional market makers but at much higher speed and scale. They simultaneously quote both sides of the market and profit from the small price differential (spread) between bids and asks . Exchanges often incentivize market makers via liquidity rebates (fractions of a penny per share) for adding liquidity, which HFT firms capitalize on through very large trading volumes. Over the past two decades, human specialists have largely been supplanted by automated HFT market makers, which now dominate liquidity provision. Limit orders are prioritized over market orders, which in some capacity is fair; however special order types made for HFT that are just slightly more advanced limit orders are prioritized over regular limit orders but are not accessible by retail investors is very unfair. If you search up the IEX exchange website and look at their order types you can see that they are targeting HFT system creators and retail isn't able to use those products themselves.
Statistical Arbitrage (Stat Arb) strategies use quantitative models to exploit pricing inefficiencies among related instruments. In traditional stat arb, a trading system might track a portfolio of securities and identify when price relationships deviate from statistical norms, betting on convergence. In an HFT context, stat arb often means very short-term, high-speed versions of these tactics, sometimes called “data-driven” or “quantitative” HFT strategies. These strategies are market-neutral and typically involve trading a long-short portfolio of correlated assets based on mean reversion expectations. For example, an HFT stat-arb algorithm might monitor price spreads between an ETF and its underlying basket of stocks, or between index futures and the index’s component equities, and rapidly trade to exploit divergences before they close. One common HFT arbitrage is index arbitrage – comparing the real-time value of an index future (say the S&P 500 E-mini) with the aggregated price of the index’s constituent stocks. If the future is temporarily overpriced relative to the underlying, the algo will sell the future and buy the basket (or vice versa), capturing a virtually risk-free profit as prices realign. This is a relatively difficult strategy but is also the strategy I primarily focus on building since as someone who lacks resources, it is the one thing I can make, test, and deploy from my computer.
Latency Arbitrage strategies exploit tiny timing differences in information arrival between trading venues or market participants. If one market moves slightly before another, an HFT latency-arb algorithm can capitalize by racing to trade on the slower venue with knowledge of the price change that is about to occur. In essence, this is a race condition: the fastest trader to react to new information can “pick off” resting orders on venues that have not yet updated their prices. Latency arbitrage is often considered a predatory strategy – it’s been described as effectively front-running public information by virtue of speed. Virtually every time you place a trade through a broker, one of these systems will profit off you buy being payed a maker taker fee for bringing you to an exchange; this isn't fair since in many cases you'll be brought to the BATS exchange which pays the taker and charges the maker (every other exchange does the opposite) and you'll still be stuck paying a commission that someone else profits from.
Event-Driven HFT strategies focus on trading around news or specific trigger events. These algorithms rapidly analyze real-time news feeds, economic data releases, earnings reports, or even social media, and execute trades before human traders can react. In the modern market, machine-readable news feeds and NLP (Natural Language Processing) models are integrated directly into some HFT systems. For example, an event-driven algo might parse a company’s earnings press release the instant it appears and decide to buy or sell the stock based on whether results beat or miss expectations – all within milliseconds. HFT firms subscribe to low-latency news services and sometimes even co-locate servers near newswire sources to get a time advantage in receiving the information. This is self explanatory, just whatever system can react to news the fastest wins.
Some of the more controversial HFT strategies involve detecting liquidity and exploiting it, or conversely avoiding adverse selection from toxic order flow. Liquidity detection algorithms (sometimes called “pinging” strategies) attempt to sniff out hidden orders and large trading interest in the market. HFT firms may send out a flurry of tiny orders – often immediate-or-cancel (IOC) orders for 100 shares or 1 lot – across different price levels or venues to probe for supply or demand. If these pinging orders get hits (even partial fills), it indicates the presence of a large buyer or seller hidden in the order book or a dark pool. The HFT’s algorithm can then escalate its activity: for example, if a ping reveals a big buyer in a dark pool, the HFT might buy up shares on other venues and then sell into the buyer’s demand at a higher price. I'd compare this to playing call of duty and throwing a stun grenade into a room before entering, if someone gets stunned and you get +25 points, you know to move in immediately, and if you don't stun someone, you may proceed with caution.
Momentum Ignition refers to a strategy where a trader deliberately attempts to ignite a rapid price movement – up or down – and capitalize on the frenzy that follows. An HFT or algorithmic trader employing momentum ignition will initiate a series of aggressive orders (market orders or large trades) in a short span, hoping to spark other algorithms or investors to also start buying or selling, thereby driving the price further in that direction. Once momentum takes hold, the instigator can profit by flipping their position (for example, buying shares to start an up-move, then selling into the rally they created). This is what happens every time you see newsa drop and the price of the stock goes in the opposite direction for a split second
Spoofing and Layering are abusive tactics where a trader places non-genuine orders to mislead other market participants about supply or demand, with the intent to cancel those orders before execution. They are illegal in most jurisdictions (for example, spoofing was explicitly outlawed in the US via the 2010 Dodd- Frank Act). These tactics deserve discussion both to understand how rogue algorithms might attempt them and how modern systems detect and prevent them. Currently an order can be cancelled in 0.5 seconds after it has been placed legally.
In essence all of these are ways of fooling retail and institutional investors to profit off their lack of knowledge; I think its important to be informed hence I am pointing this out and publicizing it. There are 100's of pages on the federal registry that will tell you how HFT algorithms are screwing you (the retail investor) over and with all that being said I believe that investing should be left to computers as they have taken over the market. It isn't fair but it's how the world works now. You are just liquidity swimming in pools for larger fish to feed off.

GLD Swing Trade Setup – 6/18 $320 Call for 5–10 Day Breakout Mov🟡 GLD Swing Trade Setup – 6/18 $320 Call for 5–10 Day Breakout Move
📅 Trade Date: June 4, 2025 | 📈 Timeframe: 5–10 Day Swing
🎯 Playing a bullish continuation with defined risk & strong confidence
🧠 Multi-Model Consensus
Model Bias Strategy Strike Entry PT SL Confidence
Composite Mod. Bullish Long Call 320 1.68 2.52 0.84 75%
🔎 Technical & Sentiment Overview
Weekly Chart: Price > EMAs, clean bullish MACD crossover
15-min Chart: Consolidating near $311–$313 support, breakout forming
Sentiment: Bullish news tailwinds (gold demand, USD weakening)
Max Pain: $308 = short-term pullback risk
Implied Volatility: Stable with limited crush risk
Options Flow: Moderate OI build in $313–$325 calls, upward bias
🎯 Trade Setup – Long GLD Call
Instrument: GLD
Direction: CALL (LONG)
Strike: $320.00
Expiry: 2025-06-18
Entry Price: $1.68
Profit Target: $2.52 (50% gain)
Stop Loss: $0.84 (50% loss)
Size: 1 contract
Entry Timing: Market open
Confidence: 75%
⚠️ Risk Management & Considerations
🛑 SL Discipline: Exit if premium drops to $0.84
🕒 Time Stop: Exit within 7–10 days if trade stagnates
🔁 News Risk: Watch for economic releases and dollar strength reversals
⚖️ Support Check: Must hold $310.50 zone on M15 chart
✅ Trade Thesis Summary
With GLD holding bullish structure on higher timeframes, models show strong agreement on upside continuation. We're targeting the $320 breakout with a controlled-risk weekly option.

Cycle shifts don’t happen overnightCycle shifts don’t happen overnight!
Long-term inflation fears have been growing since October 2022,
Recent tariff announcements have amplified these concerns, adding uncertainty and potentially raising costs for U.S. goods.
#Pirri

Nightly $SPY / $SPX Scenarios for June 5, 2025🔮 Nightly AMEX:SPY / SP:SPX Scenarios for June 5, 2025 🔮
🌍 Market-Moving News 🌍
🇺🇸 JOLTS Job Openings Surprise to Upside
U.S. job openings unexpectedly rose to 7.39 million in April—well above forecasts—indicating that labor demand remains robust despite macro headwinds and trade-policy uncertainty
🛢️ OPEC+ Greenlights July Supply Increase
OPEC+ agreed to boost production by 411 K barrels per day starting in July, adding downward pressure to oil prices and weighing on energy equities
📈 Fed’s John Williams Signals Patience
New York Fed President John Williams reiterated that the Fed sees no urgency to cut rates, citing mixed inflation signals and a balanced labor market—keeping investors cautious on rate-cut timing
📊 Key Data Releases 📊
📅 Thursday, June 5:
8:30 AM ET – JOLTS Job Openings (April)
Measures total U.S. job vacancies, a leading indicator of labor-market strength.
10:00 AM ET – OPEC+ Press Conference (Post-Meeting)
Details on production quotas for July, guiding energy market supply expectations.
⚠️ Disclaimer:
This information is for educational and informational purposes only and should not be construed as financial advice. Always consult a licensed financial advisor before making investment decisions.
📌 #trading #stockmarket #economy #news #trendtao #charting #technicalanalysis


Short - SPYPrice testing the neckline - yellow line at ~$588.20
Elliot Wave 12345 ABC: Wave 5 completed. Expect for Wave A
Support line to enter put: ~$582.15
Put option expiration 5/23/25 or 5/27/25
PT1: ~$569.20
PT2: ~555.80

6/4/25 - $bug - Love cyber. But short hedge.6/4/25 :: VROCKSTAR :: NASDAQ:BUG
Love cyber. But short hedge.
- while the moon bois r back to leveraged long stonk
- i'm, yet again, taking the opposite POV and spending 80% of my time finding out how to keep a high cash, well hedged book which means finding strategic shorts and hedges
- NASDAQ:BUG is an interesting candidate b/c the IV on a lot of these multi-month ATM puts r in the 20-ish land, that's mental considering... the individual names are all (equivalently) in the 40s IV... and trade 15-30x sales.
- these names r some of my favorites, but the bounce has been so intense 50-100% for many... that it's hard to see that if/ as we go higher these are somewhat constrained by profit taking and on the downside... they revert to mean much faster
- take for instance #2 holding NASDAQ:CRWD today. EPS just not rewarded. 25x sales. sure sales growth great, mgns "great". but let's put the reality glassed back on.
- by no means do i think crwd is a LT short. but if you're going to give me 20-1 leverage ATM on something like this for 20 IV... i'll gladly use that hedge
- for about a 1% position, i'm able to get ATM 20% effective gross hedge on names that r not pushing higher?
- always miserable biz to short/ hedge. and if anyone knows, it's me. i used to do this professionally. it's the most thankless business on the planet. you win... while everyone else loses... you still feel like sht. and if u lose while mkt moves higher (or underperform) you feel like sht. but you do it because it's sometimes the most prudent thing to do
- again 1% of book... 20% gross short ATM for these names for 3 mo of protection and i'm riding +20% ytd... seems like a good use of capital esp against my more illiquid gas name $gamb.
let's see. just flagging that often times if u want to short a single name, you're best off evaluating the WHOLE sector to see if an ETF is large enough ( NASDAQ:BUG is >$1 bn AUM) and likely the IV will be a whole lot lower than these single names.
alas who knows. just an idea.
V

QQQ – Watching for Continuation Above 529Markets are whispering strength.
After reclaiming key structure levels, QQQ is attempting a clean breakout. If momentum persists above this consolidation range, we may be stepping into a measured expansion phase.
Not a call to action—just something worth watching 👀
Levels above remain untapped.
📍 Keep your chart open. The tape might speak soon.
#QQQ #BreakoutWatch #LiquidityZones #PriceAction #MarketInternals #WaverVanir #SmartMoneyConcepts #VolumeAnalysis #TradingView

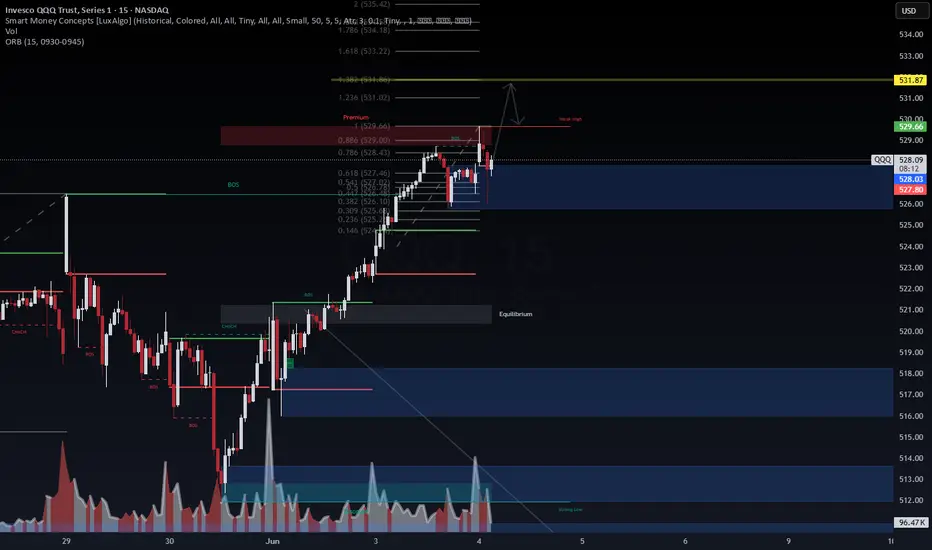
QQQ 15-min – Eyes on Key Liquidity ZonesWe’ve seen strong bullish structure with multiple BOS confirmations. Price is currently consolidating above the 0.618 retracement and reclaiming a previous FVG zone. Volume has cooled off, but key levels around 528.40–529.00 could be revisited soon.
If we reclaim the weak high with momentum, the path toward the 1.382–1.618 extensions (531.80–533.20) may open up. Until then, watching how price behaves around 527.50–526.10 for potential reaction.
🕵️♂️ No need to chase — the setup is developing. Sometimes patience is alpha.
📌 Levels to watch:
Liquidity: 529.00–529.66
Target zone: 531.87–533.22
Demand: 526.10–527.00
#QQQ #SMC #Fibonacci #Liquidity #TechStocks #WaverVanir #PriceAction #SmartMoney
SPY/QQQ Plan Your Trade For 6-3 : Carryover in Carryover modeToday's pattern suggests we may see more upward price consolidation/trending.
As many of you already know, I've been tracking the Excess Phase Peak pattern all the way up this incredible rally from the $480 lows on the SPY. In my opinion, we have moved into the "island" topping phase where price is struggling to break either upward or downward right now.
Currently, price seems to be attempting to break to the upside after yesterday's meltup. Today should be interesting because we could see solid REJECTION of yesterday's move with a big breakdown move. We'll see how things play out.
The SPY trend is still BULLISH based on my research. Thus, until and IF we get a breakdown, traders should continue to expect a MELT UP type of trend in the SPY/QQQ.
Hedging trades is a good idea right now.
Gold and Silver had a big move early this week and have not stalled into a sideways FLAGGING trend. By my estimates, the APEX of the flag will come near 1900-2100 today (Wednesday 6-3). That is when I think Gold/Silver will attempt to move into extreme volatility and attempt to make another big move.
I hope it is to continue the upside price trend, as this breakout move needs to push higher (breaking recent highs) for metals to move into a new dominant upward price trend.
BTCUSD is trading sideways - possibly setting up that DOUBLE-TOP pattern I suggested was going to take place on 5-20-25. Now, with Bitcoin leading the US markets by about 3-5 days (on average), we'll see if BTCUSD can attempt to move into another rally phase or if BTCUSD breaks below the $103k level and moves into a new downward price phase.
In my opinion, look out below.
Get some.
#trading #research #investing #tradingalgos #tradingsignals #cycles #fibonacci #elliotwave #modelingsystems #stocks #bitcoin #btcusd #cryptos #spy #gold #nq #investing #trading #spytrading #spymarket #tradingmarket #stockmarket #silver

IBIT — Ishares Bitcoin Trust. Under Bearish PressureThe iShares Bitcoin Trust ETF (IBIT) has been a mixed performer year to date, with its price up and down around 20 percent this year and currently tracking for low double-digit returns in 2025.
The ETF currently trades around $59.36–$60.40, with assets under management of around $68 billion and a 0.1 percent premium to net asset value (NAV).
1-Hour Technical Outlook
On the 1-hour time frame, technical indicators are mixed but generally bearish:
Moving Averages: Short-term moving averages (e.g. 200-hour SMA/EMA) are currently signaling a Sell signal as the price moved below these averages in late May.
Support and resistance: The ETF faces resistance around $61, corresponding to the broken 200-hour SMA, and support around $54, with stronger volume-based support around $47, corresponding to the beginning of the April rally.
RSI indicator: Over the last 20 days, the RSI(55) indicator has already been briefly noted below the baseline of 50, highlighting the need for more active risk management, since, as we can see from the chart, the indicator has again moved into the risk zone in late May and early June (where it currently remains), accordingly, for a longer term.
Volatility: During the recovery period in April-May 2025, the ETF demonstrated moderate intraday volatility (with half the 200-hour sigma value (σ) of about 3.5 percent), while the 20-hour decline on May 22-23, which exceeded this value, has provided at that time clear arguments for more active risk management.
To summarize, we can say that NASDAQ:IBIT is experiencing a pullback, technical indicators point to local persistence of bearish sentiment, following the classic, empirically proven adage of the financial market "Sell in May - and Go away."
--
Best wishes,
@PandorraResearch Team
