600 before 580?, Jolts, Jobs Data, calling China🎮 What’s Happening Now:
1. The market trades like a simulation.
Levels get hit to the penny and reverse.
Fake breakouts, engineered sweeps, and chop-fests designed to trigger stops and crush premium.
It’s like trading inside a casino that reads your mind and moves the exit every five minutes.
2. AI + HFT firms front-run sentiment and order flow.
They scan Reddit, Discord, X, TradingView, and even order book imbalances in real time.
The second you find an edge, they’re already there—front-running or fading it.
3. Implied volatility and option decay weaponized.
They bait you in with movement, then nuke premiums before you can cash out.
If you're not closing green trades fast, they flip red—"correct trades, wrong time frame" syndrome.
⚖️ What Retail Is Up Against:
Smart order routers sniffing your orders.
Liquidity gaps intentionally created then filled.
Volume surges that mean nothing—just decoys.
AI-driven volume clusters that draw you in and dump you out.
💡 What some traders are doing to adapt:
Selling premium with iron condors, calendars, butterflies—less directional, more probability-based.
Trading futures or futures options, where fills are better and data is cleaner.
Sniping high-R:R setups, holding nothing overnight unless it's ironclad.
Using AI to fight AI—some build their own bots to scan volume shifts, OI skews, or gamma pins.
ETF market

Nightly $SPY / $SPX Scenarios for June 3, 2025 🔮 Nightly AMEX:SPY / SP:SPX Scenarios for June 3, 2025 🔮
🌍 Market-Moving News 🌍
🏭 U.S. Manufacturing Slump Persists
U.S. manufacturing contracted for the third consecutive month in May, with new orders, backlogs, production, and employment all declining. Trade-war disruptions and elevated input costs continue to squeeze factory margins, setting the stage for today’s ISM Manufacturing PMI release
🌐 Global Trade Tensions Weigh on Stocks
Renewed U.S.–China tariff threats sent the S&P 500 lower overnight, as investors fear higher costs for exporters and slower global growth. Futures pointed to another rough open for $SPY/ SP:SPX
📈 China Caixin PMI Exceeds Expectations
China’s May Caixin Manufacturing PMI unexpectedly rose to 50.8, signaling stabilization in export-oriented factories despite ongoing trade uncertainty. That positive surprise may offer some support to Asian equities today
📊 Key Data Releases 📊
📅 Tuesday, June 3:
8:30 AM ET – ISM Manufacturing PMI (May) Measures U.S. factory-sector health; readings below 50 indicate contraction. Today’s survey will confirm if the May downturn persists.
10:00 AM ET – Construction Spending (April) Tracks monthly change in total construction outlays—an important gauge of housing and infrastructure investment trends.
1:00 PM ET – 10-Year Treasury Note Auction Benchmark auction that influences the yield curve. Weak demand or higher yields here can pressure equities, especially growth-oriented sectors.
⚠️ Disclaimer:
This information is for educational and informational purposes only and should not be construed as financial advice. Always consult a licensed financial advisor before making investment decisions.
📌 #trading #stockmarket #economy #news #trendtao #charting #technicalanalysis

Rally Maybe As of know we in n mans land
have to wait see we break 613 I think they do
why QE behind the scene
have a hedge in case we drop

USO Stock Chart Fibonacci Analysis 060225Trading Idea
1) Find a FIBO slingshot
2) Check FIBO 61.80% level
3) Entry Point > 67.8/61.80%
Chart time frame:B
A) 15 min(1W-3M)
B) 1 hr(3M-6M)
C) 4 hr(6M-1year)
D) 1 day(1-3years)
Stock progress:A
A) Keep rising over 61.80% resistance
B) 61.80% resistance
C) 61.80% support
D) Hit the bottom
E) Hit the top
Stocks rise as they rise from support and fall from resistance. Our goal is to find a low support point and enter. It can be referred to as buying at the pullback point. The pullback point can be found with a Fibonacci extension of 61.80%. This is a step to find entry level. 1) Find a triangle (Fibonacci Speed Fan Line) that connects the high (resistance) and low (support) points of the stock in progress, where it is continuously expressed as a Slingshot, 2) and create a Fibonacci extension level for the first rising wave from the start point of slingshot pattern.
When the current price goes over 61.80% level , that can be a good entry point, especially if the SMA 100 and 200 curves are gathered together at 61.80%, it is a very good entry point.
As a great help, tradingview provides these Fibonacci speed fan lines and extension levels with ease. So if you use the Fibonacci fan line, the extension level, and the SMA 100/200 curve well, you can find an entry point for the stock market. At least you have to enter at this low point to avoid trading failure, and if you are skilled at entering this low point, with fibonacci6180 technique, your reading skill to chart will be greatly improved.
If you want to do day trading, please set the time frame to 5 minutes or 15 minutes, and you will see many of the low point of rising stocks.
If want to prefer long term range trading, you can set the time frame to 1 hr or 1 day.

SPY/QQQ Plan Your Trade For 6-2 : Post Market UpdateHuge move for metals today. Absolutely incredible.
Hope you GOT SOME.
BTCUSD and the SPY/QQQ stalled somewhat flat today. SPY was up 0.50% - nothing huge.
Going to be interesting to see how things play out in the Asian/European markets tonight.
Buckle up. Could be some very big moves hitting this week.
GET SOME.
#trading #research #investing #tradingalgos #tradingsignals #cycles #fibonacci #elliotwave #modelingsystems #stocks #bitcoin #btcusd #cryptos #spy #gold #nq #investing #trading #spytrading #spymarket #tradingmarket #stockmarket #silver

SPY (S&P 500 ETF) – Inflection at Fib Resistance | Dual-Scenario🗓️ June 2, 2025 | 📈 1H Chart | ⚠️ Risk-Off Signal Building?
🔹 Current Price: $592.98
🔺 Key Resistance: $595.54–$597.36 (1.0–1.236 Fib Extension)
🔻 Gap Support: $565.51
🎯 Bullish Target: $604.05–$604.90 (1.382–1.618 Extension)
🔎 Technical Structure:
Trendline Rejection Zone: SPY is pressing into a multi-tap descending resistance. Any failure to break convincingly could invite strong selling.
Fibonacci Overlap: $595–597 aligns with major Fib extensions—potential exhaustion zone.
Gap Unfilled: The $565.51 gap remains untested and could magnet price in the event of a rejection.
Volatility Funnel Forming: Narrowing structure implies imminent directional move.
🌐 Macro Landscape:
Fed Watch: The June 12 FOMC is the next volatility trigger. Fed Funds Futures are pricing in only a ~10% probability of a cut. Hawkish hold expected.
Earnings Season Winds Down: Lack of new fundamental catalysts could increase technical relevance.
Liquidity: Reverse repo balances are falling, suggesting reduced short-term liquidity—typically bearish for risk assets.
Inflation Watch: Sticky Core PCE remains above 2.75% YoY—Fed unlikely to ease aggressively.
📉 Risk Management:
Short Bias Setup:
Entry: $595–597 rejection
Stop: $598.5–599 (Above 1.236 Fib)
Target: $577 (mid-Fib) → $565.51 (gap close)
R:R ~3:1
Bullish Breakout Plan:
Entry: Confirmed breakout + hold above $598
Stop: $593.50
Target: $604–605
R:R ~2.5:1
Volatility Hedge: Consider using VIX calls or SPX put spreads to hedge directional risk around key Fed dates.
🎲 Probabilities:
Scenario Chance Commentary
Pullback to $565 Gap 65% Strong resistance + weakening breadth + macro headwinds
Breakout to $604 35% Requires bullish macro surprise or liquidity-driven melt-up
🔔 Action Plan:
Fade rallies into resistance unless a high-volume breakout confirms. Use stop discipline and hedge exposure into macro events. Stay nimble.
💬 Thoughts? Are we due for a flush or prepping for a face-ripper?

TLT: Possible bottom very soonHello,
Fed waiting to reduce rates and when they actually do it will impact TLT and may mark the bottom for TLT.
Looking at this fractal, it is following this pattern near perfectly, which indicates the bottom very soon.
Happy trading NASDAQ:TLT

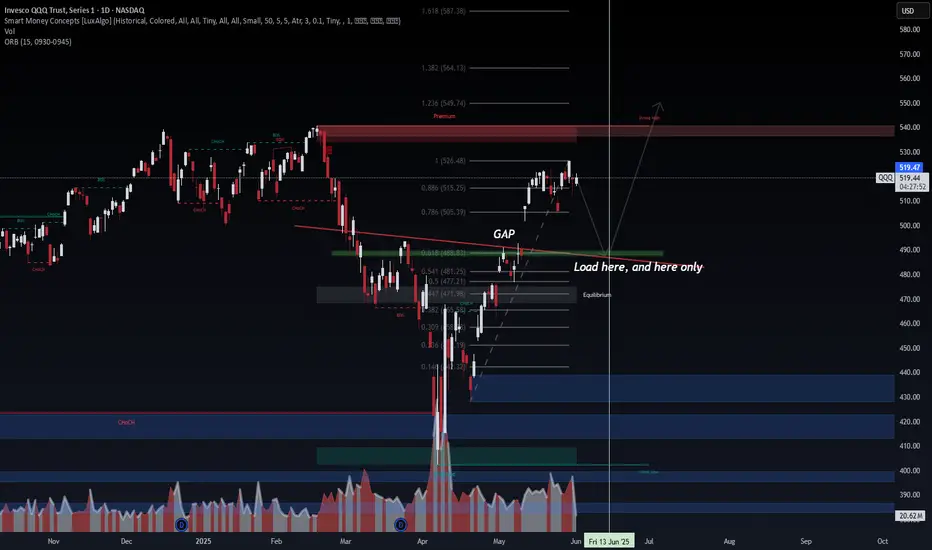
QQQ – Precision Setup Into June 13th, Superstitious? QQQ – Precision Setup Into June 13th (Friday the 13th, But We’re Not Superstitious)
Wavervanir International LLC | June 2, 2025
🧠 Trade Thesis
Despite the superstition surrounding Friday the 13th, our plan is simple and technically sound: wait for price to pull back into a high-probability confluence zone and strike with confidence.
🔍 Technical Breakdown (Daily Chart)
🟥 Premium Zone: $540–550. Price is currently stalling below the 0.886–1.0 Fib zone at $526–$528, showing early signs of distribution.
🟩 Optimal Entry Zone: Around $488, aligning with:
0.618 Fibonacci retracement
Prior CHoCH flip zone
Trendline + Equilibrium support
Volume node clustering
📌 "Load here, and here only" marked for a reason — this is where institutional algorithms are most likely to get involved.
📈 Target: Retest and break of strong high at $549+
📉 Invalidation: Daily close below $477 = re-evaluate structure
🔮 Probability Outlook
Pullback to $488–490 zone: 75%
Bounce to new highs: 70%
Breakdown below equilibrium: 25%
🧠 SMC Context
Recent Break of Structure confirms a bullish bias unless invalidated.
Price above equilibrium but needs a healthier retracement for continuation.
Volume declining into resistance = signs of buyer exhaustion.
📆 Key Date: June 13, 2025 (Friday)
Let’s see if this market follows the script — or throws a plot twist. Either way, we’re ready.
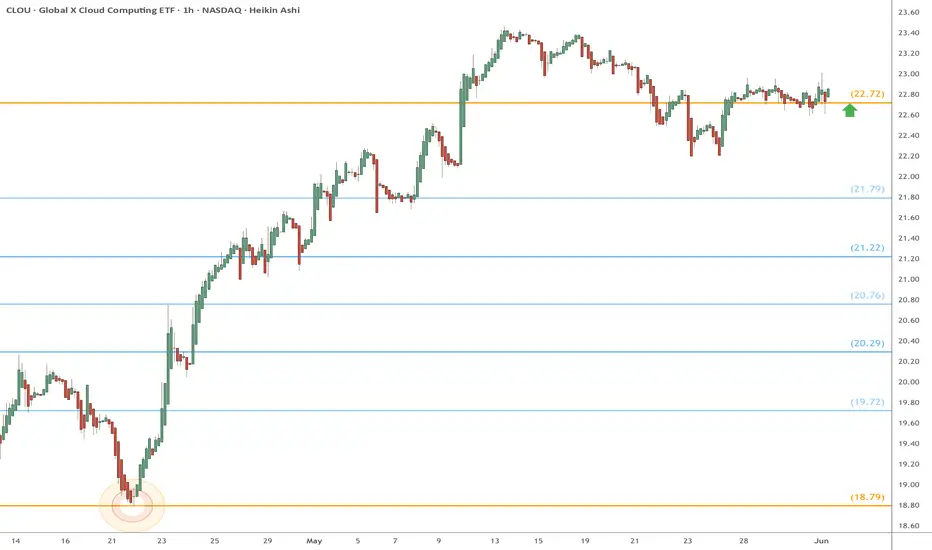
CLOU eyes on $22.72: Golden Genesis fib for high support CLOUCLOU currently orbiting a Golden Genesis fib at $22.72
Its sister golden below at $18.79 was the recent bottom.
Look for a pop from here with tight stop-loss just below.
QQQ – Smart Money Concepts Bearish Setup (1H Chart)Wavervanir International LLC | June 2, 2025
🔍 Chart Context:
The QQQ is currently reacting from a premium supply zone after multiple internal Break of Structure (BoS) and Change of Character (ChoCH) events, showing clear signs of distribution at the top.
🧠 SMC Breakdown
Premium Zone Rejection near $521–523 was met with strong bearish reaction and high sell volume (1.22M).
Multiple BoS and ChoCH events signal institutional unloading.
Weak High formation suggests liquidity sweep followed by directional sell-off.
Current candle structure shows an intent to revisit demand zones below.
📊 Liquidity & Target Zones
First imbalance (FVG) zone at $507–510 is likely to get mitigated.
Second key zone aligns with Equilibrium near $487–490, offering the next logical magnet.
A deeper liquidity pool exists at $465–470, consistent with institutional fill behavior.
🧩 Macro View
Tech-heavy indexes underperforming recently amid shifting Fed expectations.
U.S. 10Y yields climbing and sticky inflation may pressure QQQ's valuation multiples.
NQ/QQQ divergence from breadth suggests fragility at the highs.
📈 Trade Idea
📌 Bearish Bias Active
🎯 Short Entry: $517–519 (on any lower timeframe mitigation or retrace)
🛑 Stop Loss: Above $523 (invalidates supply)
✅ Target 1: $507
✅ Target 2: $490
🚨 Extended Target: $467
Probability:
Bearish Continuation: 70%
Reclaim Premium Zone: 30%
💬 Call to Action:
Monitor volume + liquidity interaction near the mid-level FVG. If downside accelerates with confirmation from NQ divergence, we could see a cascade to equilibrium or even deeper. Risk-manage with volatility in mind.
#QQQ #NASDAQ #SmartMoneyConcepts #VolumeProfile #MarketStructure #TechStocks #LiquidityZones #TradingView #WavervanirAnalysis

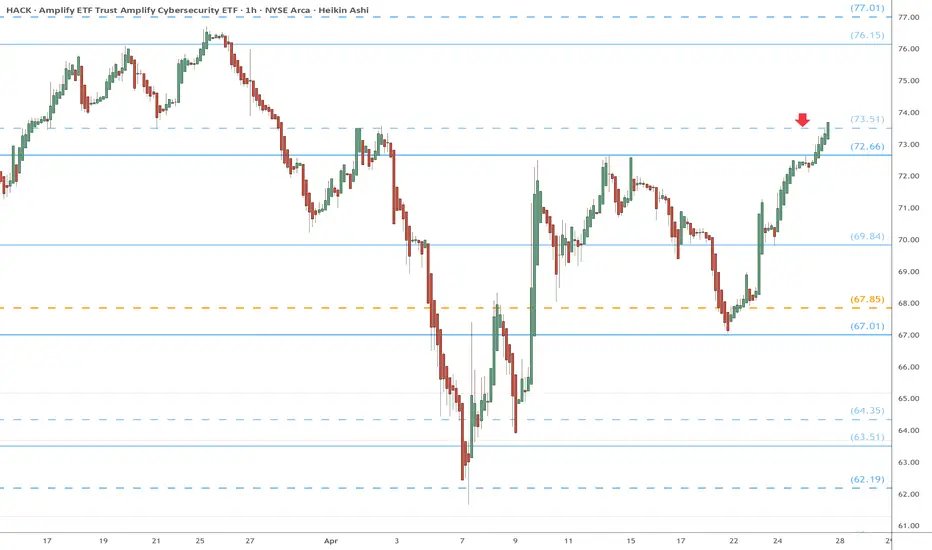
HACK eyes on $73.51: the last barrier to UpTrend resumptionHACK following Genesis and Covid fibs very well.
Just now trying to break the Covid fib at $73.51
But first it may well retest Genesis fib at $72.66
SPY/QQQ Plan Your Trade For 6-2 : Gap Breakaway PatternToday's pattern suggests the SPY may attempt a GAP Breakaway in Trend mode (likely BULLISH). But, the Russia/Ukraine war is overshadowing that potential pattern as big news this morning.
From what I can tell, Russia is mounting a large-scale attack after Ukraine launched a big drone attack targeting Russian aircraft.
No matter how you slide and dice this news, it means this conflict is entering a new phase. A possibly much more destructive phase for all involved.
Gold and Silver are reacting to this news by skyrocketing higher. I believe this upward move in metals could continue for many days/weeks as long as this conflict continues to grow.
BTCUSD is trading slightly downward right now, but not as much as I would have expected based on the news. We'll see how BTCUSD plays out this week and if we get a bigger breakdown over time.
Currently, if you had actively hedged your positions, I believe you will be OK this week as Metals seem to be the big movers right now. The SPY/QQQ should react to this war news, but being somewhat isolated from this conflict economically, we may not see any huge moves in the US markets today.
Overall, hedge your positions to protect against surprise news/risks and try to prepare for the longer-term swings. Volatility will stay elevated over the next few weeks..
So, GET SOME.
#trading #research #investing #tradingalgos #tradingsignals #cycles #fibonacci #elliotwave #modelingsystems #stocks #bitcoin #btcusd #cryptos #spy #gold #nq #investing #trading #spytrading #spymarket #tradingmarket #stockmarket #silver

Weekly $SPY / $SPX Scenarios for June 2–6, 2025🔮 Weekly AMEX:SPY / SP:SPX Scenarios for June 2–6, 2025 🔮
🌍 Market-Moving News 🌍
🏭 U.S. Manufacturing Slump Ahead of June PMI
Markets are bracing for Tuesday’s ISM Manufacturing PMI (June 3), with economists forecasting a reading below 50.0, signaling continued factory contraction amid slowing global demand and lingering tariff uncertainty.
🛢️ OPEC+ Meeting to Determine Output Path
On Thursday, OPEC+ convenes to decide production levels for July. Expectations center on a modest output cut extension to support prices, with Brent crude trading near $65/bbl ahead of the decision.
💻 Tech Stocks Eye Semiconductor Legislation
Investors are monitoring Congress’s debate over the Chips Act extension. Senate committee hearings this week could accelerate funding for U.S. chip manufacturing—an upside catalyst for NASDAQ:NVDA , NASDAQ:AMD , and $MU.
🌐 China’s Caixin PMI Signals Pivot
China’s Caixin Manufacturing PMI (June 6) is expected to edge above 50.0, indicating a stabilization in smaller export-focused factories. A better-than-expected print could lift global risk sentiment.
🏢 Fed Officials Remain Dovish
Fed Governor Michelle Bowman and New York Fed President John Williams speak this week, reiterating that rate hikes are “on pause.” Their remarks should clarify the Fed’s view on inflation cooling and potential rate cuts late 2025.
📊 Key Data Releases 📊
📅 Monday, June 2:
10:00 AM ET: Factory Orders (April)
Tracks dollar volume of new orders for manufactured goods—an early gauge of industrial demand.
📅 Tuesday, June 3:
8:30 AM ET: ISM Manufacturing PMI (May)
Measures U.S. factory-sector health. A reading below 50 indicates contraction.
10:00 AM ET: Construction Spending (April)
Reports monthly change in total construction outlays—key for housing and infrastructure trends.
1:00 PM ET: 10-Year Treasury Note Auction
Benchmark auction that can shift yield curve and influence $SPY/ SP:SPX positioning.
📅 Wednesday, June 4:
10:00 AM ET: Factory Orders (April)
Dollar volume of new orders for manufactured goods. (Repeat for emphasis on industrial slowdown.)
2:00 PM ET: Fed Governor Michelle Bowman Speaks
Comments on inflation and monetary policy outlook.
📅 Thursday, June 5:
8:30 AM ET: JOLTS Job Openings (April)
Tracks number of unfilled positions—a barometer of labor-market tightness.
10:00 AM ET: OPEC+ Press Conference (Post-Meeting)
Details on production quotas—critical for energy-sector flow.
📅 Friday, June 6:
8:30 AM ET: Nonfarm Payrolls (May)
Monthly change in U.S. employment—core for Fed policy outlook.
8:30 AM ET: Unemployment Rate (May)
Percentage of labor force unemployed—key gauge of labor-market health.
8:30 AM ET: Average Hourly Earnings (May)
Tracks wage trends—important for consumer spending and inflation.
10:00 AM ET: China Caixin Manufacturing PMI (May, preliminary)
Measures health of China’s smaller export-oriented factories.
⚠️ Disclaimer:
This information is for educational and informational purposes only and should not be construed as financial advice. Always consult a licensed financial advisor before making investment decisions.
📌 #trading #stockmarket #economy #news #trendtao #charting #technicalanalysis

SPY dowsing roadmap for this weekI've been posting the weekly readings my dowsing has given for SPY's potential price movement the past couple months and it's really interesting.
I go week by week, but am starting to include each day of the week looking forward. I left on the chart the prior notations from those ideas I've posted & you can reference what I had versus what actually occurred.
This week is quite negative. I've had the number around $562-62 coming up for a while, & beyond that, around the $542-48 area as I recall. I don't really get any positive gain over last week's close.
We'll see what happens.

UVXY: Tactical Bet on Volatility SpikeProShares Ultra VIX Short-Term Futures ETF (UVXY) is a 1.5x leveraged exchange-traded fund that aims to replicate the performance of an index of near-term VIX futures on a daily basis. This financial instrument is strategically designed for investors seeking to capitalize on short-term surges in market volatility.
Following a five-week stretch of trading above the $26 mark during April and May, volatility saw a decline. In the week before last, UVXY moved into a tighter range between $20.5 and $23. However, by the market's close on May 24, it once again approached the $26 threshold. As trading commenced today, the price settled near $23.5. This presents a potentially lucrative entry point, influenced by several factors that suggest an uptick in implied volatility in the forthcoming days.
First, persistent uncertainty looms over the U.S. tariff policy landscape. Late last week, President Donald Trump declared the imposition of a 50% tariff on EU goods, initially set to take effect on June 1. This announcement triggered a market correction and heightened volatility. However, over the weekend, Trump postponed the implementation of these tariffs to July 9, offering some respite to market participants. However, trade risks continue to linger. Any forthcoming announcements hold the potential to reignite fears of market volatility.
Second, the US Department of Treasury will conduct auctions for 2-, 5-, and 7-year bonds between May 28-30, amounting to approximately $183 billion. In the wake of the recent downgrade of the U.S. sovereign rating by Moody's, investor scrutiny of demand for these Treasury bonds has heightened considerably. Should the auctions exhibit weak demand, it could prompt a rise in yields, thereby exacerbating instability within the capital markets and leading to a short-term surge in volatility.
Additionally, pension fund rebalancing is anticipated by the month's end. Some stock market participants estimate that potential share sales could reach $19 billion, adding pressure to stock indices due to a lack of offsetting demand.
Finally, on Wednesday, May 28, Nvidia is set to report its quarterly earnings, being the last of the Magnificent Seven group to do so. The company's stock has been trading within a range for a year, but a recent rally has generated high investor expectations. Investors will closely scrutinize the company's outlook, as the absence of indications for accelerating earnings growth could mean insufficient drivers for continued stock growth, particularly amid intensifying competition in the AI sector.
The UVXY instrument exhibits high sensitivity to short-term market fluctuations. During periods of market calm, its value tends to decline gradually due to the adverse structure of the futures curve. Therefore, if one of the described scenarios materializes, it is advisable to take profits once the target is achieved or adjust the position to break even.
The price target is set at $26.5, with a "Buy" recommendation. At the time of analysis, the current price stands at $22.6, indicating a growth potential of 17%. A stop-loss is advised at $19.

Spy Road To $600 🔥 SPY Price Thesis – Breakout or Breakdown Setup
SPY is setting up for a potential breakout above the $595 extension level, with upside to $602–$608. However, $582 remains a key support. A break below $582 could trigger a momentum flush to $567.
Level
🔵 $595.60 – Fib Extension (161.8%) from the March → April swing High-probability breakout trigger
🟢 $602.40 – $608.20 – Fib 200% and exhaustion zone from the same swing Final extension if bullish momentum sustains
🟡 $582.00 – Institutional VWAP reaccumulation zone Strong demand/support
🔴 $567.40 – Prior weekly pivot low + anchored VWAP bounce level Breakdown target if $582 fails
Trend Signal: Bullish bias confirmed — Higher Highs + EMA Cloud still pointing up
Momentum: MACD Histogram turning back up, crossover brewing
Volume: Above average on green days; no true distribution yet
Supertrend Zone: Still green on 4H and 1D
Custom Signal Confluence Score: > 75% (Strong Buy Zone aligning above $588)
🔁 Fibonacci Analysis
Measured from April swing low (~$505) to May high (~$573):
🔹 161.8% = $595.60
🔹 200% = $602.40
🔹 261.8% = $608.20 (max extension target)
📉 On Breakdown:
From $573 high to $558 retracement low:
0.618 retrace = $582.00 ← Current support zone
Full retrace & bear trap zone = $567.40
Smart Money Strategy:
Above $595: Long breakout entries (Calls, zero DTE)
Below $582: Hedge with Puts or inverse ETF
Key Catalyst Triggers: Jobs data, CPI, or Fed commentary could force the move
As Always Safe Trades and JoeWtrades

Market ReviewGoing into next week for me, I will be playing defensive now. The easy money has been made and now time to look to lock/take profits. Keep an eye on IWM for an inverted Head-and-Shoulder pattern soon. Cheers!

579 gap will be filled.Happens all the time. Chart shows an incredibly large gap. if you lower the deviation on your gap indicator a small gap can appear below this very large gap. i have seen on numerous... NUMEROUS occasions when this gap gets filled and then has a nice rebound(not necessarily sustained). I don't know if it will happen tomorrow, but if there starts to be a sustained selloff in the days ahead i will feel confident that this is the target. 579 is the price. again, it could happen on monday or it could happen next monday. i have no idea what the market is going to do from day to day, but keep this level in mind.

$spyyieahhh
Back after getting crushed last 2 months, but hey at least we are having fun 'they say'.
Interesting set of patterns. long term uptrend. Looking at a dip to 563 over next month hopefully.
Bunch of confluences there:
1. High volume at 560 (there's a volume gap right below 585 which would make this a quick move down.
2. Mid point of the long term parallel channel.
3. 61% fib of entire move down.
You would expect next long term target to be the upper test of the channel, 620s. Let's see how this move down, if we have any goes. Yieahhhh

SPY Trapped in Gamma – Big Move Loading or Just Dealer Chop?
📊 SPY GEX Daily (Options Sentiment Breakdown)
SPY closed at $589.39, and we’re now seeing tight compression between call resistance at 592–595 and heavy put walls down at 586 and 580. Gamma is stacked on both sides — a dealer tug-of-war. Unless we break cleanly above or below this zone, expect whipsaw chop.
GEX Breakdown:
🟩 Call wall at 595, with strong dealer hedging from 592 up to 600.
🟥 Massive negative GEX starting at 586 → 580 → 575, all with dense put walls (–79.88% at PUT Support).
🔻 IVR is 18 and falling – nobody’s paying up for protection yet, but things could move fast once they do.
💡 Options Playbook (Based on GEX):
Neutral-to-Bearish: Fade pops near 592–595, use 595c/600c credit spread or play 585p/575p vertical if 586 breaks.
Bullish Flip: If we break and hold over 595, gamma flips positive fast → play Jul 19 600c or 595/605 spread.
This is a gamma box — price likely stuck 586–595 unless volume shifts dealer hedging or macro breaks out.
🕵️♂️ 1H Price Structure (Swing & Intraday Planning)
SPY 1H still showing weak structure. Multiple CHoCHs and BOSs bouncing around the same zone. Price got rejected from the purple supply at 592, and is now hovering around 589–590, still trapped under a descending trendline.
What stands out:
📉 Structure = lower highs + broken BOS → short-term bearish.
📦 Supply pressure between 590.5–593.9, demand sits down at 573–576.
💣 Bearish readings across BBP, MACD, Stoch — and market breadth thinning.
📈 Swing Bias:
Short under 590–592 → target 586 first, then 580 if momentum kicks in.
Bullish case only resumes on clean break above 595.
📊 Intraday Plan:
Fade pop to 590.5–592 for scalp short (look for lower highs).
Bounce off 586 is playable for scalp long — but keep stops tight.
Until SPY breaks out of this gamma trap, you want to scalp or spread trade with discipline. No need to swing for home runs here.
🧠 Final Thoughts
SPY is pinned between high call resistance and aggressive put support. The GEX box says: "Be patient or get chopped." We need either macro news or volume spike to break the hedging stalemate. IV is low, so positioning ahead of a breakout (via spreads or small directional bets) could pay off — just manage size tightly.
⚠️ Disclaimer:
This is educational commentary only. Always manage your own risk, and never trade based on someone else’s analysis alone.

SPY Weekly Options Outlook — June 1, 2025📉 SPY Weekly Options Outlook — June 1, 2025
🚨 AI Model Consensus: Moderately Bearish into June 6 Expiry
🧠 AI Model Breakdown
🔹 Grok (xAI)
Bias: Moderately Bearish
Technical: Price below 10-EMA, RSI cooling, MACD divergence.
Trade: Buy $589P @ $4.72 → PT +50%, SL if SPY > $591
🔹 Claude (Anthropic)
Bias: Moderately Bearish
Technical: Short-term cooling, daily trend still intact.
Trade: Buy $573P @ $0.94 → PT 100%, SL 50%, exit by Wed
🔹 Gemini (Google)
Bias: Neutral
Technical: M5 bearish, daily bullish = mixed.
Trade: No trade today due to inconclusive bias
🔹 Llama (Meta)
Bias: Slightly Bullish
Technical: M5 bullish EMAs, daily MACD bearish
Trade: Buy $590C @ $5.20 → PT +20%, SL −50%
🔹 DeepSeek
Bias: Moderately Bearish
Technical: Breakdown below support, MACD/RSI bearish
Trade: Buy $588P @ $4.27 → PT near $585, SL at $590.50
✅ Consensus Takeaways
4 of 5 models favor bearish or moderately bearish direction
Max Pain at $585 = common gravitational level
Momentum showing weakness, especially intraday
Only Llama sees upside bias; Gemini stays out due to signal conflict
🎯 Recommended Trade Setup
💡 Strategy: Bearish Naked Weekly Put
🔘 Ticker: SPY
📉 Direction: PUT
🎯 Strike: $588
💵 Entry: $4.32 (ask)
🎯 Profit Target: $6.00 (+39%)
🛑 Stop Loss: $2.16 (−50%)
📏 Size: 1 contract
📅 Expiry: 2025-06-06
⏰ Entry Timing: Market Open
📈 Confidence: 70%
⚠️ Key Risks to Monitor
⚖️ Daily uptrend still intact — bounce possible at support
📉 Low VIX = limited volatility expansion (slower premium growth)
🔺 Watch for quick reversals or news spikes above $590 that can hit stop-loss
⌛ Theta ramps midweek — trade must move early
📊 TRADE DETAILS (JSON)
json
Copy
Edit
{
"instrument": "SPY",
"direction": "put",
"strike": 588.0,
"expiry": "2025-06-06",
"confidence": 0.70,
"profit_target": 6.00,
"stop_loss": 2.16,
"size": 1,
"entry_price": 4.32,
"entry_timing": "open",
"signal_publish_time": "2025-06-02 09:30:00 UTC-04:00"
}

SPY: New Month of June! :O Hey everyone,
Entering a new month, how exciting.
Hope you all had a great weekend and have a great week ahead!
As always, safe trades and take care!

Bullish on SPY!What I have understand is that market negatively reacts to Tariff implementation. This is the market sentiment.
Since Tariffs have been paused, cut off, or delayed to another time. Most courts are suspending the Trump Tariff.
Market has been behaving positively, It has also broken the previous small resistance at the price $575. And has also retracement. If you put moving average of 10, you can see it has retested below level but closes above the MA which is a good signal.
I believe SPY will touch $607 within 2 weeks from now, and hopefully a fundamental news will break the $610 level.
And it is common sense if SPY moves rapidly upwards, almost all of the SP500 companies will go up ( not all).
And I think buying stocks that are already at the high resistance level is good if what I think will happen.
