Stock Market Forecast | TSLA NVDA AAPL AMZN META MSFTStock Market Forecast | CME_MINI:NQ1! CME_MINI:ES1! SPY QQQ
Mag 7 Forecast | NASDAQ:TSLA NASDAQ:NVDA AAPL AMZN META MSFT GOOGL
ETF market

SPY to touch 600 soon Looks like it's in a large rising wedge, which should resolve upwards imho
Yesterday was another buy the dip moment, as bulls defended a break below 583 and rallied all the way up to the 591 level.
A break above 600 which lead to explosive price action which may or may not happen, however 600 is a strong psychological resistance. We will see how this pattern develops...

BREAKING $SPY Ultra Rare Holy GrailBREAKING AMEX:SPY Ultra Rare Holy Grail
Inside week trap is here a massive breakout is coming!
The key is to watch the futures open all will be alerted here on TV no charge
Low risk high reward setups only ill share it all going for 6 figures
All I ask is drop a 👍

SPY (S&P 500 ETF) – Fibonacci Reversal + Bullish Continuation SeThis chart highlights a potential retracement zone before a major continuation leg to the upside, based on Fibonacci levels and price structure.
📊 Technical Breakdown
Current Price: $589.39
Recent High: $595.54 (Fibonacci 1.0)
Key Fibonacci Levels:
0.618 → $562.28 (First retracement target)
0.5 → $555.57
0.382 → $547.38
Critical Support: $552.15 (confluence with historical demand & fib zone)
Projected Target (1.382 Fib Extension): $629.02
🧠 Probabilistic Interpretation
🔻 Short-term pullback toward $552.15 = 60% probability based on multiple rejections from 0.886/1.0 Fib zones.
🔼 Continuation to $629.02 = 70% probability if price finds support at golden ratio (0.618) or 0.5 zone.
🧠 Structure favors smart money re-accumulation after engineered liquidity grab.
🌐 Macro Context (as of May 31, 2025)
Fed Watch: Market pricing in 70% chance of no rate cut in June. July data will be crucial.
VIX: Suppressed, but starting to rise—indicative of market hedging short-term volatility.
Earnings season: Mixed signals—AI sector outperforms while cyclicals lag.
🚨 Trade Plan for Professionals
Watch for price action near $555–552.
Enter long upon bullish engulfing or SMC confirmation at demand zone.
First TP: $595.50
Final TP: $628.80–$629.02
SL: Below $541.72 (Fib 0.382)
🧠 Final Note
This chart reflects a classic Fibonacci retracement & extension structure that institutional traders often monitor. Aligns with DSS and WaverVanir’s discretionary outlook.
#SPY #SMP500 #FibLevels #SmartMoney #LiquiditySweep #WaverVanir #TechnicalAnalysis #FibonacciTrading #TradingView

SpyGoing over
Spy
Dow jones
NYA
I'll keep this mostly cylicals and broader market.. I've written up a qqq post where I cover most tech indexes..
Let's start with NYSE or TVC:NYA
This covers 3000 stocks.. you ever read about weak breadth in the market? Well when ever this is Lagging behind nasdaq and the market is being dragged along by 6 tech stocks then that's what it means.
Ok so last week when the Spy dumped from 595 to 575 in 2 days, a big part of that was NYA ran into a brick wall here at 20,000 as you can see. Add to that price had formed a rising wedge from the melt up from April lows..
So price rejected at 20,000 on NYA but bounced at its 200sma similar to Spy at 575 which let's you know how connected the 2 are
So now we go into this week here literally 1% away from that same resistance.. Nothing moves NYA and IWM more than the monthly jobs, this is because Job numbers reflect economic strength and a weaker economy will impact Cylicals and small caps the most ..
I don't think we break above that trendline resistance, too much uncertainty around Tariffs, Also here's the weekly RSI on NYA dating back 2yrs
At resistance and divergent... I think we break below the 200sma this week Either with Wed ADP or Friday nonfarm payrolls..
Usually to get below the 200sma it takes a GAP down so that's why I think the action takes place pre market on some data.
TVC:DJI
Dow jones
I'm conflicted a little here.
Price is stuck below trendline resistance and 200ma
But price is also showing a possible bullish H&S inside a Pennant.
Dow jones would only be bullish above 43,000..
As you can see there is not anymore room fawk around.. price will break in either direction come next week..
I'm leaning to the bearish side here but things only get seriously bearish back below 40,000 because that would put it back inside that April box
2 of the sectors that really moves the dow is Financials and Health
Look at this XLF weekly chart
Price is distributing at a 15yr resistance
Zoomed in
Looks like a 2022 repeat about to happen as early as this fall
The position XLF is in makes me doubt Financials will lend a boosting hand here .
XLV - health care on the other hand looks really bullish short term
Daily channel shows a 7% upside to channel top
Daily rsi showing bullish Divergence
So health could offset some of the dow losses but not enough if tech and Financials rollover.
Lastly my number one reason I'm bearish on the dow is DJT or dow jones transportation
Weekly candle stuck below 15,000, trendline resistance , 20 and 200ma.
Seasonality June and July is bullish for DJT because of the traveling but if they can't break above this area in the middle of its best seasonality then nothing is safe
Lastly Spy
ALWAYS KNOW WHERE YOUR MOVING AVERAGES ARE BEFORE YOU TAKE A TRADE!
Me personally I only use 20,50,200.. EMA and SMA.
I say this because the area of spy 572-577 has a powering of moving averages on both weekly and daily time frames
If spy breaks below 570 then we are headed straight for this box.
547-550
Below that and it's death for the bulls.. if it bounces there then we'll see what happens
Weekly RSI same as NYA .. at resistance
So here's a 4 hr chart..
As you can see, rising wedge..
But pay attention to the yellow trendline resistance. That range is 590-584..
A open below 582 and it's a short to 575..
A open above 593 and it's one last long to 600 before the big short
585-592 is choppy and I wouldn't trade it
Like I said earlier, you normally never see price intra day slide below the daily 200sma .. so if they are going to break below 575 this week ( I believe) then they will do it pre market.
I don't think this week will be all doom and gloom. Why? Because of NQ 4hr moneyflow.. it's gotten too oversold so they are likely to have a tech pop this week probably Tues or wed which I think will be your opportunity to position short

iBIT - Weekly Volatility SnapshotGood Afternoon,
Here is my weekly perspective for NASDAQ:IBIT ---
IV (48.31%) entering this week is holding in the 24th percent range for the year and has been climbing weekly from putting in new lows at the beginning of the year. We essentially have been seeing rising IV with rising price action, the best of the best. Premium increases from price action climbing and IV rising affects Vega positively increasing premium too.
Bi-weekly trends (27.64%) show a cooling off entering the week and contraction under IV, but it might not last long as there could be major macro news in the crypto world at any moment. This could be a big week on continued regression towards quarterly means (51.52%).
If this happens the range will continue to expand in my option and hold a +3.21% value per move on premium over stated IV, but weekly trends would be expanding 23.89% -- A huge move.
As always --
For those interested in volatility analysis and the application of weighted HV ranges to IV, I encourage you to BOOST and share this post, leave a comment, or follow me to join me on this journey.

BITx - Weekly Volatility SnapshotGood Afternoon,
Here is my weekly perspective for CBOE:BITX
IV (96.75%) entering this week is holding in the 18th percent range for the year and has been climbing weekly from putting in new lows at the beginning of the year. We essentially have been seeing rising IV with rising price action, the best of the best. Premium increases from price action climbing and IV rising affects Vega positively increasing premium too.
Bi-weekly trends (56.07%) show a cooling off entering the week and contraction under IV, but it might not last long as there could be major macro news in the crypto world at any moment. This could be a big week on continued regression towards quarterly means (104.06%).
If this happens the range will continue to expand in my option and hold a +7.31% value per move on premium over stated IV, but weekly trends would be expanding 47.99% -- A huge move.
As always --
For those interested in volatility analysis and the application of weighted HV ranges to IV, I encourage you to BOOST and share this post, leave a comment, or follow me to join me on this journey.

The Next Deepseek Moment?Technical Setup:
Golden Cross + Value Area Breakout
Golden Cross Confirmed: The 50-day MA just crossed above the 200-day MA, a strong bullish signal. Last occurrence (2020-2021): KURE surged +120% before the Death Cross reversal.
Current structure: After a brutal 5-wave decline, we’ve:
-Bounced off Value Area Low (key support).
-Reclaimed the Point of Control (POC, fair price balance).
Next target: Value Area High (~120% upside from here).
Fundamentals ?
Why Chinese Biotech is the Next AI style growth driver? While AI dominates headlines, China’s biotech sector is quietly exploding. Government Backing from Beijing, they are pouring billions into biopharma independence, reducing reliance on Western drugs.
Innovation Surge: Companies like BeiGene, Innovent, and CanSino are advancing mRNA, CAR-T, and PD-1 inhibitors—China’s answer to Moderna & Regeneron.
Global Outsourcing Boom: WuXi AppTec & WuXi Biologics dominate global drug R&D outsourcing (60%+ revenue from US/EU).
Valuations are Cheap: After a 3-year bear market, many stocks trade at 2020 pre-bubble levels despite stronger pipelines.
Healthcare Demand: Aging population + rising middle class = exploding drug demand in China.
Risks to Watch: US-China Tensions - WuXi AppTec faces US scrutiny (BIO lobbying).
Liquidity Risk: KURE is a small ETF (~$50M AUM)—sharp moves possible.
If the Golden Cross holds and China’s biotech rally accelerates, KURE could retest 2021 highs (+100-120%). The sector is under owned, undervalued, and at an inflection point—just like AI was in early 2023. This could cause the next Deepseek moment.
Not financial advice.

ETF FMCGIETFFMCGIETF etf view
Daily Time Frame
It is under Darvax box
If it cross downside script goes down


UVXY Stock Chart Fibonacci Analysis 053025Trading Idea
1) Find a FIBO slingshot
2) Check FIBO 61.80% level
3) Entry Point > 22.5/61.80%
Chart time frame:A
A) 15 min(1W-3M)
B) 1 hr(3M-6M)
C) 4 hr(6M-1year)
D) 1 day(1-3years)
Stock progress: A
A) Keep rising over 61.80% resistance
B) 61.80% resistance
C) 61.80% support
D) Hit the bottom
E) Hit the top
Stocks rise as they rise from support and fall from resistance. Our goal is to find a low support point and enter. It can be referred to as buying at the pullback point. The pullback point can be found with a Fibonacci extension of 61.80%. This is a step to find entry level. 1) Find a triangle (Fibonacci Speed Fan Line) that connects the high (resistance) and low (support) points of the stock in progress, where it is continuously expressed as a Slingshot, 2) and create a Fibonacci extension level for the first rising wave from the start point of slingshot pattern.
When the current price goes over 61.80% level , that can be a good entry point, especially if the SMA 100 and 200 curves are gathered together at 61.80%, it is a very good entry point.
As a great help, tradingview provides these Fibonacci speed fan lines and extension levels with ease. So if you use the Fibonacci fan line, the extension level, and the SMA 100/200 curve well, you can find an entry point for the stock market. At least you have to enter at this low point to avoid trading failure, and if you are skilled at entering this low point, with fibonacci6180 technique, your reading skill to chart will be greatly improved.
If you want to do day trading, please set the time frame to 5 minutes or 15 minutes, and you will see many of the low point of rising stocks.
If want to prefer long term range trading, you can set the time frame to 1 hr or 1 day.

$XLV - Long Calls (Sept)I picked up calls for September based on price action and key control levels. The stock has been in a downtrend and recently tested significant support levels on both a monthly and weekly basis. Considering the slow price movement and that the recent decline was driven by fundamental factors, I'm targeting a rebound back to the monthly high from May.

$SPY demand zone: Chinese+Canada+Mexican tariffsDaily SPY demand zone is $581-$586, lots of buys within that range. We´d need a major and negative catalyst to break lower than that, especially with the daily 200ma @$577.
Worsening China tariff and regressive trade news next week to push SPY to it´s $577 200 MA or at least some positive news from the Canadian and Mexican pause ending June 9th to at least continue to hold us at the higher end of the range ?

GAP Fill on the table. We going lower according to the DSSDSS predicted the right moment in time. Time series analysis combined with my technical insight could be my edge that's working right now.
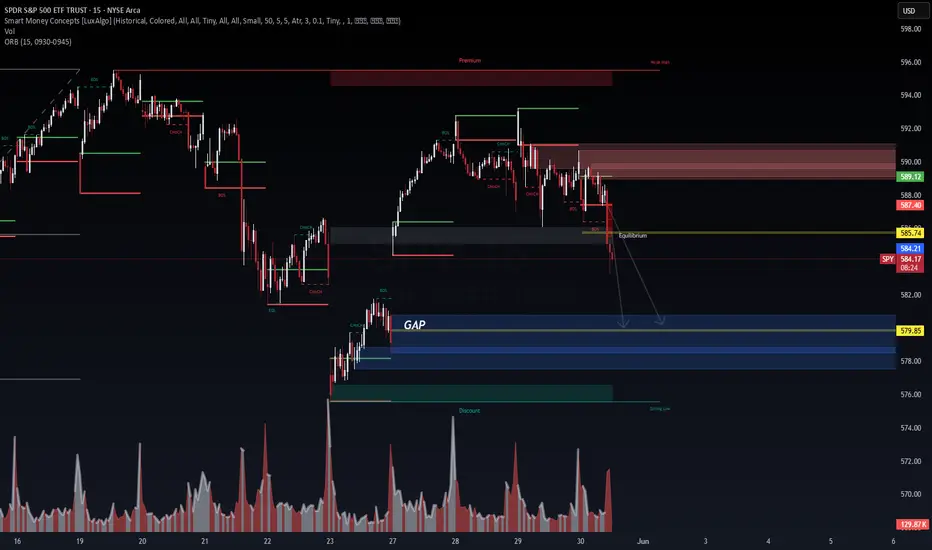
SPY Breakdown Watch – Smart Money Concepts (1H Chart)🔎 Chart: SPY | TradingView 1H
At Wavervanir International LLC, our discretionary analysis on SPY (S&P 500 ETF) using SMC + ORB logic is signaling potential downside.
🔍 Market Structure:
CHoCH (Change of Character) confirmed after BOS (Break of Structure), suggesting buyer exhaustion.
Premium zone rejection with multiple failed attempts to reclaim the weak high.
Liquidity has shifted toward discount zones, aligning with volume imbalance and OB zones below.
🎯 Target Zones:
Immediate liquidity pool: 579.85
Demand block confluence: 575–565 zone
Deep mitigation OB: 560–557.50 zone
📊 Macro Context:
Bond volatility rising (MOVE index)
Fed holding rates steady, inflation stickiness remains
Liquidity tightening into quarter-end
🧠 Strategic View:
SPY looks poised to fill inefficiencies into the 575–565 range unless macro tailwinds emerge. Volume supports this as market seeks equilibrium post-premium rejection.

UVIX looking real sweet! VIX has a very unique quality, which is that it bottoms-out! The VIX is in a very nice place right now. Already did 3 trades over the last week ranging from 4 to +10%. I can't think of a better ETF to trade in times of uncertainty and risk. I'll be providing alerts for those who are interested in upgrading to steak vs. rice and beans FOMO crypto bros!
Best of luck and always do your own due diligence! Nothing makes me more happy than to see average Joes and Janes beat the S&P and overpriced FAs.

SPY: Maybe today we could see this. Just a random thought and analysis. Would be fun if we see this waterfall today.

SUPER CYCLE TOP SOON IGV WAVE 5 The chart posted is by far the strongest chart within the market and has a clean wave structure from an Elliot Wave view . I have now taken a position for the last wave and will exit and go 100 % short all markets once the 5th wave has reached the targets min 106.7 to ideal target is 111 zone this should be seen based on my work in spiral cycle top is due 2.5 TD days from today with the alt on June 6/9 best of trades WAVETIMER

Qqq... almost timeIn the coming the tech sector will rollover and correct 10-12% in the month of june.
This will represent a 50% retrace from April lows
Weekly RSI is tagging Divergence resistance
www.tradingview.com
This space has only room enough to chop around for another few days so I'm thinking some news either comes out over the weekend or next weeks eco data comes out and causes a flush and break of this wedge
The immediate move would be to the 200ma or 495, from there I expect a bounce back to 505-508 before the next leg down
A break and close above 530 would negate this short..
I will go over some of the tech Sectors this weekend..
Don't swing any direction until this wedge is decided, will be choppy and annoying.. Theta decay heavy for 0dte.
Just have patience and fade the pops.. all the signs are there. I've notice a rotation into heath ,utilities and defensive all week despite qqq making new highs
If we happen to close below or near 515 that would leave us with a weekly reversal candle

2007 Top /2025 day 38td t-minus 2.5 days Major TOP The chart in focus is the 2007 chart we are now day 38 in the pattern and in 2007 we took 40td to make a new high And I have posted my models .I see the next rally to reach anywhere from 6035/on the low end to 6177 on the high end focus 6147 where Ax 1.618 = wave C or 3 Best of trades WAVETIMER

Opening (IRA): SPY September 19th 500 Short Put... for a 5.02 credit.
Comments: Adding at intervals at strikes better than what I currently have on, targeting the <16 delta strike paying around 1% of the strike price in credit. Will look to manage positions as I come to them.

$SPY // May 30 2025 // Analysis & Targets for Day TradersAMEX:SPY // May 30 2025 // Analysis & Targets for Day Traders
