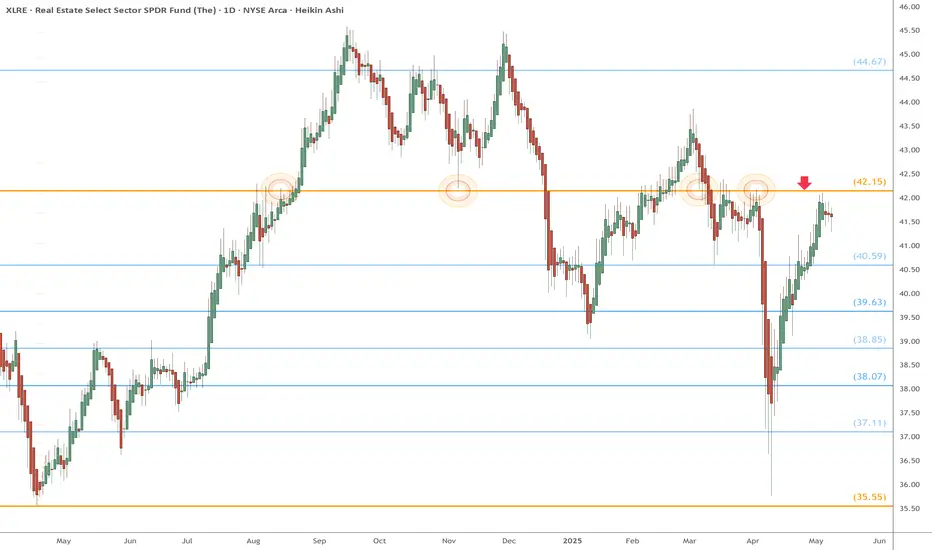
XLRE watch $42.15: proven Golden Genesis fib to determine TrendXLRE (Real Estate) has bounced back strong.
BUT just hit a Golden Genesis fib at $42.15
Look for a likely dip to one of the fibs below.
ETF market
$SPY May 27, 2025AMEX:SPY May 27, 2025
15 Minutes.
Below 577 target is 571-572 levels.
Above 582 target is 586-587 levels being 200 averages.
Since value below 200 averages am biased towards lower levels.
582 is 200 in 5 minutes which needs to be taken out first for 586 587 level.

Weekly $SPY / $SPX Scenarios for May 27–30, 2025🔮 Weekly AMEX:SPY / SP:SPX Scenarios for May 27–30, 2025 🔮
🌍 Market-Moving News 🌍
🇺🇸 Tax-and-Debt Debate Rattles Markets
Washington’s push to advance a massive tax-cut and spending bill—projected to add $3.8 trillion to an already $36.2 trillion debt—has investors questioning U.S. fiscal discipline. The dollar weakened further, while Treasury yields remain elevated on credit-rating concerns and deficit fears
⚖️ Trump Delays EU Tariffs, Lifts Sentiment
President Trump pushed back 50% tariffs on EU goods from June 1 to July 9 after talks with EU leaders. U.S. futures jumped, and global markets breathed easier despite lingering trade-policy uncertainty
📈 Bond Yields Spike, Then Stabilize
Both 20- and 30-year Treasury yields jumped above 5.1% before easing slightly as auction demand picked up. Fed officials signaled they expect to hold rates steady for the next two meetings, putting a floor under yields
📊 Key Data Releases 📊
📅 Tuesday, May 28:
9:00 AM ET: Case-Shiller Home Price Index
10:00 AM ET: Consumer Confidence (May)
📅 Wednesday, May 29:
8:30 AM ET: Advance Q1 GDP
8:30 AM ET: Personal Income & Spending (April)
📅 Thursday, May 30:
8:30 AM ET: PCE Price Index (April)
10:00 AM ET: Pending Home Sales (April)
⚠️ Disclaimer:
This information is for educational and informational purposes only and should not be construed as financial advice. Always consult a licensed financial advisor before making investment decisions.
📌 #trading #stockmarket #economy #news #trendtao #charting #technicalanalysis

$SPY Positioning for New Highs After a Pullback.. $650-$700??SPY remains in a bullish trend until proven otherwise, but I’m anticipating a short-term pullback before the next leg higher. My current outlook sees downside potential toward the $555 level, where I expect a potential reversal. From there, I believe SPY is on track to retest and eventually break through all-time highs at $613. Until I see confirmation at $555 or signs of structural breakdown, I’m treating this pullback as a buying opportunity—not a reversal.

Updated thoughtsThe chart speaks for itself. It’s going to go up then drop. Please lmk if yall have any other thoughts/ideas. Good luck traders!

SPY - Ground Up Multi-Time Frame Analysis!Lots of interesting algorithms at play here between the LTF and HTF algorithms. We need to be very cautious before entering long-term positions.
But, there will be great opportunities to take LTF trades once we start seeing our green tapered buying proving itself and/or a respect and proof of a selling channel like orange or red
Happy Trading :)

Top 10 YieldMax ETFS- For High-Yield Passive Income Portfolio📈 Building a High-Yield Passive Income Portfolio with YieldMax ETFs 💰
YieldMax ETFs are redefining passive income by offering massive monthly distributions through options on high-volatility names like TSLA, MSTR, NVDA, and more.
Below is a high-income ETF portfolio allocation tailored for strong yield, sector diversification, and long-term compounding potential.
🧺 Top YieldMax ETF Allocation
ETF Exposure Suggested Allocation Key Highlights
TSLY Tesla 20% "~108% yield, 29.7% price gain"
BTF Bitcoin 15% "29.15% return, BTC-linked"
CONY Coinbase 15% "High volatility, 21.5% return"
PLTY Palantir 15% AI/data growth with 18.15% gain
NVDY Nvidia 10% "Semis + AI, strong growth"
MSTY MicroStrategy 10% "Crypto proxy, massive yield"
TSMY TSMC 10% Stable Asia chip exposure
YMAX Diversified 5% Exposure to all YieldMax names
Or simply add 10% in each of the top 10 and balance quarterly.
🔁 Reinvest vs. Withdraw? What Happens to $10,000?
✅ Scenario 1: Reinvest Dividends (Compounded ~95%/year)
Time Horizon Estimated Value
1 Year ~$19,500
5 Years ~$369,000
10 Years ~$13.6 Million
❌ Scenario 2: Withdraw Dividends (No Compounding, Flat 70%/year Yield)
Time Horizon Estimated Value
1 Year ~$17,000
5 Years ~$52,000
10 Years ~$105,000
📌 The Takeaway: High yield is powerful. But reinvesting that income unleashes true exponential growth. Passive income becomes wealth acceleration.
“You don’t need more capital. You need more time — and compounding on your side.”
⚠️ Disclaimer
This is an educational illustration. Yields and ETF performance can vary significantly year to year. YieldMax ETFs use options strategies that cap upside and introduce volatility. Do your due diligence

No refinance for u! $TLTContinuation of bearish behavior means you stuck with your 6-7% mortgage rate for awhile. But don't be sad maybe that will be considered a good rate in the future. TLT still looking or support check back around $77 to see what happens next!

QQQ To Be DeterminedUsing the Potterbox strategy, we can see that we successfully bounced off the 4HR cost basis, or median at about $505.60 and closed above the top of the box at about $507.77.
I believe that to continue to the upside, we'll have to first secure the floor above at $511.50 with a 4 hour candle close. At that point, we'll have a chance to punchback with a candle close above cost basis at about $513.84. With that, we can look to head to the upside and use $522 as a price target.
On the other hand, if we drop below the top of the box that we closed above, we could retest cost basis at about $505.60 and if we get a candle close at that end, then we can look to continue downwards towards a $497 price target.

Bond Market Crisis - Opportunity?Pay close attention to the bond market, particular to the 20 Year Treasury yield which is creeping back up. This is really bad news for the markets, yields could spike higher which could send the market tumbling. This cascade effect could provide an optimal entry into TLT - which is an inverse play on interest rates.
There is currently no reason for the Fed reserve to reduce interest rates. Inflation is creeping back up and the cost implications of tariffs are yet to truly felt in the inflation readings. Meanwhile, the US has lost its perfect credit rating and the debt burden continues to grow. The Fed will not reduce rates if inflation shows no sign of abating. Note that in the UK inflation is back up and I expect this to also be the case in the US.
My plan is to watch this play out and look for opportunity in TLT. I don’t want to get caught up bag holding stocks if there is a major bond crisis. As far as the chart is concerned, I expect a double bottom pattern and bullish confirmation with a break of the neckline.
None of this is financial advice, do what’s best for you.

SPY, QQQ, IBIT Last week of MayHey everyone,
Here is my analysis on SPY, QQQ, IBIT for next week.
Enjoy your long weekend if you are in the U.S.
If you are anywhere else like me, enjoy Monday back to work haha.
Safe trades everyone!

SPY at a CrossroadsUsing the Potterbox strategy on the 4 hour time frame I can see that we are at a huge level of support that is holding at $578, which I think will be crucial in deciding whether we break down or make an attempt to try and head to the upside.
$571 and then $568.50 are downside targets, if we end up breaking down below the $578 support.
Above us, there is a box where price consolidated that we retested the bottom of back on Friday. If we are able to hold support at $578, we are likely to retest and try and secure the floor at $581. With a $582.75 break, which is cost basis, or the median of the box, we are likely to head to the bottom of the next box above us at $588.

05-25-25 Risk Containment & Trading Strategy ExamplesSkilled Traders have learned to manage risk levels using techniques that allow them to preserve capital and move their assets towards future successful traders.
Some beginner traders get stuck trying to swing for the fences.
In this video, I try to share a common Fibonacci price/strategy technique where traders can attempt to limit risks while learning to identify efficient successful trade triggers.
Remember, taking a trade is the easy part. Protecting and growing your capital is much more difficult.
Please use the techniques in this video to learn how to protect and manage your capital.
Get some.
Happy Memorial Day.
#trading #research #investing #tradingalgos #tradingsignals #cycles #fibonacci #elliotwave #modelingsystems #stocks #bitcoin #btcusd #cryptos #spy #gold #nq #investing #trading #spytrading #spymarket #tradingmarket #stockmarket #silver

QQQ Trading Opportunity! BUY!
My dear friends,
QQQ looks like it will make a good move, and here are the details:
The market is trading on 509.27 pivot level.
Bias - Bullish
Technical Indicators: Supper Trend generates a clear long signal while Pivot Point HL is currently determining the overall Bullish trend of the market.
Goal - 514.96
About Used Indicators:
Pivot points are a great way to identify areas of support and resistance, but they work best when combined with other kinds of technical analysis
Disclosure: I am part of Trade Nation's Influencer program and receive a monthly fee for using their TradingView charts in my analysis.
———————————
WISH YOU ALL LUCK

Market Update - 5/25/2025• Clear leading sectors are batteries, nuclear and alternative energy, material and metal names especially gold
• Breadth is declining, XLU, XLP outperforming, stocks lower, IWM rejected from the 100dma.
• These are all clear signals to me that we are in a bad environment. Last week I was 109% invested, but now down to only 10%, and only risking 0.3% on my trades. I'm fully in defensive mode. I'm only focusing on the best of the best setups in the above mentioned leading industries. I'm expecting weakness ahead

Technical Signals Point to Potential Downside: Key Gaps and IndiThe MACD on the daily chart is nearing a bearish crossover, signaling a potential sell-off. There's a gap from April 22nd aligning with the 50-61.8% Fibonacci retracement zone. Additionally, the gap from May 9th remains to be filled, which coincides with the 100 and 200 EMA levels.

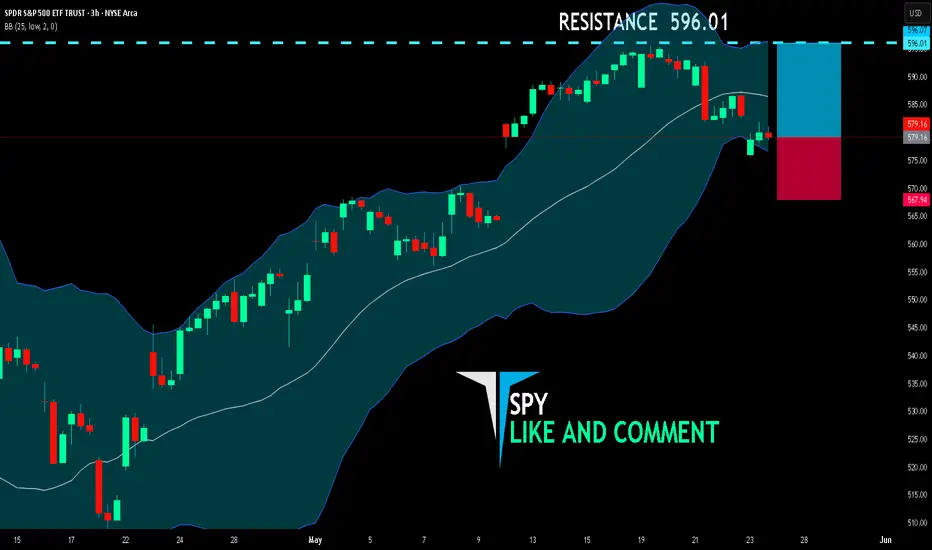
SPY LONG FROM SUPPORT
SPY SIGNAL
Trade Direction: long
Entry Level: 579.16
Target Level: 596.01
Stop Loss: 567.94
RISK PROFILE
Risk level: medium
Suggested risk: 1%
Timeframe: 3h
Disclosure: I am part of Trade Nation's Influencer program and receive a monthly fee for using their TradingView charts in my analysis.
✅LIKE AND COMMENT MY IDEAS✅
IWM: Post Market at 206.65 must be a bargaining match. Aftermarket traders joins the party. Any business idea's welcome!

IWM: Manipulation Accumulation and Trend Let’s see how the market reacts. We may open with a gap down or a gap up—next week will reveal the direction or at least offer a hint of what’s to come.

Stock Market Forecast | TSLA NVDA AAPL AMZN META MSFT GOOGLStock Market Forecast | CME_MINI:NQ1! CME_MINI:ES1! SPY QQQ
Mag 7 Forecast | NASDAQ:TSLA NASDAQ:NVDA AAPL AMZN META MSFT GOOG

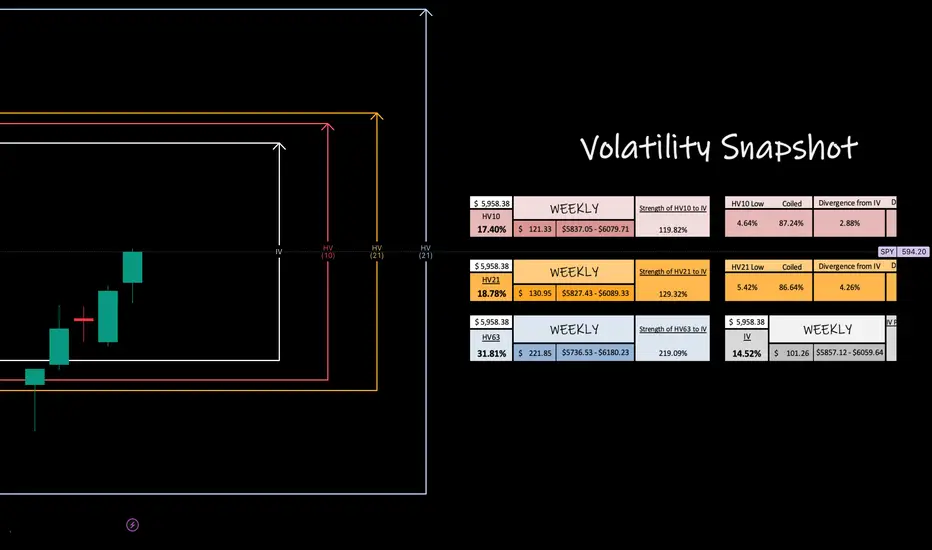
SPY Weekly PotentialVolatility, expressed through standard deviation, quantifies market elasticity and presents a level of probability and precision that humbles us all.
This week with AMEX:SPY bi-weekly trends have risen to just below our monthly values and are currently expansive over the markets IV prediction. Right now as I see it, HV10 is going resonate alongside our monthly values showing continued strength over IV. We could full regression to quarterly means as we move our of corrective territory then see consolidation to cool the markets down.
BOOST the post, drop a follow and comment, BUT don't forget to circle back at the end of the week to revisit and observe how our trending markets preformed!
Russel 2000 Weekly PotentailVolatility, expressed through standard deviation, quantifies market elasticity and presents a level of probability and precision that humbles us all.
This week with AMEX:IWM you can see that last week trending bi-weekly markets were more volatile than our monthly trending values. This could indicate regression to quarterly means, but for now shows a 15.02% premium advantage over current IV per move.
Bi-weekly, is as of now, only 10.81% off it's quarterly trend. However, it's important to observe that volatility can still consolidate under monthly in a poetic dance to coil up the monthly more on it's path in regression.
This is why in my charts you will notice a 'coiling' value under both HV10 and HV21 values.
BOOST the post, drop a follow and comment, BUT don't forget to circle back at the end of the week to revisit and observe how our trending markets preformed!

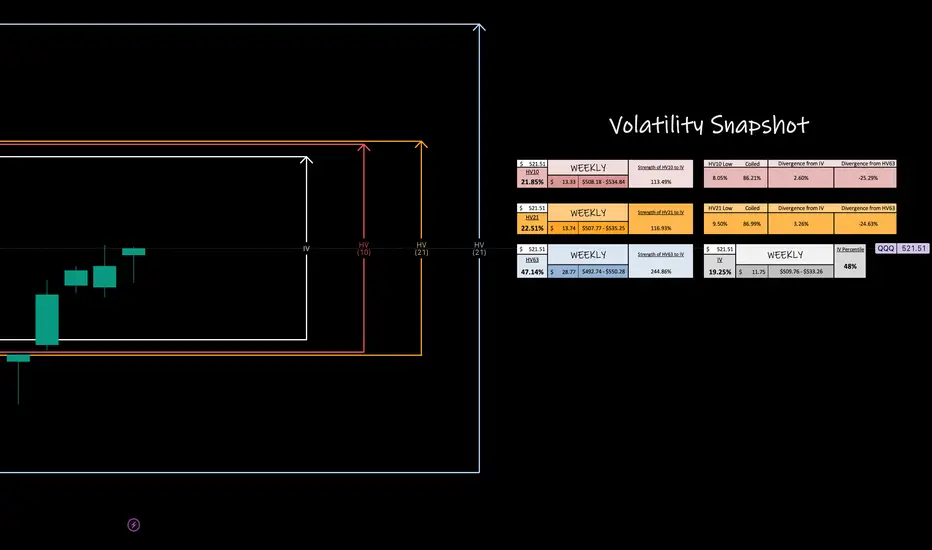
QQQ Weekly PotentialVolatility, expressed through standard deviation, quantifies market elasticity and presents a level of probability and precision that humbles us all.
This week with NASDAQ:QQQ we see that the shorter term trending volatility is resonating like SP:SPX and AMEX:SPY just under our monthly values. Range seems to be expanding allowing for cheaper premium capture per move happening. With any luck, we reflect and increase in volatility with up to quarterly means.
BOOST the post, drop a follow and comment, BUT don't forget to circle back at the end of the week to revisit and observe how our trending markets preformed!