hihiThe convergence of artificial intelligence and decentralized finance presents a paradigm shift in global economic systems, where algorithmic governance, autonomous agents, and smart contracts could redefine trust, efficiency, and access. This fusion offers transformative potential but raises critical ethical, regulatory, and socio-technical challenges demanding interdisciplinary exploration and resilient systemic safeguards.
Ask ChatGPT
ETF market

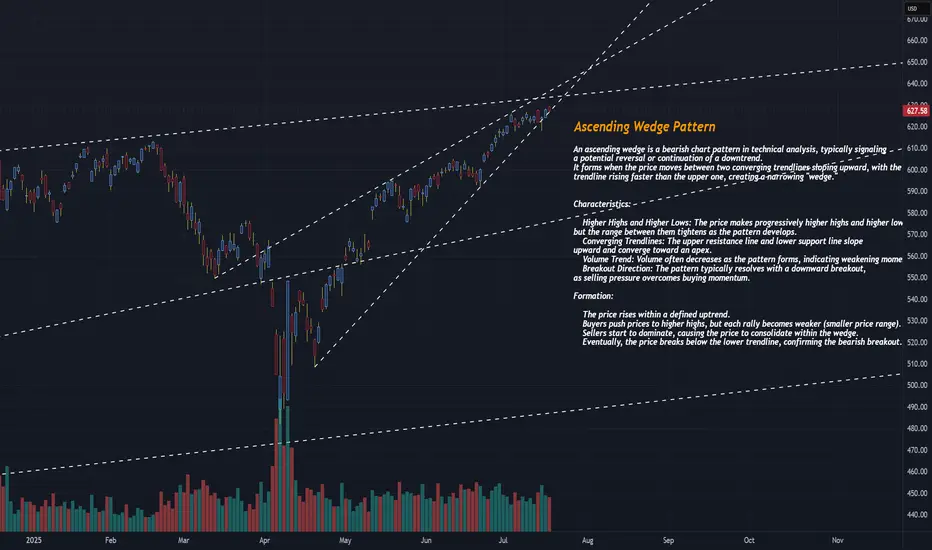
SPY CONTINUES IN AN ASCENDING WEDGE PATTERNThe SPDR S&P 500 ETF Trust (SPY) is currently exhibiting an ascending wedge pattern on the 30-minute chart, a bearish technical pattern that often signals a potential reversal or selloff when confirmed. Below, I’ll explain the ascending wedge pattern, identify key levels to watch for a potential selloff, and provide context based on recent market sentiment. Since I cannot view the real-time chart, I’ll base the analysis on the characteristics of an ascending wedge and recent posts on X that discuss SPY’s price action, ensuring a critical approach to the data.
What is an Ascending Wedge Pattern?
An ascending wedge (or rising wedge) is a bearish chart pattern formed when the price consolidates between two upward-sloping trendlines that converge over time. The upper trendline (resistance) connects higher highs, and the lower trendline (support) connects higher lows, creating a narrowing price range. This pattern typically indicates that bullish momentum is weakening, as buyers are pushing prices higher but with diminishing strength, often leading to a breakdown below the lower trendline.
Key characteristics of an ascending wedge include:
Converging Trendlines: Both the support and resistance lines slope upward, with the support line often steeper than the resistance line.
Decreasing Volume: Trading volume typically declines as the pattern forms, reflecting reduced buying conviction. A spike in volume often accompanies a breakout or breakdown.
Bearish Implication: In an uptrend, the ascending wedge signals a potential reversal to the downside. In a downtrend, it may act as a continuation pattern, but the bearish bias remains.
Breakout Confirmation: A convincing break below the lower trendline, preferably with increased volume, confirms the bearish reversal. A retest of the broken support (now resistance) may occur before further declines.
The pattern typically forms over 3–4 weeks but can appear on shorter timeframes like the 30-minute chart, making it relevant for intraday or short-term traders.investopedia.comen.wikipedia.org
SPY’s Current Ascending Wedge on the 30-Minute Chart
Given that SPY is in an ascending wedge on the 30-minute chart, we can infer the following based on recent posts on X and general technical analysis principles:
Pattern Context:
The ascending wedge suggests SPY has been making higher highs and higher lows in a tightening range, indicating a potential exhaustion of the bullish trend.
Recent posts on X (e.g., @AskPerplexity on July 16, 2025) noted a rising wedge in SPY with a breakdown through the lower trendline, suggesting bearish momentum. Another post (@YakshuMadaan on July 15, 2025) mentioned a wedge breaking below 6220, targeting 6050 on the S&P 500 index ( SP:SPX ), which correlates to SPY levels around $605–$610.
Key Levels to Watch:
Lower Trendline (Support): The critical level to monitor is the lower trendline of the wedge, which connects the higher lows. A decisive break below this level (e.g., a close below on the 30-minute chart with strong volume) signals a bearish breakdown and potential selloff. Based on recent X posts, this level may have been around $622 (equivalent to ~6220 on SP:SPX ) recently, but you should confirm the exact level on the current chart.
Upper Trendline (Resistance): The upper trendline connects the higher highs and acts as resistance. If SPY fails to break above this level, it reinforces the bearish bias. This could be near recent highs, potentially around $630–$635, depending on the chart’s progression.
Support Zones Post-Breakdown: If the lower trendline breaks, key support levels to watch include:
$590–$600: A post on X highlighted this as a major support zone based on volume profile analysis, likely corresponding to a prior consolidation area or gap fill.
$605–$610: Another post suggested a target of 6050 on SP:SPX , translating to roughly $605–$610 for SPY, aligning with a significant retracement level.
Retest Level: After a breakdown, the price may retest the broken lower trendline (now resistance). For example, if the breakdown occurs at $622, a retest could see SPY rally back to $622–$625 before resuming the decline.ig.com
Volume and Indicators:
Volume: Look for declining volume as the wedge forms, followed by a spike on the breakdown to confirm the move. Low volume during the wedge suggests waning bullish momentum.xs.com
Relative Strength Index (RSI): An RSI above 70 near the upper trendline or showing bearish divergence (lower RSI highs while price makes higher highs) strengthens the case for a selloff.xs.com
Moving Average Convergence Divergence (MACD): A bearish crossover (MACD line crossing below the signal line) near the upper trendline can confirm weakening momentum.xs.com
Potential Selloff Triggers:
A close below the lower trendline on the 30-minute chart, especially with a spike in volume, is the primary trigger for a selloff. For example, a break below $622 (if that’s the current support) could initiate a move toward $605–$610 or lower to $590–$600.
A failed retest of the broken trendline (e.g., SPY rallies to $622–$625 after breaking down but fails to reclaim the trendline) would confirm bearish continuation.
Broader Market Context: Recent X posts suggest market concerns about macroeconomic factors (e.g., interest rate fears, policy shifts) could amplify a selloff, especially if technical levels break.
COW : Daily Chart : Multiple Price Action ExamplesThere is a large bull flag.
Then toward its maturation the tweezer pattern forms to confirm the large flag.
Then there is now the Follow-Up after a tweezer which is looking nice.
I would now buy the break higher and follow it up to the left there is green wicks leading the way.
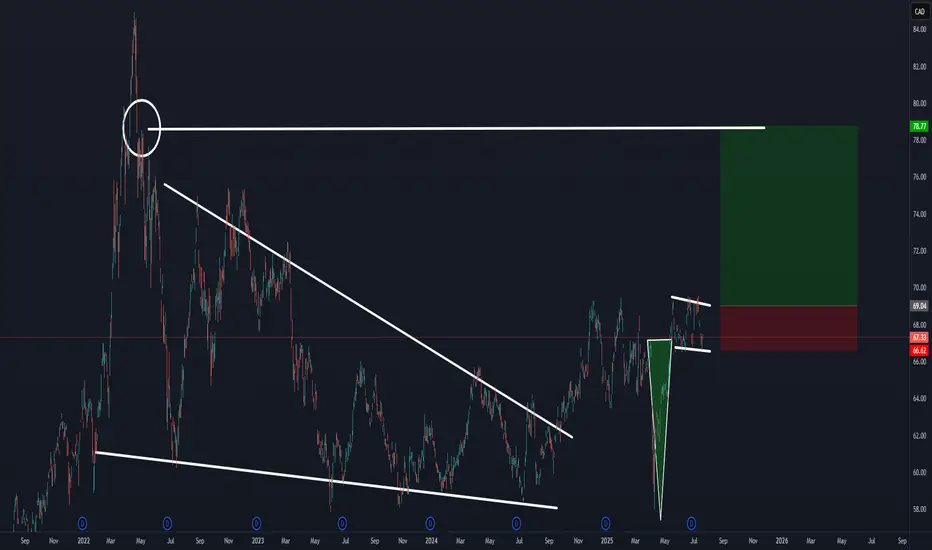
Possible Scenario for the Bond FundSimply took a previous move the Bond Fund already made, and inverted it, copy pasted and voila. It has already happened before
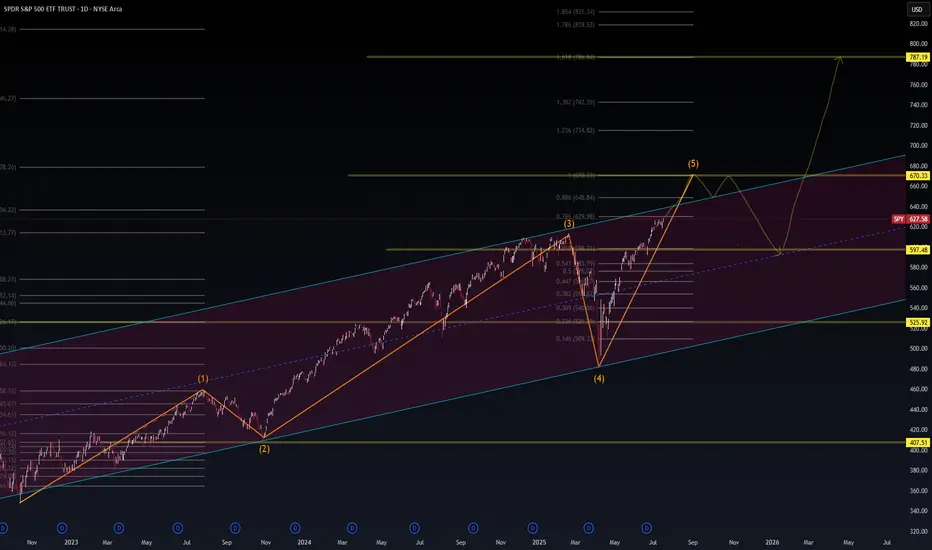
SPY Macro Wave Outlook – Bullish Fifth Wave into AI Supercy📈 SPY Macro Wave Outlook – Bullish Fifth Wave into AI Supercycle?
🧠 WaverVanir DSS | VolanX Protocol | Institutional AI Alignment
The SPY rally appears to be unfolding within a 5-wave macro impulse, currently inside Wave (5) targeting the 670–787 zone, depending on macro alignment and Fed behavior. This structure converges with long-term Fibonacci clusters and macro transition signals.
🔍 Thesis:
Wave (5) in Progress – Next resistance seen at ~670.33, followed by long-term targets near 787.19.
Pullback Scenario – A temporary correction into the 597–600 range is possible before further upside.
Structure Validity – Channel and Fibonacci extensions confirm bullish continuation unless macro conditions deteriorate sharply.
🧠 Macro Alignment Required:
Fed Pivot Late 2025 → Probability: 60%
Earnings Growth Led by AI → 11% projected for S&P500 (GS)
Productivity > Consumption → AI-led industries showing 5%+ labor productivity growth (Dallas Fed)
Low Inflation Reacceleration Risk → Core PCE stabilization key
⚠️ Risk Matrix:
Macro Risk Probability Notes
Fed Hawkish Reversal 30% Data-dependent but unlikely unless inflation re-flares
AI Concentration Shock 25% Tech-heavy rally, breadth remains a concern
Valuation Compression 20% Shiller CAPE near 37
Trade War Reignition 15% Tariff risk remains a geopolitical tail
🎯 Target Zones:
Near-term: 670.33 (Wave 5 peak)
Medium-term: 714–787 (Fib clusters)
Correction Zone: 597–600, invalidation below 525
The AI economy is accelerating—productivity is now outpacing consumption in several sectors. This macro regime shift could be the foundation for the next secular bull wave.
🔺 Powered by VolanX Protocol
⚠️ Not financial advice. Educational chart generated by institutional DSS models.
#SPY #VolanX #WaverVanir #ElliottWave #MacroTrading #AIProductivity #Fibonacci #FedPivot #USEquities #TradingSignals #SmartMoneyConcepts #InstitutionalStrategy #AIInvesting #SP500
SPY: Week of Jul y21stPosting an idea on SPY against better judgement.
Its a mess of an index but here is my attempt at an analysis with this trainwreck, haha.
Best of luck, safe trades and take care!

NEVER GO FULL..... GOLD EUPHORIAGOLD EUPHORIA HAS GONE FULL CYCLE — AND THAT MAKES ME NERVOUS
There was a time not too long ago when uttering the word gold in financial circles would elicit smirks, eye-rolls, or worse — instant dismissal. Between 2014 and 2019, the mere suggestion of accumulating physical bullion or positioning in junior miners like GDXJ was treated as a form of ideological extremism. You were either a doomsday prepper, a Ron Paul groupie, or a relic yourself — a “pet rock” clinger, waiting for a catastrophe that the Fed’s digital printing press would forever keep at bay.
But fast-forward to mid-2025, and gold isn’t just back — it’s fashionable. That should terrify you.
Suddenly, everyone sees it. Systemic fragility. Fiscal nihilism. The slow, nauseating decay of the dollar’s purchasing power. Even the “trust-the-Fed” technocrats and QE-forever interventionists are parroting the same doomsday lingo they spent a decade mocking. Now, they’re loading up on precious metals, layering macro doom threads on Twitter, and waxing poetic about Bretton Woods III. The same institutions that branded you a lunatic for shorting the Treasury complex in 2020 are now publishing breathless gold forecasts and endorsing BRICS currency chatter like it’s gospel.
When the gold trade starts getting consensus nods from CNBC anchors and Brookings fellows, something has changed. And not for the better.
Take a look at the VanEck Junior Gold Miners ETF (GDXJ) — the quintessential proxy for speculative precious metals froth. From its late-2024 bottom near $40, it rocketed to over $72 by June 2025 — a near-80% vertical melt-up in seven months. The volume on that ascent was substantial, no doubt, but what’s come since is even more telling. We’ve now got three weeks of topping candles, declining volume, and a weekly close this Friday at $66.19, down nearly 4% on the week. Support at $65 is teetering, and the next real floor sits closer to $60 — the prior breakout zone.
Technically, it smells like distribution. Psychologically, it reeks of complacency.
Call it the Minsky moment of the gold trade. Stability breeds instability. And nothing screams instability like a former pariah asset becoming a near-universal safe haven consensus play, right as speculative capital piles in at nosebleed valuations.
This isn’t a call on gold’s long-term validity — far from it. The monetary rot is real. The fiat debasement is mathematically terminal. And the entire global sovereign debt pile is one rate shock away from implosion. But markets don’t move in straight lines. Especially not when everyone is suddenly on the same side of the boat, citing the same macro talking points they ridiculed five years ago.
I’ve been here before. I remember accumulating metal when it was hated — not merely unloved, but reviled. Back when CPI read 0.2% and the Fed pretended it could tighten. Back when nobody knew what an SDR was and gold bugs were caricatured as paranoid survivalists waiting for a return to the gold standard. That was value. That was accumulation.
What we have now is a FOMO-soaked crescendo, where even the Keynesians are starting to sound like Austrian-school newsletter writers.
So yes, I’ve sold into this rally — at least the speculative tranche. I’ve taken gains in miners, trimmed the GDXJ fat, and built a list of bear-side entries for what I think is the inevitable correction. Because when the least-likely characters start echoing your thesis word-for-word, it’s time to reassess your positioning.
This doesn’t mean the dollar survives. It doesn’t mean the Fed has regained credibility. It simply means markets are reflexive — they overshoot in both directions. And when the gold trade becomes saturated with latecomers who believe the dollar dies tomorrow and the DXY is going to 40 in a straight line, the odds of a savage retracement increase tenfold.
I remain a long-term gold bull. But right now? The fever is high. The crowd is euphoric. And in markets, that’s when gravity tends to do its finest work.
Chart Notes:
Weekly candle closed at $66.19, down -3.85%.
Resistance: $72.00.
Immediate support: $65.00.
Stronger support zone: $60–61.
Weekly volume: 16.86M, with signs of declining momentum.

Stock Market Forecast | TSLA NVDA AAPL AMZN META MSFTStock Market Forecast | CME_MINI:NQ1! CME_MINI:ES1!
Mag 7 Forecast | NASDAQ:TSLA NASDAQ:NVDA AAPL AMZN META MSFT GOOG

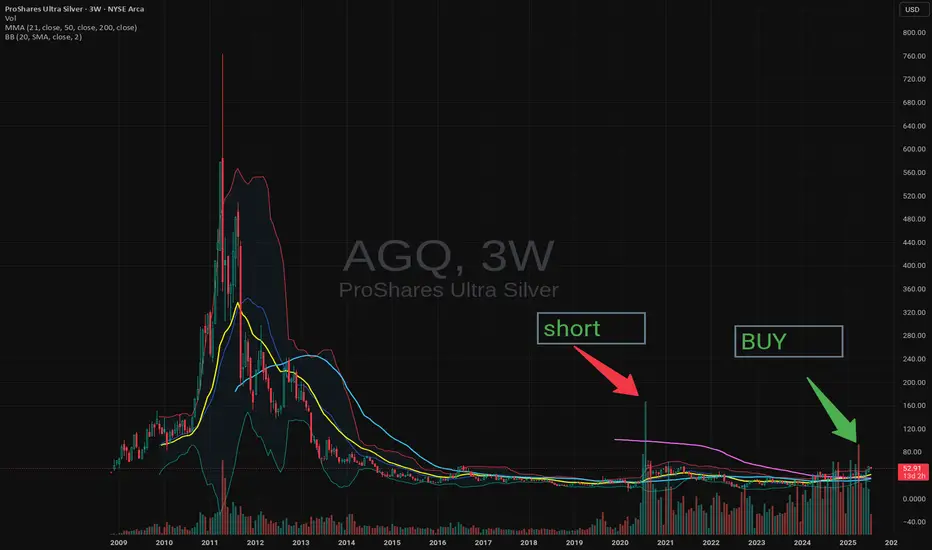
AGQ - LongAGQ
Well if this chart is any kinda indicator, it would suggest going up.
I have been long silver for a little while. All precious metals.
I like the potential.
thanks
NGAS vs henry hub & rbob - basement levelswill the ngas always remain so low?
with the huge run up of natural gas prices, the stocks have already run 10x. If you are too late to the party there are etfs such as NGAS that are at basement levels that have historically tracked against the gas futures

SPY: Market of Sellers
Our strategy, polished by years of trial and error has helped us identify what seems to be a great trading opportunity and we are here to share it with you as the time is ripe for us to sell SPY.
Disclosure: I am part of Trade Nation's Influencer program and receive a monthly fee for using their TradingView charts in my analysis.
❤️ Please, support our work with like & comment! ❤️
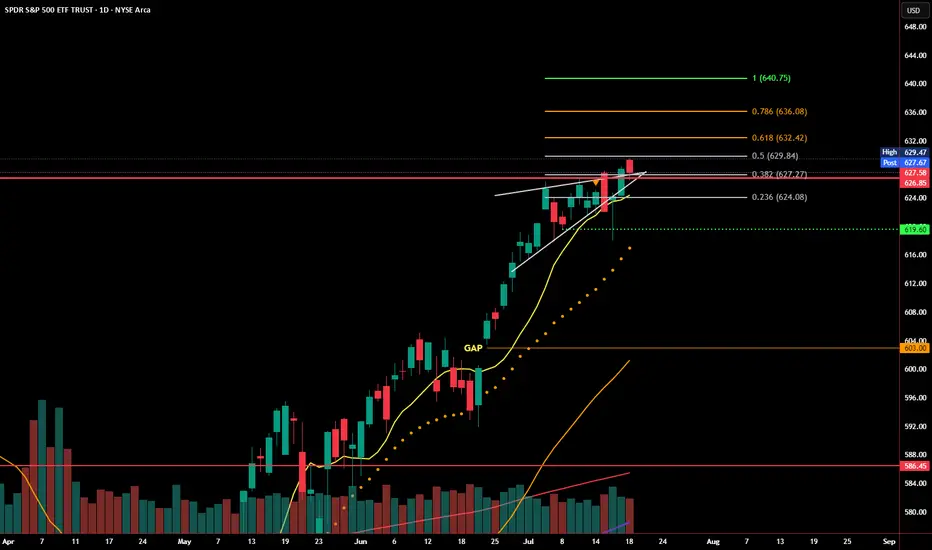
SPY Reclaims Rising Wedge Support - Bear Trap or Breakout Setup?SPY dropped below its rising wedge earlier this week, but that move may have been a bear trap. Price quickly reversed, reclaiming the wedge trendline and closing just below a key Fibonacci level at 629.84.
Buyers stepped in aggressively near the 0.382 and 0.236 retracement zones, defending short-term support. The bounce came on increased volume, signaling strength behind the recovery. Momentum remains intact as long as SPY holds above 626.
Now, bulls need to confirm with a breakout above 629.84–631.96 to open the door to the next levels at 635.63 and 640.30. Failure to break through could lead to another rejection and revisit lower support zones.
Levels to watch:
Support: 626.64, 623.62, 619.60
Resistance: 629.84, 631.96, 635.63
SPY is at a decision point. Reclaiming wedge support is a bullish signal, but bulls need follow-through to avoid another fakeout in the opposite direction.
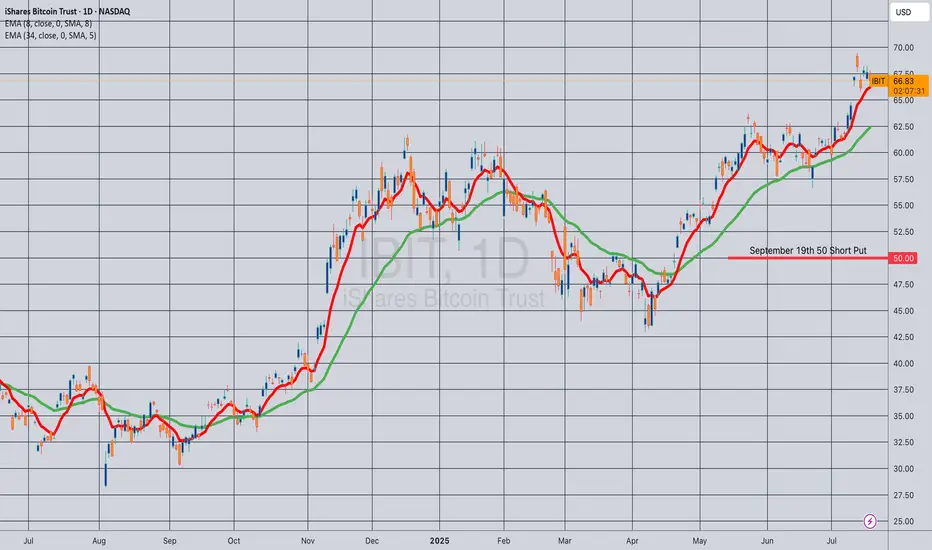
Opening (IRA): IBIT September 19th 50 Short Put... for a .52 credit.
Comments: Laddering out/adding at strikes better than what I currently have on, targeting the strike paying around 1% of the strike price in credit.
Will generally look to roll up at 50% max at > 45 DTE (Days 'Til Expiration).
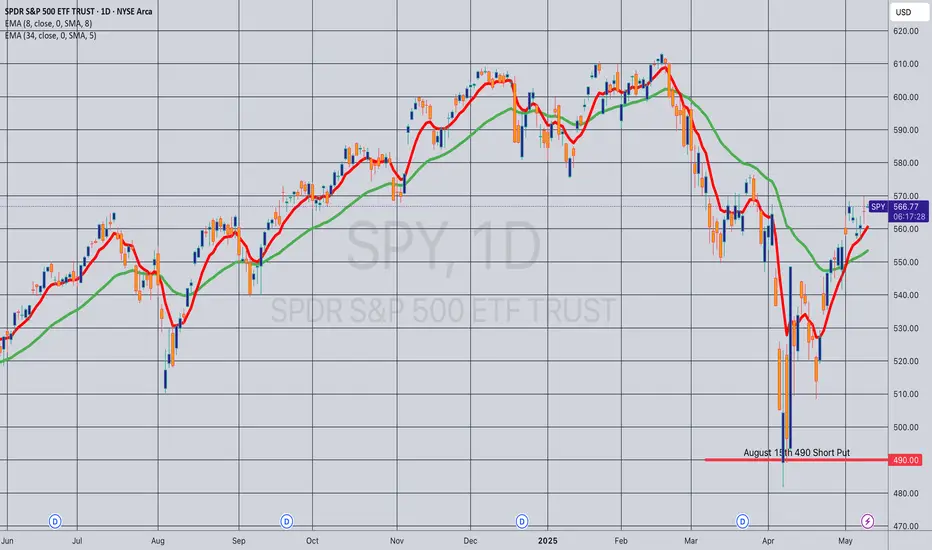
Opening (IRA): SPY August 15th 490 Short Put... for a 5.00 credit.
Comments: Laddering out, targeting the strike paying around 1% of the strike price in credit ... .
Will generally look to roll up to the shortest duration <16 delta strike paying 1% of the strike price if in profit.
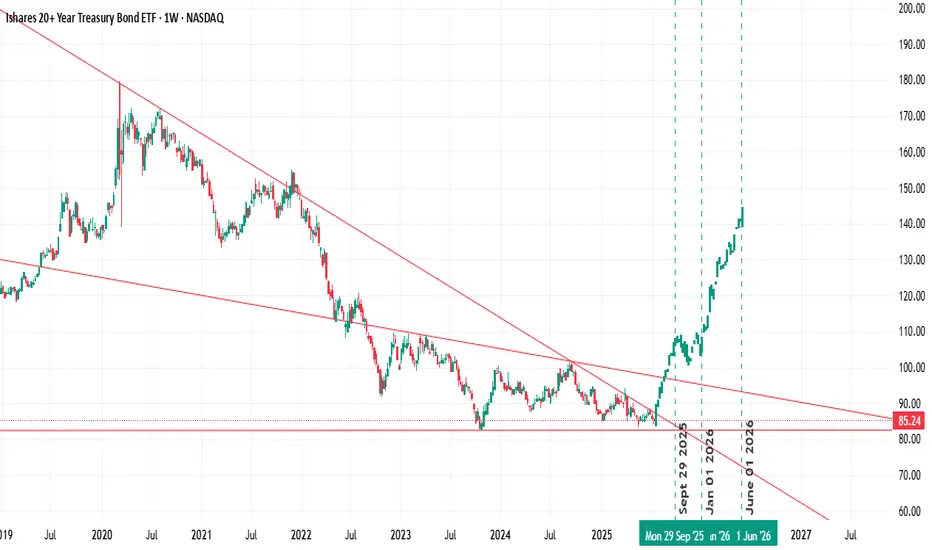
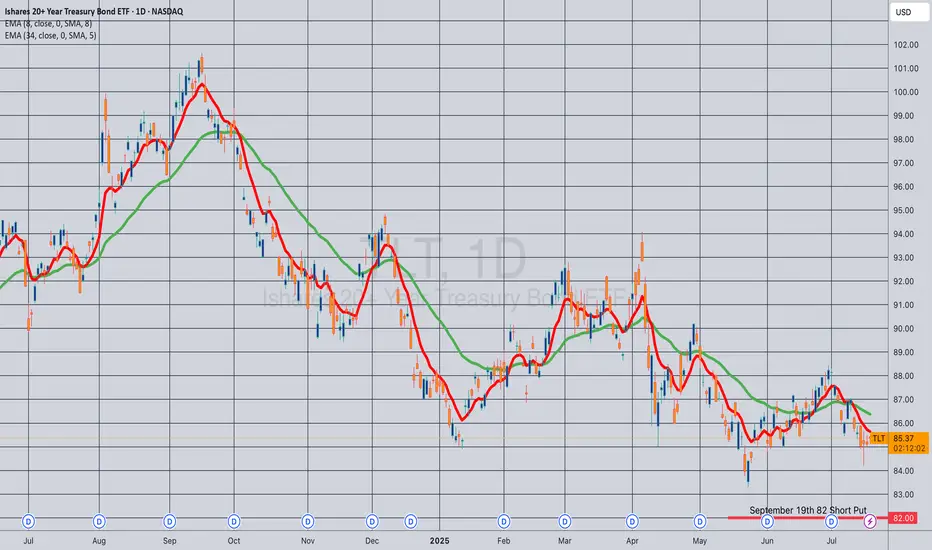
Opening (IRA): TLT September 19th 82 Short Put... for a .90 credit.
Comments: Adding to my position at strikes slightly better than what I currently have on ... .
Earnings Heat Up - 6300 and 6200 SPX Key Levels RemainMarket Update
SPX Key Levels
-SPX poked 6300 Tuesday, Thursday, and poked higher Friday (but settled back to 6300)
-6200 support remains a key level
-6050/6000/5800 next floor levels, I'll be looking for dips
I can see the market slowly (and I mean SLOWLY) grinding higher but preparing for a
reasonable seasonal selloff through end of July into end of September window
July 28-August 1 is a monster week in the markets
-Megacap Earnings (MAG7 Tue/Wed/Thu)
-Wed July 30 - FOMC (Pause expected but Powell's Press Conference is important)
-Friday August 1 - Non-Farm Payroll, Tariff Deadline
I'm hitting fresh YTD highs so I'm not complaining about this melt-up and grind, I'm simply wanting to allocate positions and add to my positions at better levels and with a slightly
higher VIX to help take advantage of the expected move being greater than the actual move
Have a great weekend and thank you watching!!!

SPY risk on for a few weekslooks like we are still moving up (SPX 6,400-6,500) but the risk to a correction is increasing.
FOMO phase on meme stock. so still profit to be had

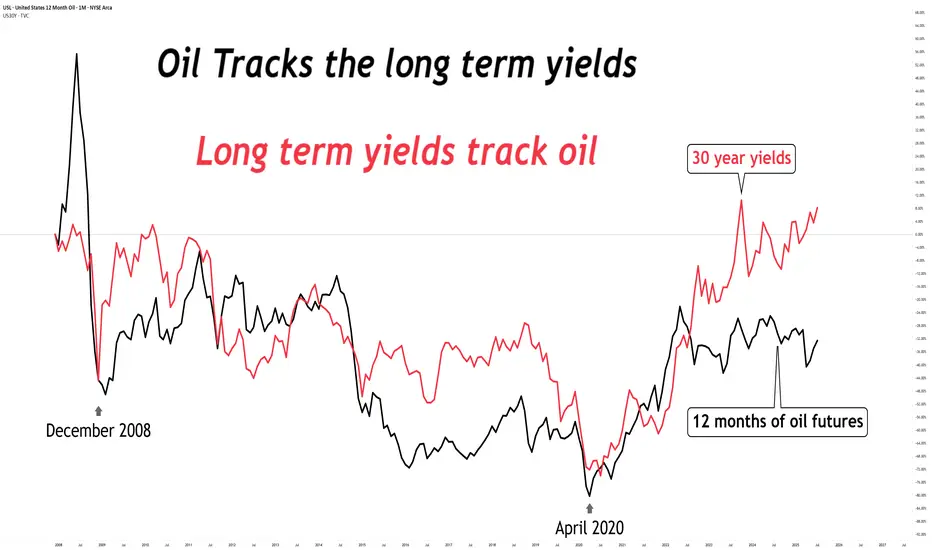
Oil tracks yields (or vice-versa)Looking at this chart...
Where do you think oil & long term yields are going?
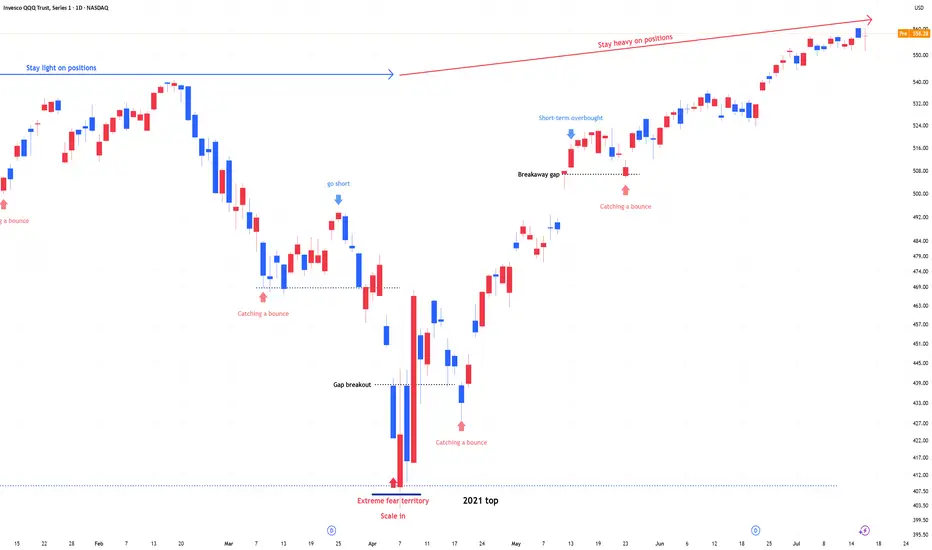
QQQ : Stay Heavy on Positions1) April Fear & Buy Signals
In early April, the Nasdaq 100 experienced a sharp sell-off, triggering extreme fear sentiment across the market.
At that point, scale-in buy signals appeared—classic "buy the fear" conditions.
2) Current Market State: No More Fear, but Watching
Since then, the market has stabilized.
The fear has disappeared, but we are still in a wait-and-see mode as traders assess the next move.
Momentum is holding, but participation remains cautious.
3) Stay Heavy on Positions
Despite short-term uncertainty, I’m maintaining an overweight position on the Nasdaq 100.
As long as we don’t see a major breakdown, the bias remains bullish.
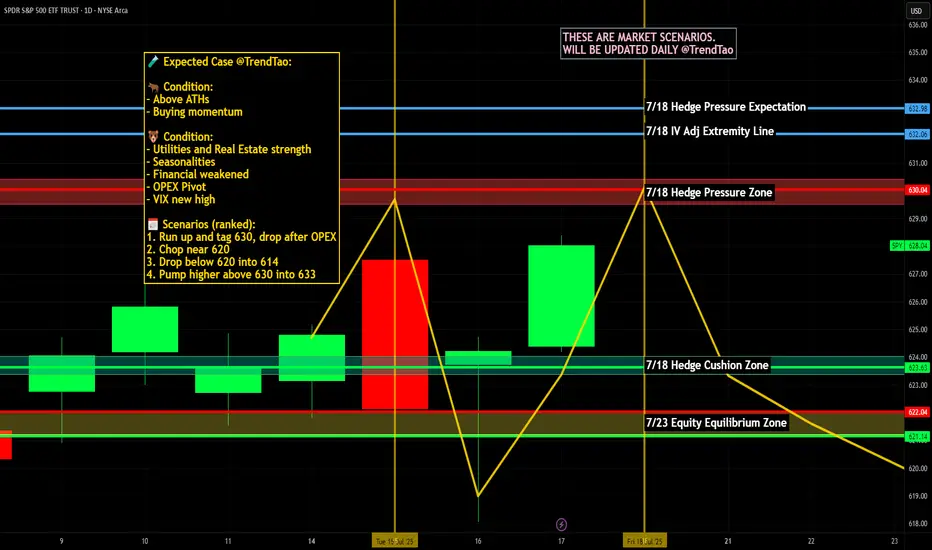
Nightly $SPY / $SPX Scenarios for July 19, 2025🔮 Nightly AMEX:SPY / SP:SPX Scenarios for July 19, 2025 🔮
🌍 Market-Moving News 🌍
🏢 U.S. Corp Buybacks Set to Propel Stocks
Citadel Securities expects U.S. companies to repurchase roughly $1 trillion of stock in 2025. With the blackout period ending in August, buybacks—historically strong in July, the stock market’s best month—could bolster valuations
⚖️ Fed Independence Debate Intensifies
President Trump’s continued criticism of Chair Powell has already weakened confidence in Federal Reserve autonomy. The fallout shows up in a weaker dollar, elevated Treasury yields, and rising inflation expectations—though stocks have remained resilient
🇺🇸 Immigration Rollback Sparks Economic Concern
The rescinding of Temporary Protected Status for ~900,000 immigrants could remove up to 1.1 million workers from the labor force. Analysts warn of potential stagflation risks, with GDP growth potentially down 0.3–0.4 percentage points and labor-market tightening ahead
💵 Massive T-Bill Issuance Incoming
Following the debt-ceiling deal, the Treasury plans over $1 trillion in T-bill issuance in the next 18 months. Money-market funds are expected to absorb much of it, influencing short-term rates and cash-market dynamics
📊 Key Data Releases & Events 📊
📅 Friday, July 19:
8:30 AM ET – Initial Jobless Claims
Weekly figure on new unemployment filings—a real-time indicator of labor-market resilience.
8:30 AM ET – Existing Home Sales (June)
Measures signed contracts on previously owned homes; key for gauging housing-market health.
All Day Events:
Ongoing corporate buybacks entering open window
Treasury auctions and T-bill issuance updates
⚠️ Disclaimer:
This information is for educational and informational purposes only and should not be construed as financial advice. Always consult a licensed financial advisor before making investment decisions.
📌 #trading #stockmarket #economy #monetarypolicy #debt #housing #labor #technicalanalysis
Elliott Wave Analysis: SPY Poised To Extend Higher In Bullish SeElliott Wave sequence in SPY (S&P 500 ETF) suggest bullish sequence in progress started from 4.07.2025 low. It expects two or few more highs to extend the impulse sequence from April-2025, while dips remain above 6.23.2025 low. SPY ended the daily corrective pullback in 3 swings at 480 low on 4.07.2025 low from February-2025 peak. Above there, it favors upside in bullish impulse sequence as broke above February-2025 high. Currently, it favors wave 3 of (1) & expect one more push higher from 7.16.2025 low in to 630.31 – 651.1 area before correcting in wave 4. In 4-hour, it placed 1 at 596.05 high, 2 at 573.26 low as shallow connector & extend higher in 3. Within 3, it placed ((i)) at 606.40 high, ((ii)) at 591.89 low, ((iii)) at 627.97 high & ((iv)) at 618.05 low.
In 1-hour above ((ii)) low of 591.89 low, it ended (i) at 605.96 high, (ii) at 603.17 low, (iii) at 626.87 high as extended move, (iv) at 620 low & (v) as ((iii)) at 627.97 high. Wave ((iv)) ended in 3 swing pullback as shallow connector slightly below 0.236 Fibonacci retracement of ((iii)). Within ((iii)), it ended (a) at 619.8 low, (b) at 624.12 high & (c) at 618.05 low on 7.16.2025 low (this week). Above there, it favors rally in ((v)) of 3 targeting in to 630.31 – 651.1 area before correcting in 4. Within ((v)), it placed (i) at 624.73 high, (ii) at 623.08 low & favors upside in (iii) of ((v)). We like to buy the pullback in clear 3, 7 or 11 swings correction at extreme area in 4 and later in (2) pullback, once finished (1) in 5 swings.

SPY 628 – Compression Before Expansion | VolanX Protocol Engaged🧠 SPY 628 – Compression Before Expansion | VolanX Protocol Engaged
📅 July 17, 2025
🔍 SPY (S&P 500 ETF Trust) | 1D Chart
📍 Current Price: 628.04
📈 Chart Thesis by: WaverVanir International LLC
🔗 Powered by VolanX Protocol
🌐 Macro Overview:
The market stands at a critical inflection point, with bulls and bears both pressing their narrative:
The Fed is expected to cut rates in September, with soft CPI and decelerating labor trends justifying a pivot.
Earnings season is bifurcated: Mega-cap tech is leading, while cyclicals are faltering. This raises the risk of a short-term rally masking deeper fragility.
Global macro risks – including rising geopolitical stress in the Asia-Pacific region and commodity volatility – increase the odds of a tail event.
📊 Technical Outlook:
SPY is now hugging a major supply zone near 628 with price stalling for multiple sessions. This area marks a compressed equilibrium where volatility is likely to expand soon. Key technicals:
Rejection candles suggest seller presence near 630.
Price is overextended but remains above all major EMAs.
Breakdown zone sits at 565, which aligns with prior resistance and a major volume shelf.
No current bearish divergence on RSI or MACD, but momentum is flat.
🎯 VolanX Probabilistic Bias:
The system currently anticipates three paths:
Bullish breakout toward 660–675 if the Fed confirms a dovish stance and tech continues to lead.
Neutral grind in the 600–615 zone if macro remains balanced and earnings don’t surprise.
Bearish breakdown to 565 or lower if macro stress emerges or dollar strength accelerates.
🛠️ Options Strategy Highlights:
Bullish Trade Idea: Buy 630C / Sell 660C (30–45 DTE) – Low cost, targets breakout above resistance.
Bearish Trade Idea: Buy 620P / Sell 565P – High R/R play into macro unwind.
Both are defined-risk strategies, ideal in volatile inflection zones like this.
⚠️ VolanX Note:
This is a classic binary event structure forming under institutional watch. DSS scans show compression is now mature. Whichever side confirms will likely trigger a large move, not a drift.
Let the narrative confirm the signal.
⚠️ This post is for informational and educational use only. Not financial advice.
#SPY #VolanX #MacroTrading #OptionsFlow #WaverVanir #FOMC #AIeconomy #LiquidityWave #TradingSignals
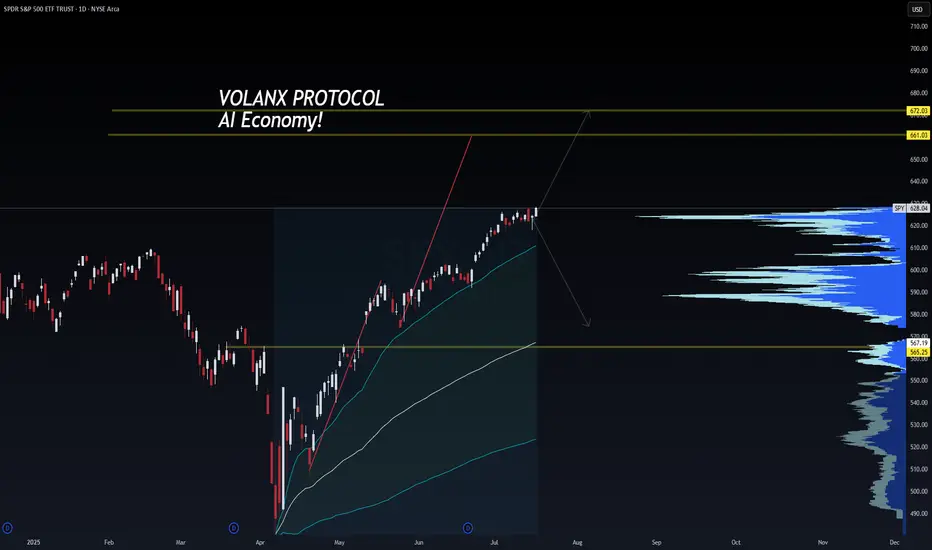
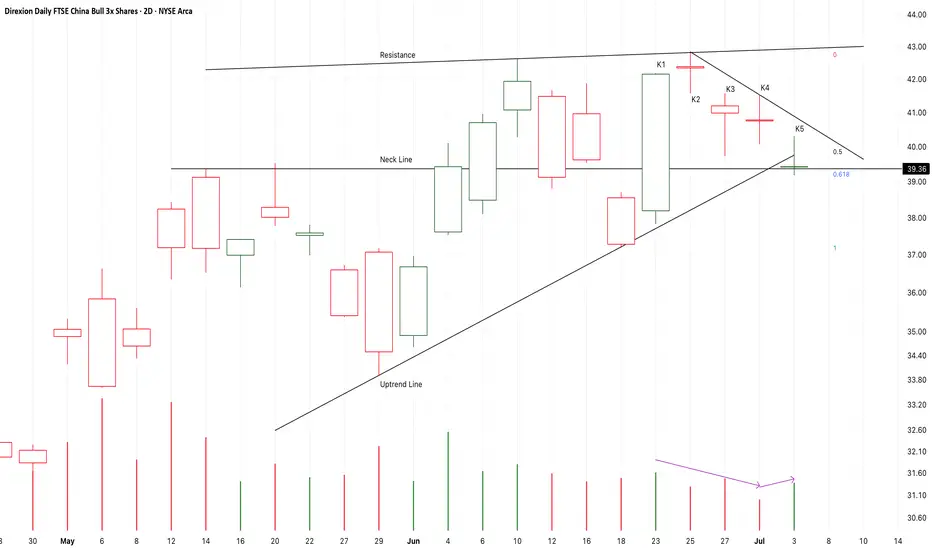
Chart Pattern Analysis Of YINN
From K1 to K5,
It is a small scale consolidation or a bullish triangle pattern.
The supply pressure is decreasing too.
It seems that K6 or K7 will break up or fall down.
If the following candles close upon K3 or K4,
It is likely that another bull run will start here to test 77USD area.
On the other hand,
If the following candles close below the neck line,
The risk will sharply increase.
Long-41.6/Stop-39.9/Target-77