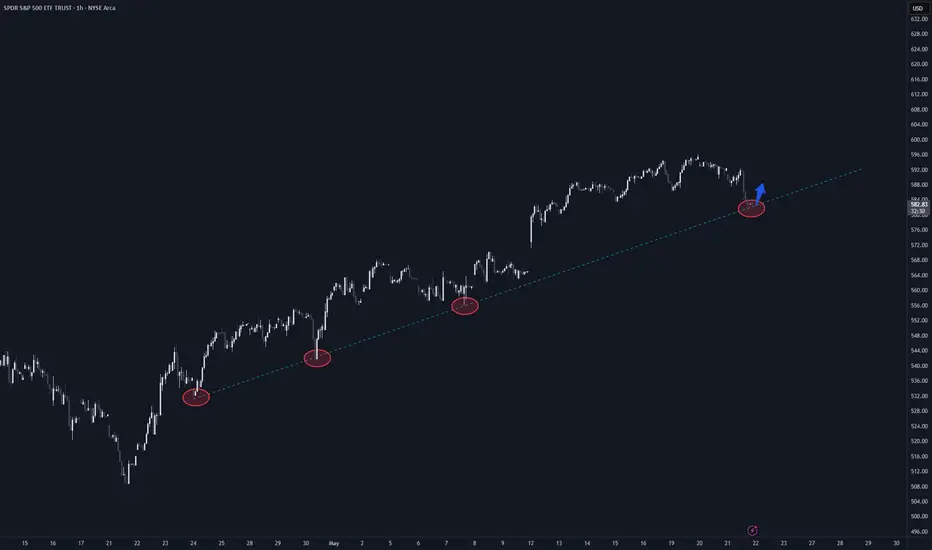
Why this may be the bottom: Touch of crucial trendlineI think it may be a good idea to go full port long here.
We will be re-visiting the 590s again very soon.
This sell off was a result of a impending pent up dump that needed to happen sooner rather than later.
ETF market
spy filling gap, to continue to upside? #tradewhatyousee
Market rallied up, inside area of interest for selling, will the GAP be a area of where buyers want to get involved?

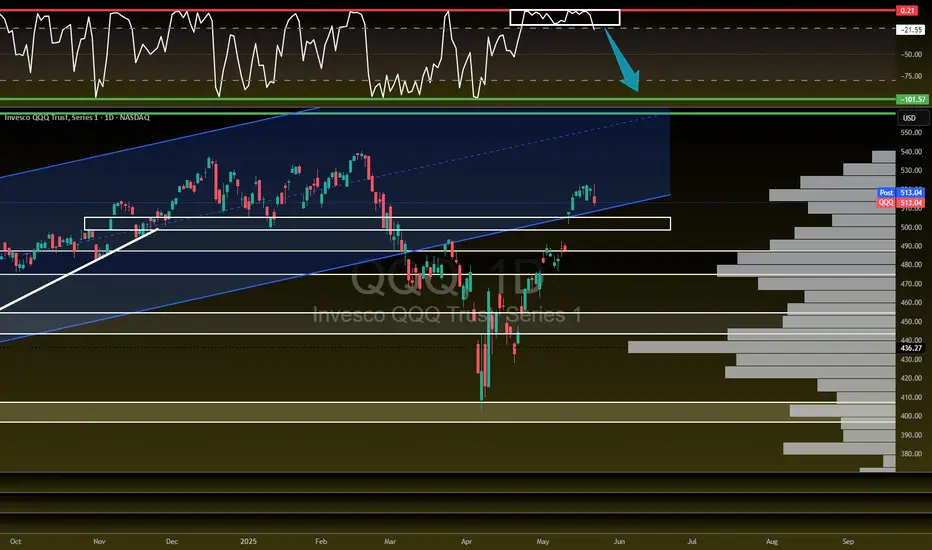
QQQ about to FLUSH?! Let's talk about it!I'm not saying it's over but you have to admit it does feel like we are going to see a decent size pullback...2-6% over the next few weeks on the NASDAQ:QQQ AMEX:SPY
- TVC:VIX back over 20
- US20Y hit 52 week high
- USDJPY starting to creep towards April lows
- $491.54 GAP to fill on NASDAQ:QQQ
- $447.58 Bigger GAP to fill on NASDAQ:QQQ
- Credit starting to become and issue
- Banks/ Credit companies tanked today
There is bullish pieces as well but we do look extended here and a healthy 2-6% would be welcomed...A break of $475 level spells trouble on QQQ.
Trend Line in Play - Imminent Advance in Small Caps?Small Caps look the least extended in this equity rally and I really like the tight ranges before it advances to it's next box. My analysis puts IWM imminent on its next advance upwards. Put this trade idea under: "The trend is your friend until it bends".

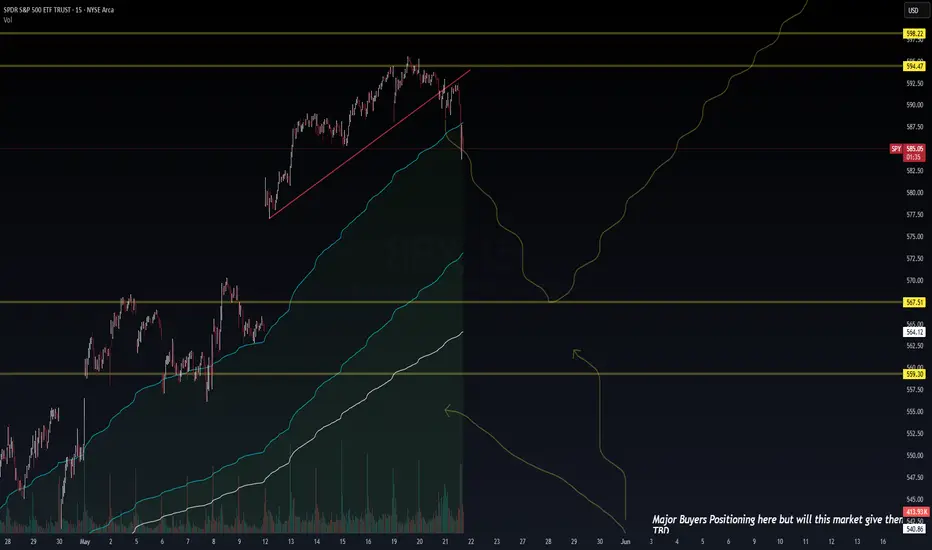
SPY Intraday Breakdown | Will the Fill Zone Hold?🕰️ 15-Min Chart | May 21, 2025
🏢 Posted by: Wavervanir_International_LLC
A textbook ascending wedge breakdown has triggered intraday, breaching dynamic support right at the edge of the VWAP envelope. This breakdown aligns with a higher time-frame rejection seen near 598.22 (0.886 retrace zone).
🔍 Intraday Observations:
Structure Break: Rising wedge support snapped → suggests momentum shift short-term.
Next Liquidity Pools:
📍 567.51 – Prior HVN zone and VWAP mid-band
📍 559.30 – Golden pocket + historical positioning from April
Volume Spike: Bearish confirmation on rising sell-side volume.
🧠 Strategic Context:
Macro Tone: Market breathes as participants await key inflation data + Fed speak. Liquidity is not risk-on.
Risk Flow Watch: Options OI building around 560/570 strikes — could magnetize toward there if flow accelerates.
🛡️ Tactical Setup:
Short-Term Bias: Bearish to neutral into 567.5–559.3 zone
Mean Reversion Setup: Watch VWAP / 3-day anchored VWAP cluster around 559 as a potential reload zone
Invalidation: Quick reclaim and hold above 590 with strong volume flips intraday tone bullish again.
📌 Message to Traders:
Major buyers may be lurking below. The market is deciding whether to reward trapped longs or give value buyers their fill at better risk-adjusted zones. We remain liquidity-aware and flexible.
—
🔗 #SPY #IntradayTrading #VolumeProfile #Wavervanir #LiquidityMapping #VWAP #Orderflow #SMC
SPY | Liquidity Engineering or Reversal?🕰️ Daily Chart | May 21, 2025
🏢 Posted by: Wavervanir_International_LLC
“Major buyers are lurking... but will the market deliver the fill they want?” That’s the question.
We’re currently watching a tactical rejection near 598.22, the 0.886 Fib retracement of the prior high-volume breakdown. This level historically serves as a liquidity sweep zone before decision-making candles emerge.
🔍 Technical + Volume Profile:
Liquidity Zones:
Resistance: 594.4–598.2 = prior supply + Fib confluence
Demand Zones:
567.5 → anchored VWAP / trend channel midpoint
559.3 → 0.618 Fib + major positioning cluster
Volume: Distribution volume into prior highs = possible short-term exhaustion
EMA Structure: Bullish stack but extended from mean; room for reversion to VWAP bands.
🧠 Macro Overlay:
Risk Events: Debt ceiling headlines are muted, but upcoming PCE inflation and labor data could dictate short-term gamma positioning.
Options Skew: OTM put volume rising; VIX curve remains steep in front-end → suggesting hedging or prep for pullback.
Macro Setup: Real yields are sticky, and the Fed is not signaling dovish pivot yet — any continuation will need confirmation via breadth and credit spreads.
🛡️ Risk Framework:
Reclaim 598.2: Bias flips bullish with upside into 613–644
Break Below 567.5: Opens doors for deeper retest at 559 or even 533
Neutral Range: 567.5–594.5 → Let market structure show intent before deploying size.
📌 Game Plan:
Let price come to you. Patience > Prediction. Market is deciding whether to reward early breakout traders or punish late longs via mean reversion. Watch the 567–559 cluster—that’s where smart money may reload.
—
🔗 #SPY #MacroTrading #VolumeAnalysis #RiskManagement #Fibonacci #Wavervanir #SP500 #LiquidityMap

India 50 Major Market Caution Signs Emerging!Any time you see multiple head-and-shoulders patterns forming on the chart often signals serious trouble ahead.
Stay vigilant for a break in the right shoulder of this massive head-and-shoulders pattern currently developing.
As a macro trader, I focus on the big picture—economics and long-term trends. While markets like India and long-term trading don’t get much TV coverage, my aim is to shift your perspective and enhance your trading strategy.
Follow this post to track how multiple head and shoulders patterns and a rising bearish wedge evolve over time.
Let’s ignite your curiosity and elevate your overall trading and investing.
Like, follow, and subscribe to join me in tackling these wild markets. Let's get to 5,000 followers!

SPY and SOXX...kinda a big issue of realitySo if the SPXL tracks the SPY and is pretty chuck at the ATH....
And the SOXL tracks the SOXX and is at the ATL....
What am i missing that others get....cause when your semiconductors are said to the AI backbone and its our future.....
Why is SOXS and SOXL relatively close in price...
I mean SPXL (SPY long) is like 155 and SPXS (SPY short) is like 5 something
So how does that graph not say what you see if fake...hmmm

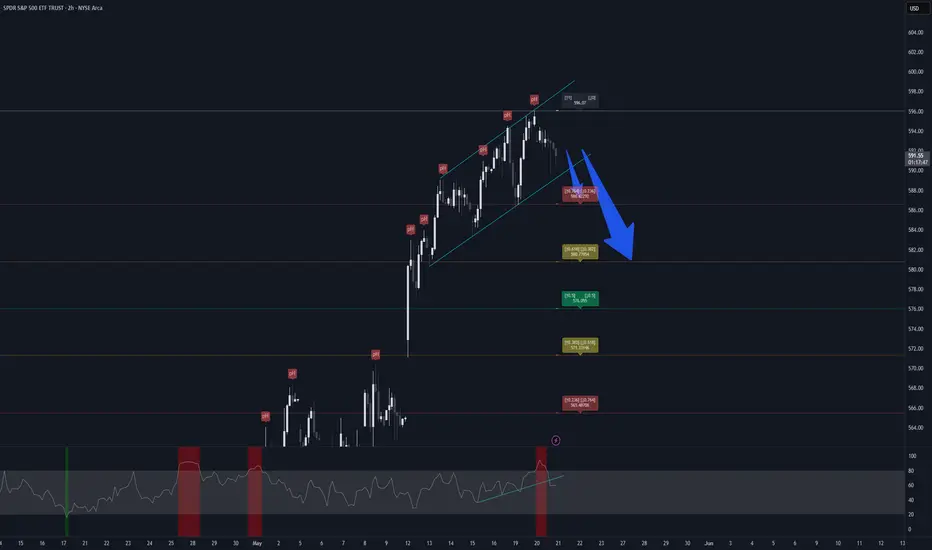
2-3 % Drop coming for SPY 581 -> 571...The top is in...----May 20, 2025 Update----
Price made its first lower high at 593 and retested 589 today.
I am expecting the next breach of 589 to cascade all the way down to the 581 level (1st target), and finally to 571.
Patience pays.
SPY trend reversal linear analysis, with parallel stackingAll the annotations speak for themselves...
but just a simple idea to see if there are levels that make sense if the descending line were to be reversed and applied to the ascending trend.
Have to follow those rules, and if too cluttered on choppy weeks- then hold the bottom line and only increase the newest line if you have price chopping greater than the height of the biggest candle in said chop.
ergo, if the biggest candle is say 4 point up from the last trend line off the inception permanent line ascending trend, then hold that line at the high of that day until price breaks above it. If chops continues above it, then draw another parallel 4 points (the height of that largest candle before the chop started) above the original line and hold it there until the chop continues up or is reverts and heads back down.
If you want to see if chop is a flag formation, then take the above example of a big candle up marking a new parallel line high and see if price for 3-4 days stays within it, pull down another parallel from that high and put it on that low...will allow for visual where the flag boundaries may be...
BTC 4hr examples:

$QQQ is due for a pullback! GAP fill inboundNASDAQ:QQQ is due for a pullback!
- Slamming into $522ish Volume shelf
- At the red barrier and needs to peel off
- GAP fill down to $491.54
- Strong volume but can't push through $522 resistance

Is this a platinum breakout?Using a weekly chart of a platinum ETF.
Breaking out above it's triangle pattern. Needs confirmation though or retrace in the next coming months

Copper Nearing a Important DecisionCopper price began forming a negative move, activating with the negativity of the main indicators, to settle near the extra support at $4.5000, facing negative pressures will increase the chances for breaking the current support, to open the way towards targeting extra negative stations, which might begin at $4.4500 reaching $4.3100.
The failure to break the current support might push the price to form mixed trading, and there is a new chance for targeting 50%Fibonacci correction level near $4.6600.
The expected trading range for today is between $4.4500 and $4.5600

VAGX ETF: A Hidden Gem in an Era of Economic UncertaintyIn a world of shifting economic tides, investors are constantly searching for assets that offer both stability and growth potential. The Vanguard Global Aggregate Bond UCITS ETF (VAGX) may be one such opportunity, quietly accumulating strength amid global economic fluctuations.
Understanding VAGX ETF’s Accumulation Phase
VAGX tracks the Bloomberg Global Aggregate Float Adjusted and Scaled (CHF Hedged) index, which includes a diversified mix of corporate and government bonds. Since its inception in September 2021, the ETF has steadily grown, accumulating assets and reinvesting interest income to enhance long-term value. With 8,891 holdings and a low expense ratio of 0.10%, it offers broad exposure to global fixed-income markets.
Macroeconomic Landscape: Tariffs, Inflation, and Interest Rates
The global economy is at a critical juncture, with policy shifts and trade tensions shaping investment strategies. Key factors influencing VAGX’s potential include:
Tariffs & Trade Tensions: Recent tariff escalations have heightened uncertainty, impacting global trade and economic growth. This environment makes bond-based ETFs like VAGX attractive as investors seek stability.
Inflation Trends: Inflation is projected to moderate slightly in 2025, but remains a concern for central banks. Bond ETFs, particularly those with investment-grade holdings, can serve as a hedge against inflationary pressures.
Interest Rate Outlook: The Federal Reserve’s stance on interest rates has been influenced by inflation and trade policies. While rate cuts may be delayed, fixed-income assets like VAGX can provide a reliable store of value in uncertain times.
Why VAGX Could Be a Strong Long-Term Holding
Diversification: Exposure to global bonds mitigates risk compared to single-market investments.
Accumulating Nature: Interest income is reinvested, compounding returns over time.
Hedged Against Currency Fluctuations: CHF hedging reduces volatility from exchange rate movements.
Low Expense Ratio: At 0.10%, it remains cost-efficient for long-term investors.
Final Thoughts
As the global economy navigates inflationary pressures, trade uncertainties, and interest rate shifts, VAGX ETF stands out as a stable, accumulating asset with strong long-term potential. Investors looking for a reliable store of value and gradual appreciation may find this ETF an attractive addition to their portfolios.
SIX:VAGX INDEX:BTCUSD SP:SPX TVC:DXY OANDA:XAUUSD BITSTAMP:BTCUSD $ EURONEXT:N100 SIX:SMI TVC:SXY

IHAK ETF remains a BUY for meAccording to this site Americans 60 and older lost $4.8 billion to cyber-crime in 2024......
That is a lot of money LOST. In the cyberspace, more digital information is stored online be it hard disk or using the cloud space. Hackers or digital criminals skilled in computer skills are able to access to private and confidential information of hospitals, government agencies and banks. There have been many cases being exposed online.
This gives the CEO sleepless nights as such sensitive information like medical records, financial information should be kept confidential. In comes the cyber security companies to help prevent this from happening.
So, in a big picture, all I need to know is more cyber crimes are happening worldwide as internet penetration gets deeper from desktops, laptops to mobile phones and people are almost unable to live without one device or multiple. Call it withdrawal symptom or addiction, the more people use, the more data/information is being stored and the more it needs to be protected.
That is why I like both the IHAK ETF . Since this is a pretty concentrated sector, I would prefer buying the blue chips cybersecurity company than to cherry pick the companies. This way, I have the best of both world and a margin of safety as well.
Of course, buying a broad based ETF , you cant expect the returns to beat the individual company so managing your own expectations is important.
As usual, please DYODD

MSTU - Microstrategy 2x Leverage TargetsI feel like BTC will hit ATH soon, very soon. Likewise this leveraged ETF will likely run as well. I have mapped out some upper targets for the bulls. Plenty of room to run on the daily time frame. Not financial advice. DYOR.

Nightly $SPY / $SPX Scenarios for May 21, 2025🔮 Nightly AMEX:SPY / SP:SPX Scenarios for May 21, 2025 🔮
🌍 Market-Moving News 🌍
🇺🇸 G7 Finance Ministers Convene Amid Tariff Tensions
Finance ministers from G7 nations are meeting in Banff, Alberta, focusing on restoring global stability and growth. Discussions are expected to address excess manufacturing capacity, non-market economic practices, and financial crimes. Tensions may arise due to recent U.S. tariffs affecting multiple G7 nations.
🛢️ Oil Prices Rise on Geopolitical Concerns
Oil prices increased over 1% following reports that Israel may be preparing a military strike on Iranian nuclear facilities. Such actions could disrupt Middle East oil supplies, particularly if Iran blocks the Strait of Hormuz, a vital passage for crude exports.
📈 Retail Earnings in Focus
Major retailers, including Lowe's ( NYSE:LOW ), Target ( NYSE:TGT ), and TJX Companies ( NYSE:TJX ), are set to report earnings today. Investors will be closely monitoring these reports for insights into consumer spending patterns amid ongoing economic uncertainties.
📊 Key Data Releases 📊
📅 Wednesday, May 21:
10:00 AM ET: State Employment and Unemployment (Monthly) for April 2025
10:30 AM ET: EIA Crude Oil Inventory Report
⚠️ Disclaimer:
This information is for educational and informational purposes only and should not be construed as financial advice. Always consult a licensed financial advisor before making investment decisions.
📌 #trading #stockmarket #economy #news #trendtao #charting #technicalanalysis

SPY interesting view of Fib-extension off 07-15 highsJust a simple extension using basic settings////
quite the serious number of levels hit and sometimes, things work
So are we looking at a smidgen more up and then double resistance and then down?
Who knows...but closer view:

SPDR Possible Reversal hammer on the SPY Daily, more red?SPY on the daily chart, seems to bounce up when it touches the lower trend line the past several weeks but this time it shows some exhaustion on the buyers. Are we going to see more red or gap up tomorrow?

Big Wick Month in Classic Bear MoveWhich type of move we're in is hard to determine at this point, but if we were inside a classic bull trap we'd have to trade down to 5500 - 5400 from this zone.
It'd have to be a wick rejection on the monthly candle.
Which would mean we'd have to dump over 7% in the next 10 days.
These things may or may not happen, but the odds betting on them are awesome.

SPY ... intersting levels when view by DXY ratio and pitchforkSame as all my others, so for reference see my earlier ideas for better grasp of what I do...
But when the dollar changes, you must track that with price to see if things are in inflated territory or deflated territory. As in, gold goes up cause the currencies its measured against go down....cant view it another way.
So if SPY is overdone, it should be higher than previous highs...which the one chart below shows....but the price chart doesn't show it....so if your stock accelerates faster than the currency can devalue....you have potentials for blowoffs and hard reversions.
enjoy:

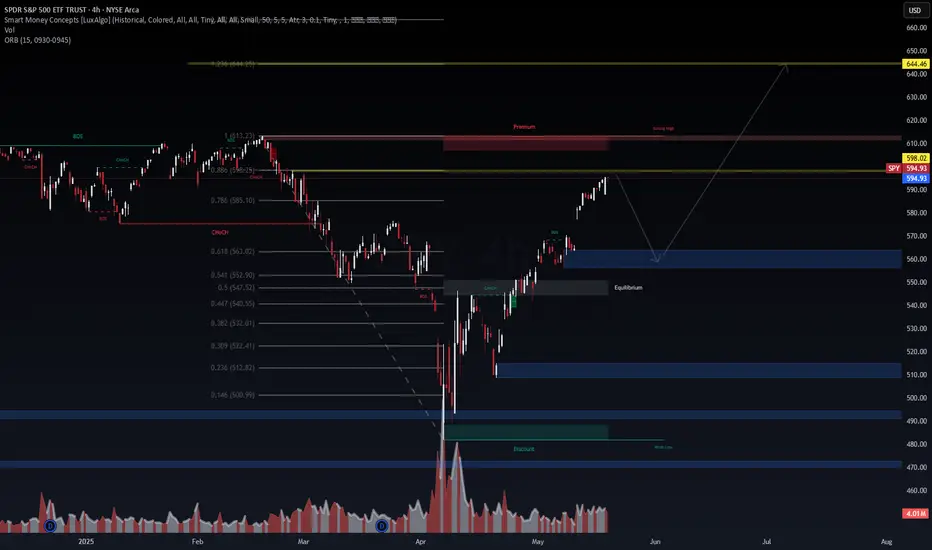
SPY 4H | Smart Money Concepts x Fibonacci ConfluencePrice has rallied into premium territory (above the 0.786–0.886 Fibonacci retracement), tapping into a prior strong high with signs of exhaustion. From a Smart Money perspective, we're entering a high-probability sell-side liquidity sweep zone. 📉
Key Technical Highlights:
🔺 Strong High @ ~613.23 aligning with FVG and premium zone
🔻 Projected retracement target: 560–565 zone (mid-FVG & equilibrium)
⚖️ Equilibrium at ~563 — likely acting as magnet for price
🟦 Demand zone and breaker block overlap between 560–570
📈 Long-term bullish trajectory remains intact if this corrective leg plays out and holds
Bias:
Short-term Bearish: Potential rejection from premium into equilibrium
Mid-term Bullish: If we reclaim the demand zone with strength, we likely re-accumulate and target the ultimate liquidity grab @ 644.46
"Liquidity seeks liquidity. Patience is premium." – Wavervanir DSS
📍Watch for volume confirmation and reaction near 560–570 before scaling in. If invalidated (close above 613), reevaluate bullish breakout scenario.
#SPY #SmartMoney #Fibonacci #Wavervanir #Liquidity #VolumeProfile #OrderBlocks #TradingView #QuantStrategy #PriceAction #SMC
$SPY May 20, 2025AMEX:SPY May 20, 2025
15 Minutes.
The expected retrace did not happen.
588-594 movement has led the 200 averages in 15 minutes to move up gradually.
So, the move 588.1 to 595.53 holding 591-592 levels uptrend intact for 598-599 levels.
This is extension for the move 541.52 to 568 to 556
AMEX:SPY weak below 590-589.
