Rising wedge on SPY - Melt up? or Next leg down? Immediate Bias (Tomorrow):
Scenario 1 – Bullish Continuation (Low Probability unless there's a macro catalyst):
Breaks above ~$596–$598 cleanly
Retests that zone as support (watch 595.50 intraday)
Then targets:
600 psychological
604–608 upper resistance channel
Possible end-of-month blow-off top: 612–618
Scenario 2 – Pullback / Rejection (More Probable Setup):
Rejected at ~596–597 zone (which aligns with upper wedge resistance)
Breakdown below $590 intraday
Then targets:
587.80 EMA cluster (20/50)
If lost → 576.44 next EMA + demand level
Followed by major support at 565.87 / 563.43
🔥 Week Ahead Trade Plan (May 20–24)
✅ Bullish Possibility:
If NVDA earnings, FOMC minutes, or macro data surprise to the upside
Watch for breakout above the red wedge and hold above 600
Target range: 604 → 612 max upside
🚨 Bearish Scenario:
Wedge breakdown below ~$590
Momentum cracks down to:
587
576 (watch for bounce)
If panic selling → 565–563 (larger time frame buying zone)
Volume divergence and overbought EMAs support a potential cool-off.
📅 Monthly Projection (End of May):
If wedge breaks down → consolidation range between 563 – 587
If wedge breaks out → blow-off rally up to 612–620, but likely to fade quickly
Fed commentary and NVDA earnings on May 22 will be major catalysts
📌 Key Levels
Type Price Notes
Resistance (R3) 612–618 Final upside blow-off zone (channel top)
Resistance (R2) 604 Overhead channel line
Resistance (R1) 595–598 Wedge top + major resistance
Support (S1) 587 EMA cluster + strong local demand
Support (S2) 576 Clean structure + prior breakout
Support (S3) 565–563 Confluence of long-term EMAs + trendline
🎯 Trade Setups
📉 Bearish (Favored if no breakout tomorrow):
Short 595–597 with stop above 600
Targets: 587 → 576
Optional: Add below wedge break (~590)
📈 Bullish (Confirmation-based):
Break + retest of 597–600
Target: 604, then scale out at 612
Avoid front-running long unless you see volume + price close outside wedge
ETF market

THIS TIME IT'S DIFFERENT!🔥 THIS TIME IT'S DIFFERENT! 🔥
Can you see the shift?! VOLUME IS HERE—AND IT'S MASSIVE. 💪💰
Unlike those weak, fleeting rallies that got crushed under waves of red, this one is packed with bullish buyers and offside hedge funds READY TO SEND IT HIGHER. 🚀📈
Not to mention the last time we had this level of above average volume for this long was in October 2023 when we were coming out of a bear market and it was only the beginning of our ascent higher!
I'm not saying we can't have a pullback soon...I'm just simply saying the volume is here and it looks like dips will indeed be shallow.
ATH retest INBOUND!
Are you positioned for the move? 👀
AMEX:SPY NASDAQ:QQQ

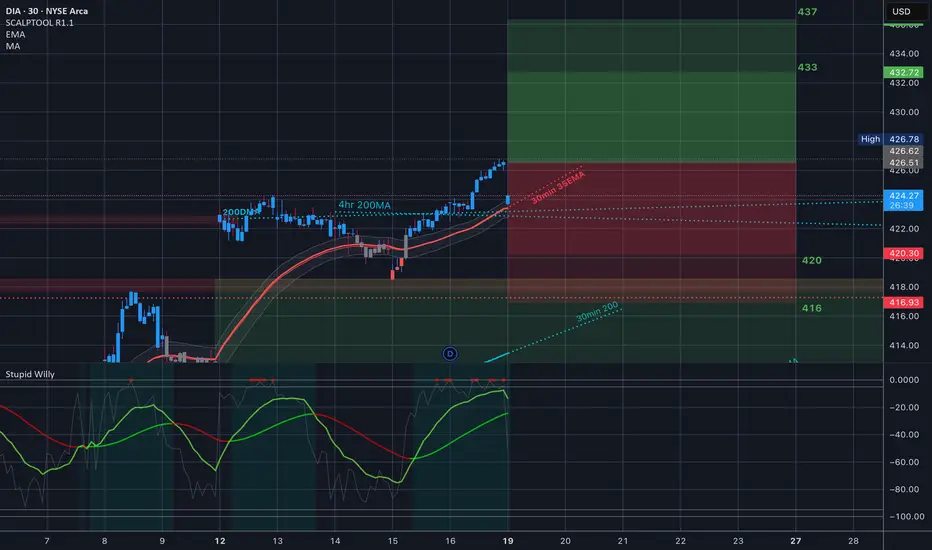
$DIA // May 19 2026 // Analysis & Targets for Day TradersAMEX:DIA // May 19 2026 // Analysis & Targets for Day Traders
$IWM // May 19 2026 // Analysis & Targets for Day TradersAMEX:IWM // May 19 2026 // Analysis & Targets for Day Traders

$QQQ // May 19 2026 // Analysis & Targets for Day TradersNASDAQ:QQQ // May 19 2026 // Analysis & Targets for Day Traders

$SPY // May 19 2026 // Analysis & Targets for Day TradersAMEX:SPY // May 19 2026 // Analysis & Targets for Day Traders
Let's see if the downgrade respects where options closed on Friday

SPY/QQQ Plan Your Trade For 5-19 : Gap Breakaway In Trend ModeToday's pattern suggests the SPY/QQQ will start with an opening price GAP (downward in this case) and could continue to move into a Breakaway pattern.
Given the recent news of a US Credit Downgrade, I'm suggesting all traders prepare for what may become a period of sideways price volatility over the next 3-5+ days.
I've highlighted a potential breakdown range on the SPY/QQQ on my charts that I believe acts as a solid confirmation level related to any potential reversal/breakdown in trend.
Currently, the trend is still BULLISH. If price falls below my breakdown range (the angled rectangle on my charts) - then I believe price will have broken this upward FLAGGING trend channel and will begin to move downward - targeting lower support levels.
This is a critical time for the markets. If we fail to move higher at these levels, we have a long way to go (downward) before we attempt to find any support.
Gold and Silver appear to be attempting to break the FLAG HIGH of an Inverted Excess Phase Peak pattern. This could prompt a strong rally phase back above $3300/$33 for Gold/Silver over the next few days. Time will tell how things play out.
BTCUSD appears to be REJECTING the recent highs within a consolidation range. If this rejection continues, I see BTCUSD moving downward - trying to reach the $95k (or lower) looking for support.
Remember, we are still generally BULLISH and moving upward within the FLAGGING channel. If we do get a breakdown in price over the next few days, it will become clearly evident on the charts and we'll have to begin to change our expectations.
Right now - HEDGE.
Get Some...
#trading #research #investing #tradingalgos #tradingsignals #cycles #fibonacci #elliotwave #modelingsystems #stocks #bitcoin #btcusd #cryptos #spy #gold #nq #investing #trading #spytrading #spymarket #tradingmarket #stockmarket #silver

SMH watch $212.82 above 209.43 below: Proven zone to form Trend SMH showing the recovery process of the chip sector.
Now testing a well proven zone defined by major fibs.
Golden Genesis fib at $209.43 and Covid fib at $212.82.
Look for a Break-and-Retest a Rejection.
If rejected, look for support at $191.23/85
===================================================
.

Europe’s Center is CRUMBLING: VGK on the Brink? 🚨 Europe’s Center is CRUMBLING: VGK on the Brink? 🚨
Europe’s elections just lit a FUSE! 💥 Poland (May 18), Portugal (May 18), and Romania (May 4 & 18) held off populists, but the center’s hanging by a thread—50% in Poland went right-wing, Portugal’s Chega is shaking things up.
Immigration and globalization fury could rattle EU trade & policy. 📉 VGK ($75.53) is inches from its yearly high ($75.56)—ready to crash or soar?
💡 Trade Idea: Plot VGK price action with election dates (May 4, May 18, June 1, 2025) to spot volatility breakouts. Watch for support near $70 or resistance at $76.
❓ Your Move? Will VGK tank or rally on Europe’s chaos? Drop your trade below! 👇

SPY | RANGE TRADE | Dark Pool Activity | (May 19, 2025)SPY | RANGE TRADE | Dark Pool Activity + Structural Shift | (May 19, 2025)
1️⃣ Insight Summary:
SPX is still trading near a key sell zone, and recent dark pool activity suggests a possible shift in market structure. A correction from here wouldn’t be surprising.
2️⃣ Trade Parameters:
Bias: Neutral with Short Bias
Entry Zone: Watching current highs as a potential area to fade
Stop Loss: Above recent highs (tight and reactive)
TP1/TP2: Targeting lower support zones if correction unfolds
Alternative Setup: If support holds and structure flips, I may look for reactive longs
3️⃣ Key Notes:
✅ Notable dark pool prints showed up on Thursday, indicating potential distribution — this has changed how I view the market structure
✅ I’m preparing for a “sell the highs, buy the lows” scenario inside the current range
❌ A clean breakout above the current resistance zone would invalidate the short bias
💡 I’ve outlined both long and short scenarios — it's all about reacting to what price gives us
4️⃣ Follow-up Note:
If things start moving sharply, I’ll post an update with chart visuals and refined zones. Also, let me know if you'd like my dual-path trade planning template — it’s great for these types of setups.
Please LIKE 👍, FOLLOW ✅, SHARE 🙌 and COMMENT ✍ if you enjoy this idea! Also share your ideas and charts in the comments section below! This is best way to keep it relevant, support us, keep the content here free and allow the idea to reach as many people as possible.
Disclaimer: This is not a financial advise. Always conduct your own research. This content may include enhancements made using AI.

Vanguard Mega Cap Growth ETF (MGK): FAQ guide before investing🚀 Vanguard Mega Cap Growth ETF (MGK): A Deep Dive into Holdings and Hypothetical Returns
🌟 The Vanguard Mega Cap Growth ETF (MGK) is a popular exchange-traded fund offering investors access to some of the largest and most dynamic growth-oriented companies in the U.S. market. MGK closely tracks the CRSP US Mega Cap Growth Index, emphasizing mega-cap stocks.
🎯 Key Features of MGK
💰 Expense Ratio: 0.07%, a cost-effective choice for investors.
📊 Assets Under Management: Around $25.42 billion.
💵 Dividend Yield: 0.44%, distributed quarterly.
🏆 Top Holdings:
🍎 Apple Inc. (AAPL): 14.34%
🖥️ Microsoft Corp. (MSFT): 11.93%
🎮 NVIDIA Corp. (NVDA): 10.70%
📦 Amazon.com Inc. (AMZN): 7.63%
📱 Meta Platforms Inc. (META): 4.33%
🔌 Broadcom Inc. (AVGO): 3.54%
🚗 Tesla Inc. (TSLA): 3.22%
💊 Eli Lilly and Co. (LLY): 3.20%
💳 Visa Inc. (V): 2.76%
🔍 Alphabet Inc. (GOOGL): 2.31%
📌 Sector Allocation:
💻 Technology: ~52.8%
🛒 Consumer Discretionary: 15.9%
📡 Communication Services: 11.0%
📈 Performance Overview
MGK has consistently demonstrated strong returns:
🗓️ Year-to-Date (YTD): 0.96%
📅 1-Year Return: ~21.09%
📆 3-Year Return: ~23.26%
📊 5-Year Return: ~19.26%
💸 Hypothetical Investment Scenarios
Assuming an average annual return of 19.26%, here's how various investments might grow over five years:
💲 $10,000 Investment:
Year 1: $11,926
Year 2: $14,219
Year 3: $16,951
Year 4: $20,207
Year 5: $24,070
💲 $100,000 Investment:
Year 1: $119,260
Year 2: $142,190
Year 3: $169,510
Year 4: $202,070
Year 5: $240,700
💲 $1,000,000 Investment:
Year 1: $1,192,600
Year 2: $1,421,900
Year 3: $1,695,100
Year 4: $2,020,700
Year 5: $2,407,000
⚠️ Note: These returns are hypothetical and assume consistent annual performance, which may not reflect actual market volatility.
🔑 Considerations for Investors
🎯 Concentration Risk: MGK heavily invests in technology and a few major stocks, tying its success closely to these specific companies.
📉 Market Volatility: Although historically strong, MGK can be highly volatile, particularly during tech-sector downturns.
📈 Long-Term Growth: Ideal for investors seeking significant long-term capital appreciation through prominent U.S. growth firms.
📌 In Summary: MGK provides focused exposure to U.S. mega-cap growth stocks with a strong track record. Investors should consider portfolio diversification carefully due to its sector concentration.

S&P500 2022 into the Bear Market. Same Pattern 2025In 2022, before the bear market began, we saw the same pattern that we're seeing now:
1. Sine wave pattern
2. Fake recovery
3. Break above the sine wave top
4. Sharp decline
Last week, right after the sine wave top was broken, U.S. bonds were downgraded AFTER OFFICIAL MARKET SESSION!
It’s no surprise that rating agencies are losing confidence in the U.S. government's ability to repay its debts.
Just look at the rising interest payments — if that’s not a wake-up call, I don’t know what is. 😕
I don’t live in the U.S., but I’m genuinely concerned that a collapse — which now seems nearly inevitable — will impact the entire world.
Going long in U.S. markets under these technical and fundamental conditions? Putting all your eggs back into that basket? Really?
I hope this gives some perspective.
Trade safely, trade small, and keep your risks minimal.

Spy Road To?Weekly Thesis for SPY
Weekly High: $594.50
Weekly Low: $589.28
Weekly Close: $594.20
52-Week Range: $481.80 – $613.23
Critical Breakdown Level: 581
Why 581 matters:
It sits well below S₃ (585.60) and aligns closely with the 38.2% Fibonacci retracement of the past four-week swing (High 594.50 → Low 566.76), which calculates to roughly 581.10.
A decisive weekly close below 581 would breach both pivot-derived supports and this Fibonacci zone, opening the door to deeper pullbacks toward the May 9 low near $564.34
Potential Sell-Wall at 604
Why 604 is a resistance cluster:
It sits just above R₃ (601.26), a confluence of weekly pivot resistance and likely profit-taking levels.
A series of limit orders tend to cluster near these round-number extensions, forming a “sell wall” that may cap any rally unless broken on strong volume.
4. Strategy & Outlook
Caution advised: SPY must hold above 581 on a weekly close basis. A failure to do so would invalidate the recent up-move and likely lead to a test of lower support zones around 587 and 585, then potentially the mid-560s.
Bullish breakout: Only a sustained weekly close above 604—ideally on above-average volume—would signal renewed upside conviction and pave the way toward the 52-week high at $613+.
Action plan:
Wait for confirmation – don’t enter new longs until either 581 holds convincingly or 604 is cleared.
Use tight risk controls – if deploying swing trades, place stops just below 581 for longs or just above 604 for shorts.
Monitor volume – validate any breakout/breakdown with volume spikes to confirm institutional participation.
Im Waiting On Confirmation as Always Safe Trades & JoeWtrades

Equities VS Bonds, why the current divergence?Introduction: should we finally go back to buying bonds? While the equity market has rebounded vertically since mid-April and the start of a period of trade diplomacy between the USA and its main trading partners, bond prices have remained at a low level.
Although both realized and implied volatility have fallen sharply in recent weeks (see our bearish analysis of the VIX at the end of April), how can we explain such a divergence between the recovery in US stock prices and a bond price still at the bottom?
For bonds, is this an opportunity to position at an attractive price?
1) First of all, take a look at the two charts below, which show the underlying trend and the recent trend of the S&P 500 (for the equities market) and the 20-year US interest rate contract (to represent the bond market)
Chart showing weekly Japanese candlesticks on the S&P 500 future contract
Graph showing monthly Japanese candlesticks on the US 20-year bond contract
2) The reasons for the outperformance of equities versus bonds are numerous and fundamental
The underperformance of bonds versus equities is based on a combination of fundamental factors:
- Firstly, corporate profit forecasts remain optimistic for the next 12 months, creating a favorable arbitrage for the equity market (see our previous analysis of the S&P 500 index).
- The Federal Reserve's (FED) intransigence in the face of the risk of a rebound in inflation against the backdrop of the trade war. The market does not expect a resumption of the US federal funds rate cut before the monetary policy decision on Wednesday September 17. The inverted correlation between interest rates and bond prices is therefore a factor putting pressure on prices.
- Beyond monetary policy, the United States' fiscal trajectory is also a topic of debate. The Republican bill to massively lower taxes could further deepen the federal deficit and add to an already colossal public debt, keeping long-term interest rates high. All the more so since, according to the Peterson Foundation, nearly $9.3 trillion in debt will mature over the next 12 months, adding to the estimated $2 trillion in deficit financing needs.
- The new all-time high in global liquidity is creating a favorable arbitrage for risky assets in the stock market, due to the positive long-term correlation between the S&P 500 index and global liquidity
3) Even so, current bond prices are in a technical zone of long-term interest, and forward-looking fundamentals could allow bonds to rebound in the coming months
The latest macroeconomic indicators confirm a loss of momentum in the US economy. In April, producer prices suffered their sharpest contraction in five years, suggesting that companies are absorbing some of the higher costs associated with trade tensions. At the same time, retail sales stalled, as consumers cut back on purchases in the face of persistent inflation on imported goods. If confirmed, these signs of a slowdown could lead to a “flight to quality” phenomenon, i.e. arbitrage in favor of the bond market over the coming months.
The chart below is a reminder that the US bond market is currently at a major technical support level.
DISCLAIMER:
This content is intended for individuals who are familiar with financial markets and instruments and is for information purposes only. The presented idea (including market commentary, market data and observations) is not a work product of any research department of Swissquote or its affiliates. This material is intended to highlight market action and does not constitute investment, legal or tax advice. If you are a retail investor or lack experience in trading complex financial products, it is advisable to seek professional advice from licensed advisor before making any financial decisions.
This content is not intended to manipulate the market or encourage any specific financial behavior.
Swissquote makes no representation or warranty as to the quality, completeness, accuracy, comprehensiveness or non-infringement of such content. The views expressed are those of the consultant and are provided for educational purposes only. Any information provided relating to a product or market should not be construed as recommending an investment strategy or transaction. Past performance is not a guarantee of future results.
Swissquote and its employees and representatives shall in no event be held liable for any damages or losses arising directly or indirectly from decisions made on the basis of this content.
The use of any third-party brands or trademarks is for information only and does not imply endorsement by Swissquote, or that the trademark owner has authorised Swissquote to promote its products or services.
Swissquote is the marketing brand for the activities of Swissquote Bank Ltd (Switzerland) regulated by FINMA, Swissquote Capital Markets Limited regulated by CySEC (Cyprus), Swissquote Bank Europe SA (Luxembourg) regulated by the CSSF, Swissquote Ltd (UK) regulated by the FCA, Swissquote Financial Services (Malta) Ltd regulated by the Malta Financial Services Authority, Swissquote MEA Ltd. (UAE) regulated by the Dubai Financial Services Authority, Swissquote Pte Ltd (Singapore) regulated by the Monetary Authority of Singapore, Swissquote Asia Limited (Hong Kong) licensed by the Hong Kong Securities and Futures Commission (SFC) and Swissquote South Africa (Pty) Ltd supervised by the FSCA.
Products and services of Swissquote are only intended for those permitted to receive them under local law.
All investments carry a degree of risk. The risk of loss in trading or holding financial instruments can be substantial. The value of financial instruments, including but not limited to stocks, bonds, cryptocurrencies, and other assets, can fluctuate both upwards and downwards. There is a significant risk of financial loss when buying, selling, holding, staking, or investing in these instruments. SQBE makes no recommendations regarding any specific investment, transaction, or the use of any particular investment strategy.
CFDs are complex instruments and come with a high risk of losing money rapidly due to leverage. The vast majority of retail client accounts suffer capital losses when trading in CFDs. You should consider whether you understand how CFDs work and whether you can afford to take the high risk of losing your money.
Digital Assets are unregulated in most countries and consumer protection rules may not apply. As highly volatile speculative investments, Digital Assets are not suitable for investors without a high-risk tolerance. Make sure you understand each Digital Asset before you trade.
Cryptocurrencies are not considered legal tender in some jurisdictions and are subject to regulatory uncertainties.
The use of Internet-based systems can involve high risks, including, but not limited to, fraud, cyber-attacks, network and communication failures, as well as identity theft and phishing attacks related to crypto-assets.

Weekly $SPY / $SPX Scenarios for May 19–23, 2025🔮 Weekly AMEX:SPY / SP:SPX Scenarios for May 19–23, 2025 🔮
🌍 Market-Moving News 🌍
📉 Moody's Downgrades U.S. Credit Rating
Moody's has downgraded the U.S. sovereign credit rating from Aaa to Aa1, citing concerns over rising national debt and interest payment ratios. This move aligns Moody's with previous downgrades by Fitch and S&P Global, potentially impacting investor sentiment and increasing market volatility.
🛍️ Retail Earnings in Focus
Major U.S. retailers, including Home Depot ( NYSE:HD ), Lowe’s ( NYSE:LOW ), Target ( NYSE:TGT ), TJX Companies ( NYSE:TJX ), Ross Stores ( NASDAQ:ROST ), and Ralph Lauren ( NYSE:RL ), are set to report earnings this week. Investors will be closely monitoring these reports for insights into consumer spending patterns amid ongoing tariff concerns.
💬 Federal Reserve Officials Scheduled to Speak
Several Federal Reserve officials, including Governor Michelle Bowman and New York Fed President John Williams, are scheduled to speak this week. Their remarks will be scrutinized for indications of future monetary policy directions, especially in light of recent economic data and market developments.
📊 Key Data Releases 📊
📅 Monday, May 19:
8:30 AM ET: Federal Reserve Bank of Atlanta President Raphael Bostic speaks.
8:45 AM ET: Federal Reserve Vice Chair Philip Jefferson and New York Fed President John Williams speak.
10:00 AM ET: U.S. Leading Economic Indicators for April.
📅 Tuesday, May 20:
8:30 AM ET: Building Permits and Housing Starts for April.
10:00 AM ET: Federal Reserve Bank of Minneapolis President Neel Kashkari speaks.
📅 Wednesday, May 21:
10:00 AM ET: Existing Home Sales for April.
10:30 AM ET: EIA Crude Oil Inventory Report.
📅 Thursday, May 22:
8:30 AM ET: Initial Jobless Claims.
9:45 AM ET: S&P Global Flash U.S. Manufacturing and Services PMI for May.
📅 Friday, May 23:
10:00 AM ET: New Home Sales for April.
⚠️ Disclaimer:
This information is for educational and informational purposes only and should not be construed as financial advice. Always consult a licensed financial advisor before making investment decisions.
📌 #trading #stockmarket #economy #news #trendtao #charting #technicalanalysis

Junior bees.. etf of nifty next 50 indexBreakout seen on both index and etf.. more confirmation with increasing volume and price moving above the breakout candle... life long or generations bet.. can add more on pull backs or whenever you have cash

$SPY Daily Chart Taz Plan - May 2025 into June-July Breakdown📉 SPY Daily Chart Trading Plan — May 2025
Thesis:
Price has returned to the exact level ($594.20) where the February impulse breakdown began. This zone is acting as a Lower High rejection within a broader bearish structure. A clean rejection here opens the door to multiple inefficiency fills below.
🔍 Structure Breakdown:
Feb High (ATH): $613.23
Feb Open: $592.67
Feb Close (last green candle before impulse): $594.20
Current Price: $594.20
Marked LH: $592.50
This is a rally back into rejection, not strength.
📉 Key Zones & Gaps:
🔺 Gap Supply: $566.48 – $578.50
🔺 Wick Gap: $558 – $566 → Needs a full-body candle to initiate fill
🟥 FVG (4/22): $528 – $541.52
🧱 Major Support: $481.80
🧠 Trade Plan:
Short Entry 1 (Confirmation-Based):
🔻 Red candle rejection under $592.50 = starter short
🔻 Watch RSI and MACD for momentum fade
Short Entry 2 (Gap Breach):
🔻 If $578 is broken and retested → scale in
🔻 Gap fill expected quickly once triggered
Short Entry 3 (Wick Gap):
🔻 Body close through $558 = last add
🔻 Sets up for final flush to FVG
🎯 Targets:
$578.50 → $566.48 (Gap Fill)
$558 → $541.52 (Wick Gap & FVG Top)
$528 – $530 (FVG Close)
$481.80 (Long-Term Panic Target)
❌ Invalidation:
Daily close > $595.50 = Pause thesis
Weekly close > $600 = Structural shift, short squeeze zone
🧠 Final Thoughts:
This isn’t just a gap fill play — it’s a structural fade from a lower high back into memory. The Feb impulse wave left behind layers of inefficiency, and price just tapped the origin of the breakdown.
Momentum is peaking. If this is a trap, the downside should begin immediately.
Let the chart prove it.

US Downgrade, 3-5-10% Pullbacks But Still Bullish on S&PHappy Sunday!!!
US Futures open lower after Friday's close and Moody's downgrade.
Last time this occurred in 2011, the S&P dropped around 10% from the "news."
This is all interesting timing but I'm still liking pullbacks for opportunities to position
bullish in the US indexes (S&P, Nasdaq, Dow)
Because the melt-up continues to run (US/China gap last week and drift higher), I'm trying to stay patient for a pause or pullback
Trump and Bessent are still chirping about Tariffs and a government "detox" so a round of trade war related news may help calm the market's red hot advance post April 7 lows
I'm selling calls on owned positions for income. I'm waiting for more favorable levels to add new positions, but within 3-4% of all time highs for the S&P and Nasdaq I don't think anybody will be surprised to see the all-time highs revisited in the near to medium-term
Let's have a great week - thanks for watching!!!
-Chris Pulver

SPY: short term pullback after credit downgrade? In this video we talk about what's next for the coming week in the S&P 500, given how we could be setting up for a short term pullback

SPY: Week of May 18Hey everyone,
Here are my thoughts on SPY.
Hope you all have a great rest of your weekend and safe trades next week!

SPY WEEKLY 19TH-23RD MAY 2025Welcome to Spy weekly. I have tried to explain the price action & all-important levels in the best possible way but still if you have doubts then feel free to leave a comment below.
NOTE: WE ARE IN BULL RUN

SPY volatility this weekI'm posting the rest of the readings I did for each week this month on SPY. This week I'm expecting a drop into Wed. I get all my info from dowsing, btw.
I noticed all last week it kept suggesting to sell rallies, which makes me thing we're going to pull back. The weekly (done at the beginning of the month) did suggest over 5% down this week. But my dowsing now says to watch for a bounce Wed. with a look below & fail. Move up to some extent Wed. & reverse down Thursday (implies gap up or some up). Then Friday up. Short term watching the $575 area for the bounce or resumption of trend.
Next week's reading of down more is a bit of a head scratcher, so that's why I think things could just be really volatile.
Low on QQQ I'm looking for is 498.

I was early, but not wrong - 571 target still standsHello Traders,
We can clearly see a top signal as SPY has started to play out a bearish divergence at the 594 level. The 594 level seemed to fade during after hours upon the announcement of Moody's US credit downgrade as the price sliced through the 590 level all the way down to 588.
I believe the price will rapidly cascade down sub 580, down to 571 Monday - Tuesday. The gap fill is at 565.13. The gap fill level is too obvious, therefore I would be surprised if the price perfectly reversed (although, expect a reaction at this level).
My target for this downturn is 561.63, which is the 38.2% fib level, as low as 551.48.
This would offer a great pullback and buying opportunity for the long term, for the bullish case.
I personally believe that the stock market won't make all time highs, but does not mean I will miss out on bullish opportunities, if the trend does truly reverse.
As always, we will have to see what Monday brings us.
