Stock Market Forecast | TSLA NVDA AAPL AMZN META MSFTStock Market Forecast | CME_MINI:NQ1! NASDAQ:QQQ AMEX:SPY CME_MINI:ES1!
Mag 7 Forecast | TSLA NVDA AAPL AMZN META MSFT GOOGL
ETF market

Pullback before higher ? Just looking at a break under from previous lows now that we are back over it right now. 515-505

SPY LongNo need to discuss fundamentals here since it is THE SPY.
Very good entry for beginners or swing traders.
clean reversal patter.
You can keep SL a bit lower if you have appetite

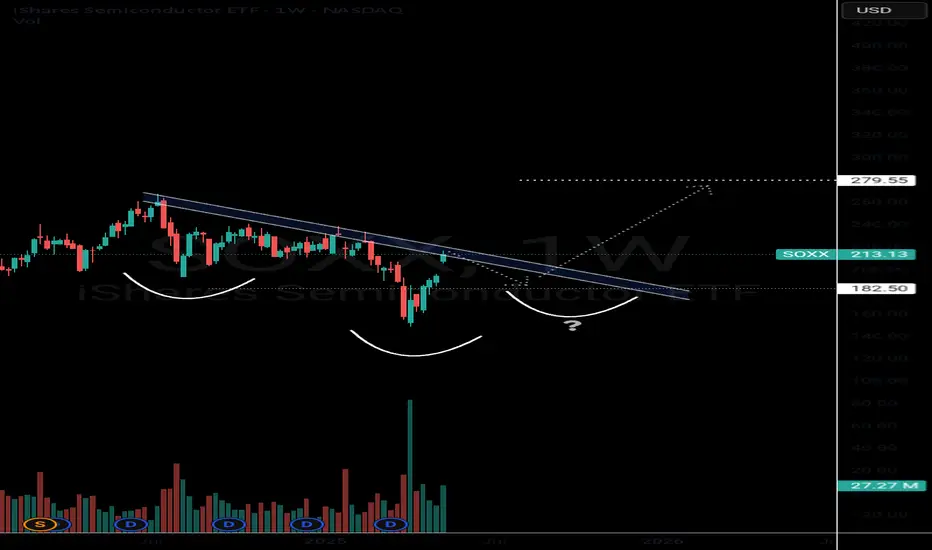
Bullish Semiconductors? SOXX The semiconductors NASDAQ:SOXX definitely tend to lead the market In bull rallies. I still think this saying will hold true for several years.
The NASDAQ:SOXX is flirting with some pretty decent resistance. This would be a perfect spot for sellers to exit and price action to digest recent gains.
If the chart plays out like I think it will, we should have a decent pullback in this area which could create an epic inverse head right shoulder. This pattern would be a very bullish setup that could take us into new All Time Highs in 2026.
This is a weekly pattern so allow the chart some tike to play out.
Ukraine War and Prospects for PeaceThe ongoing war in Ukraine, now entering its fourth year of full-scale conflict, continues to reshape geopolitical risk and investment decisions globally. For investors, the challenge is to manage the asymmetric risks of a protracted war while remaining positioned for a potential peace dividend. Drawing on conflict research and historical cases, this article presents two complementary investment strategies: one aligned with a possible de-escalation or ceasefire in the next 12–24 months, the other designed to hedge against continued instability or escalation.
Peace Positioning Strategy (Base Case)
Should the war move toward de-escalation in 2025 or 2026, certain sectors are likely to outperform significantly. Infrastructure and construction companies such as Caterpillar, Vinci, Strabag or Heidelberg Materials could benefit from post-war rebuilding and logistics modernization in Eastern Europe. Industrial stocks like BASF or ArcelorMittal may rise on improved regional trade flows and demand for building materials. Banks with exposure to Eastern Europe, such as Raiffeisen or OTP Bank, could experience re-ratings as sovereign risks decline and local loan activity revives. Agricultural machinery firms like John Deere or fertilizer producers like Nutrien and Yara may also see tailwinds due to renewed agricultural exports from Ukraine and surrounding regions.
To access these themes efficiently, investors can consider ETFs such as the iShares MSCI Eastern Europe Capped ETF (if reintroduced), the SPDR S&P International Industrial ETF (IPN), or the Xtrackers MSCI EMEA Infrastructure ETF. These vehicles provide diversified exposure to peace-leveraged equities. A hypothetical future ETF focused on Ukraine reconstruction could offer very high upside, but it does not yet exist.
Target returns in this peace scenario are estimated between 20–35% over a 12–24 month horizon, with defined stop-loss levels between -10% and -15% to protect capital. For example, a position in an infrastructure ETF might have a target of +30% with a stop-loss at -15%. For bank or material stocks, upside could reach +50% in select cases, though volatility remains high.
Hedging Against Conflict (Risk Scenario)
If the conflict persists or escalates further into 2026 or beyond, portfolios must remain resilient against commodity shocks, defense spending surges, and persistent volatility. Defense contractors such as Rheinmetall, BAE Systems, or Lockheed Martin may benefit from increased military expenditures in Europe and the U.S. Energy majors like Shell, Equinor, or Chevron may profit from renewed pressure on energy supply chains.
In terms of ETF hedges, the iShares U.S. Aerospace & Defense ETF (ITA) and the Invesco DB Commodity Index ETF (DBC) offer exposure to global defense and broad commodities, respectively. Precious metals—especially gold—remain core hedging instruments, either through direct holdings or via ETFs like Xetra-Gold or the VanEck Gold Miners ETF (GDX), which tracks miners such as Barrick Gold and Newmont.
Expected returns in this defensive strategy range from +10% to +25% over the same 12–24 month period, depending on the asset. Defense equities may return up to +40% under sustained geopolitical tensions. A stop-loss discipline remains critical here as well, generally set tighter (e.g., -10% to -12%) due to high volatility and potential news-driven reversals.
Portfolio Allocation Suggestion
Investors may consider a split allocation, combining peace-beneficiary assets with defensive hedges and a tactical cash buffer. For example, a portfolio of €10,000 could allocate €4,000 toward peace-aligned themes (such as infrastructure ETFs or Eastern European banks), €2,500 in defense or energy hedges (e.g., ITA, oil stocks), €1,500 in gold or gold miners (e.g., Xetra-Gold or GDX), €1,000 in commodity broad hedges (e.g., DBC), and €1,000 held in cash for flexibility or drawdown buying.
This approach offers diversification across geopolitical scenarios and maintains optionality in a rapidly evolving environment.
Return Outlook and Scenarios
In a peace or ceasefire scenario, portfolio returns could reach +18% to +30% over 12–24 months, driven by sector re-ratings and reconstruction optimism. In a baseline stalemate scenario, returns are expected to be more muted, in the +5% to +10% range, as defensive positions offset lackluster peace exposure. In the case of renewed escalation, select hedges (defense, energy, gold) could still generate +10% to +15%, while broader risk assets may suffer losses of -5% or more.
Risks to Monitor
Major risks include premature positioning for peace that fails to materialize, overexposure to volatile frontier assets, and policy-driven shocks such as expanded sanctions or regional energy disruptions. Tactical flexibility and strict risk management (via stop-losses and position sizing) are essential in both scenarios.
Disclaimer
This article is provided for informational and educational purposes only and does not constitute investment advice, a solicitation, or an offer to buy or sell any securities. All investments involve risk, including possible loss of capital. The views expressed are those of the author and do not reflect the official policy or position of any institution. Forecasts, targets, and projections are based on current market conditions and subject to change without notice. Readers are advised to consult with a licensed financial advisor before making investment decisions. ETFs, stocks, and instruments mentioned are for illustrative purposes only.


SPY Breakdown – May 16, 2025📉 SPY Breakdown – May 16, 2025
Posted by ThePlotThickens
We’re hitting resistance at the top of this price channel, and I think we drop to 585-587 tomorrow. I believe the market has topped for now.
Most of the market looks weak, overbought tapping resistance walls, except for the big tech names that just keep running (especially chip stocks — total madness. Endless speculative market cap for chips lol). But overall, it feels like things are starting to slow down, not dumpy per se.
👉 Key Levels:
We’re right at the bottom of the Feb 2–5 weekly candle, when the Trump tariffs were dropped. This is a major support zone, and a lot of traders are watching it. Also, a quick reminder — weekly candles are super important right now. They show the bigger trend and are way more reliable than just looking at daily moves.
We might still tap the low of this week’s candle, but I believe 575 is the real line in the sand. That level marked the start of our bull run. As long as we stay above it, the long-term trend still looks strong.
💸 Short-term outlook:
I expect profit-taking tomorrow — probably a red day. Even if Trump tweets again, I doubt it does much unless he removes all tariffs (which would be wild). It took 6 weeks to get here.
📌 My main point:
Keep your eyes on 575 support. If we close the weekly candle above that, bulls are still in control. That’s the psychological level most traders are watching. If we drop below, we could revisit lower zones before trying to go higher again.
🔴 Channel Resistance at the top — The “toppy” zone where price is struggling.
🟠 Short-term target at 583-585 — Where you expect a drop.
🟢 Major Support at 575 — The key psychological and technical level.
🔴 Watch Zone below 575 — Where bulls could lose momentum.

Opening (IRA): SMH July 18th 205 Short Put... for a 2.21 credit.
Comments: Doing some higher IV premium-selling in the ETF space, targeting the <16 delta strike paying around 1% of the strike price in credit.
Will look to add at intervals if I can get in at strikes better than what I currently have on ... .

Opening (IRA): SPY September 19th 510 Short Put... for a 5.21 credit.
Comments: Laddering out, targeting the <16 delta strike paying around 1% of the strike price in credit.
Still looking to add in shorter intervals at strikes better than what I have on, but we've been in a grind-up ... .

Opening (IRA): SPY June 20th 490 Short Put... for a 5.26 credit.
Comments: Targeting the strike that is both at 16 delta or below and that is paying 1% of the strike price in credit ... .
Metrics:
Buying Power Effect/Break Even: 484.72
Max Profit: 5.26
ROC at Max: 1.09%
Will generally look to ladder out at intervals, assuming I can get in at prices better than what I currently have on, roll out at 50% max ... .

IWM: Let's see we get this position :D I won't celebrate early, but I will be cautious, and watchout for the trap. The sell is set at 10:30. I Have $100 backup might go all in today.

SPY Charging Toward $593? JoeWTrades AlphaPulse Says YES.
After-hours we’re sitting at $573, and the AlphaPulse Momentum Suite just fired a major dual-confirmation breakout signal.
Here’s why $593 is in reach within 2 weeks:
Technical Backing:
RSI (14): 72 — strong bullish continuation without divergence.
MACD (Fast/Slow): Fresh bullish crossover with expanding histogram = momentum ignition.
Squeeze Pro Indicator: Just released from squeeze with explosive green bars.
Volume Surge: Smart money accumulation above $568 on aggressive volume.
Fibonacci Extension (1.618): Maps to $593–$595 from prior leg ($543 → $573).
Gamma Pressure Zone: $570–$580 shows extreme call OI buildup — market makers likely to push through.
Max Pain: Below spot (at $565) = upward pressure through weekly expiration.
AlphaPulse Signals Fired:
"💎 Run Mode: SPY - Confirmed"
"🔥 High IV Zone Breakout - Validated"
"🚀 Aggressive Entry at $572 Triggered"
Target: $593
Stop: $567
Watch for confirmation above: $576 daily close.
Timing Window: 7–10 trading days.
Fyi my first T/P is $584
and as always safe trades and JoeWtrades

SPY Daily Update 5/16/25Here is your daily update on SPY via analyzing Cumulative Delta Volume (CDV), divergence between price and the Money Flow Index (MFI), and the 4h and D McGinley Moving Averages!
Happy trading, and I hope the video was helpful!


I am betting big on this. Let's see what we get. My Ai is not working right now so working. I don't know how to explain but I see the double top structure forming there. Maybe we see a pump today?

Bitwise Bitcoin ETF | BITB | Long at $46.25It definitely should get everyone's attention when a US Senator (David McCormick) is willing to dish out up to $600,000 in a Bitcoin ETF ( AMEX:BITB ):
Feb. 27: Bought $50,000 to $100,000
Feb. 28: Bought $15,000 to $50,000
March 3: Bought $50,000 to $100,000
March 5: Bought $15,000 to $50,000
March 10: Bought $50,000 to $100,000
March 11: Bought $15,000 to $50,000
March 13: Bought $15,000 to $50,000
March 20: Bought $50,000 to $100,000
Something may be brewing this year with the "U.S. crypto reserve" and I'll throw down a couple grand at $46.25 with a self-proclaimed wild prediction into 2026: Bitcoin to $120,000.
Bitwise ETF Targets:
$50.00
$55.00
$60.00
$65.00

SPY Breakout Watch: Triangle Pressure Builds Above 590SPY has surged in a strong V-shaped recovery from the March low of ~480 to testing major resistance around 595–600. The daily chart shows sustained higher highs and higher lows, but price now stalls at a key supply zone with multiple doji candles—signaling indecision. A rising trendline provides strong support near 570.
Zooming into the 60-minute chart, SPY forms an ascending triangle with flat resistance at 590 and rising support from 584. Volume contraction suggests accumulation, priming a potential breakout. A 60-min close above 590 targets 596, with a stop under 588.
On the 15-minute timeframe, bull-flags form frequently after morning gaps, with breakouts typically launching 4–5 points higher. VWAP and the 20-MA converge near 588.5, making it an ideal pullback entry zone.
Strategy for May 19–23:
Long on a clean breakout above 590 (target: 594–596)
Stop under 587.5–588
Caution if daily closes below 570
Expect early-week upside tests of 590–594, followed by a potential breakout toward 595–600. If a high-volume rejection occurs near that zone, a quick scalp-short may be in play.

$DIA // May 16 2026 // Analysis & Targets for Day TradersAMEX:DIA // May 16 2026 // Analysis & Targets for Day Traders
This is for the May 16th expiration. Have a great weekend guys. 🙌🏼

$IWM // May 16 2026 // Analysis & Targets for Day TradersAMEX:IWM // May 16 2026 // Analysis & Targets for Day Traders
This is for the May 16th contract.
Full Walkthrough on this mornings video

$QQQ // May 16 2026 // Analysis & Targets for Day TradersNASDAQ:QQQ // May 16 2026 // Analysis & Targets for Day Traders
This is for the May 16th 2025 contract

$SPY Analysis, Key Levels & Targets for Options & Day TradersAMEX:SPY Analysis, Key Levels & Targets for Options & Day Traders
This is for the Friday May 16th Contract. Full Walkthrough and Strategy plays on today's video.

IAU eyes on $63.29: Golden Genesis fib may have been the TOPIAU showing signs of a topping along with Gold.
Currently orbiting a Golden Genesis at $63.69
Trajectory points to sister Genesis at $58.68

SPY/QQQ Plan Your Trade For 5-16 : Gap Potential PatternToday's pattern suggests the SPY will attempt to GAP at the open. The current price structure suggests the SPY/QQQ are in an upward FLAGGING formation related to a broad Excess Phase Peak pattern. I believe this upward trend will continue until price attempts to break either the upper previous Ultimate High pattern or break the lower channel of the current FLAGGING formation.
The wonderful thing about these Excess Phase Peak patterns, and other techniques I'm trying to teach you, is that they provide very clear triggers/directions/opportunities for traders who understand these patterns.
Today, I highlight my SPY Bias (Primary & Secondary) trending system that shows the SPY is much weaker than many people believe. Because of this, I believe we are potentially nearing an Exhaustion Peak in the SPY/QQQ - time will tell.
The use of my extended Biasing systems and Custom Index charts helps me understand what is taking place behind the SPY/QQQ price action. It's like peaking behind the curtains in terms of what my Custom Indexes and other specialized data can provide. I can see what is really taking place related to price action - moving beyond the simple SPY/QQQ charts.
Gold and Silver appear to be setting up an Inverted Excess Phase Peak pattern off a potential Ultimate Low in price. It will be interesting to see how this downward price flag plays out over the next week+. If this pattern holds, we should see the FLAG end and price should rally up into the consolidation phase. Very exciting for metals.
Bitcoin, which tends to lead the SPY/QQQ, is stalling near a peak. Keep your eyes on BTCUSD over the weekend as I believe we may be able to identify how the SPY/QQQ will react on Monday by watching what BTCUSD does.
Thanks for being patient and understanding my schedule over the past 30+ days. I've had multiple family member visit the hospital over the past 5-6+ weeks and my world has been filled with doctors, hospitals, follow-ups, work, and trying to keep everyone healthy and away from trouble.
It appears these issues are starting to get more settled - which means I'll be able to stay more focused on work - instead of driving around everywhere and waiting for appointments.
Get some..
#trading #research #investing #tradingalgos #tradingsignals #cycles #fibonacci #elliotwave #modelingsystems #stocks #bitcoin #btcusd #cryptos #spy #gold #nq #investing #trading #spytrading #spymarket #tradingmarket #stockmarket #silver
